. 2019 May;21(5):627-639.
doi: 10.1038/s41556-019-0309-2. Epub 2019 Apr 15.

Bone vascular niche E-selectin induces mesenchymal-epithelial transition and Wnt activation in cancer cells to promote bone metastasis

Affiliations

Bone vascular niche E-selectin induces mesenchymal-epithelial transition and Wnt activation in cancer cells to promote bone metastasis

Mark Esposito et al. Nat Cell Biol. 2019 May.

Abstract

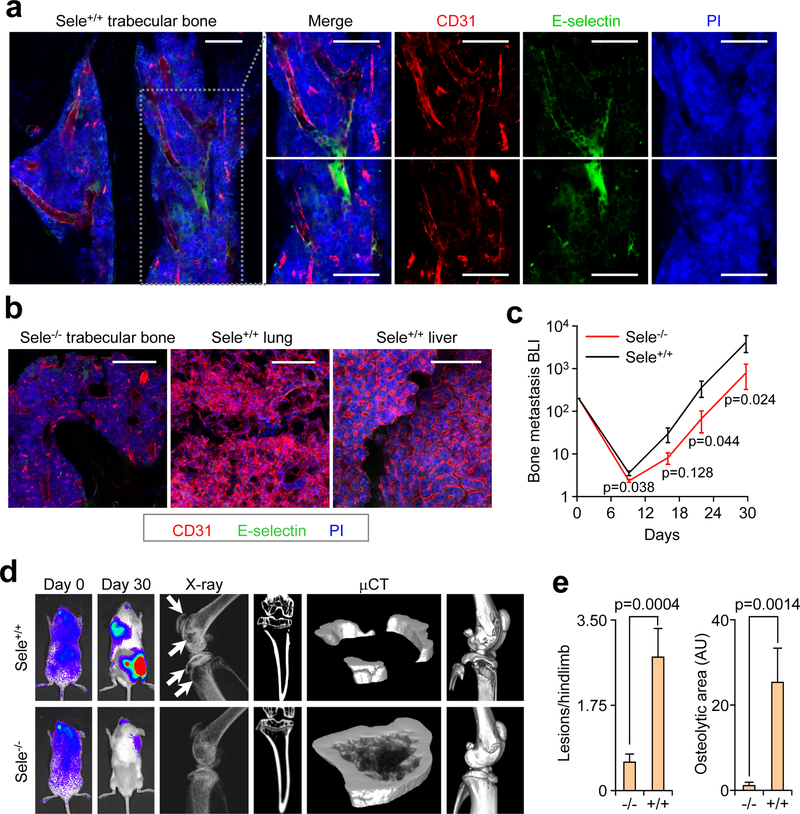
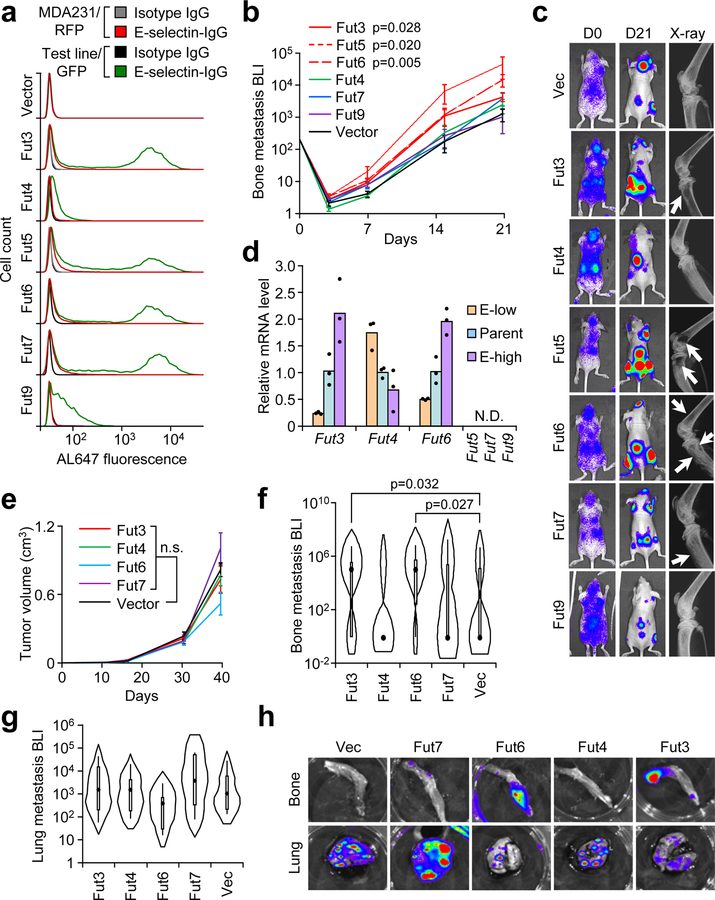
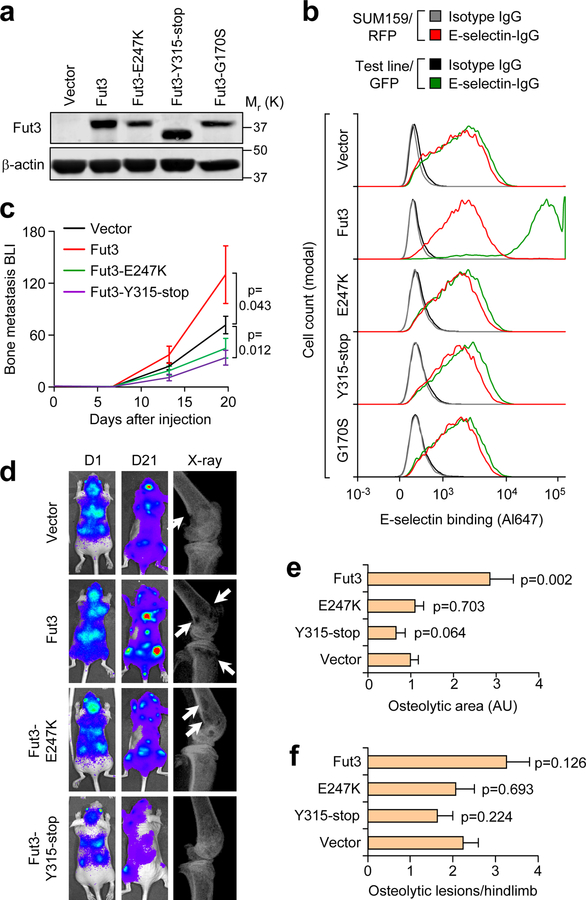
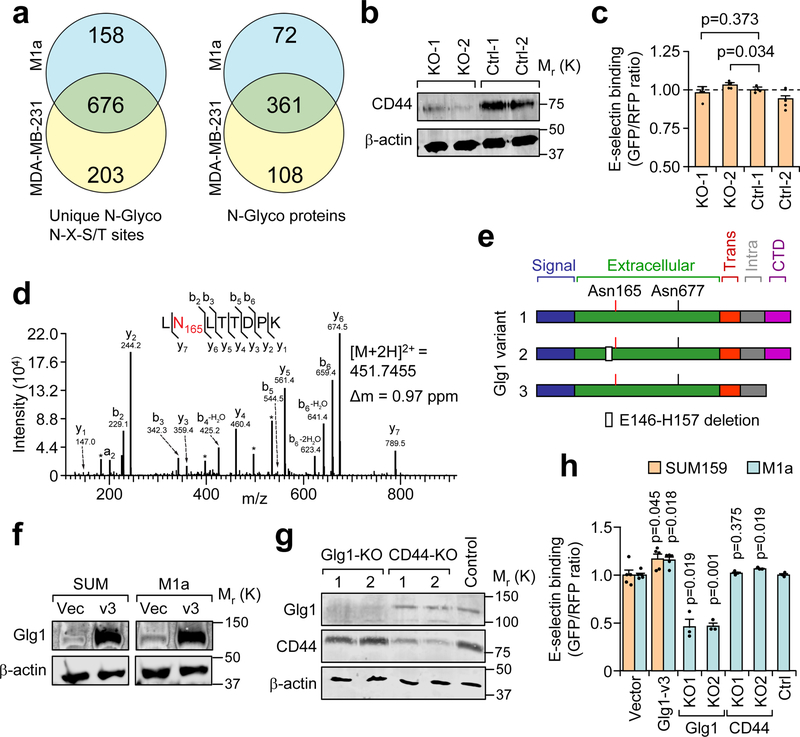
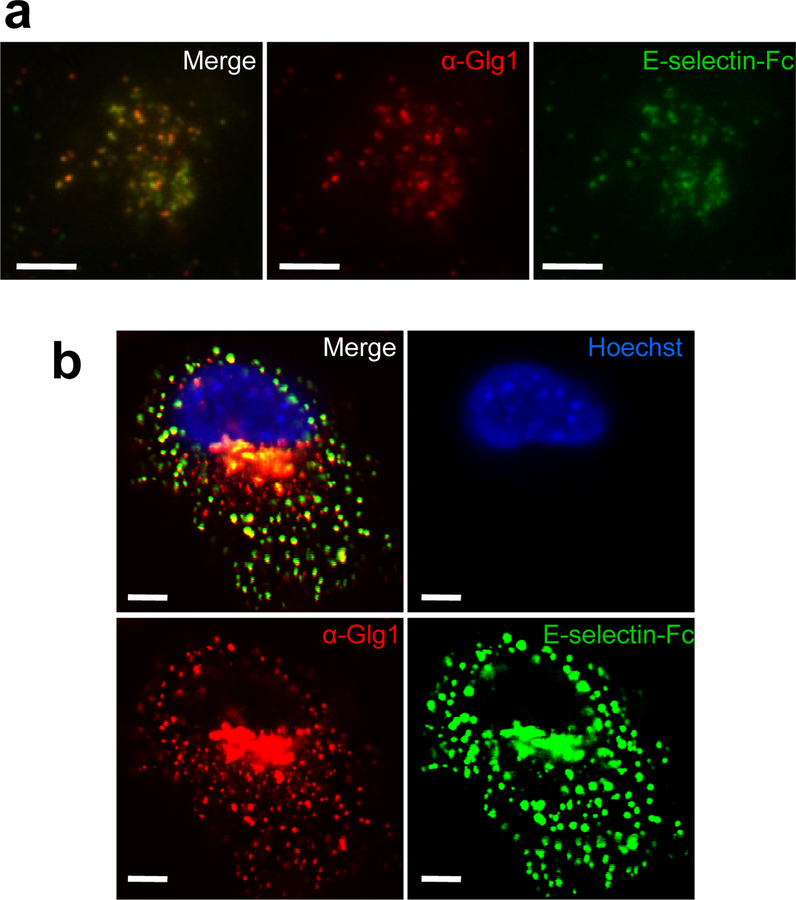
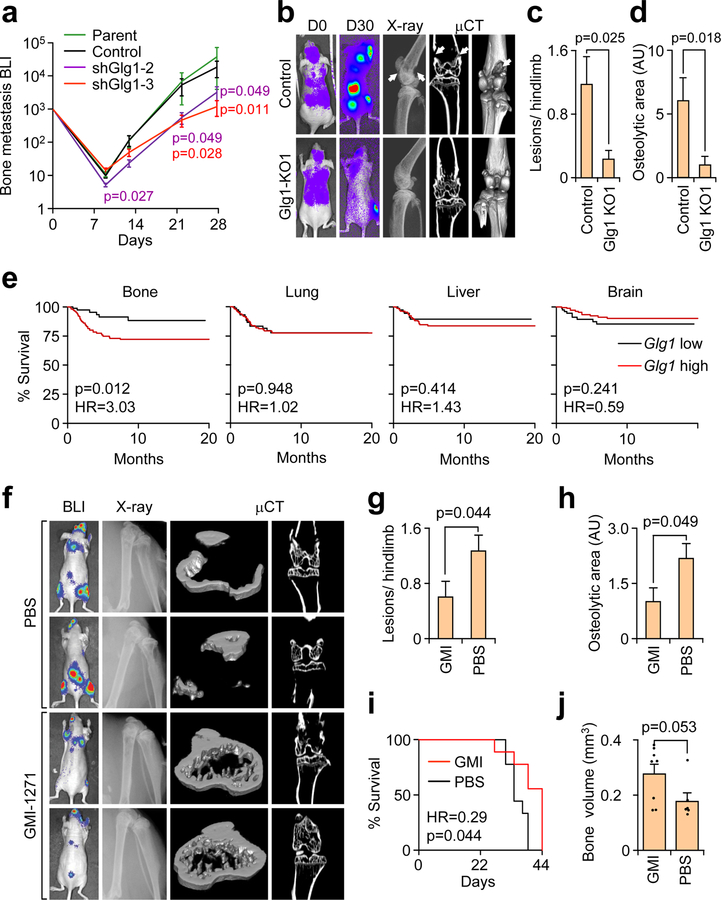
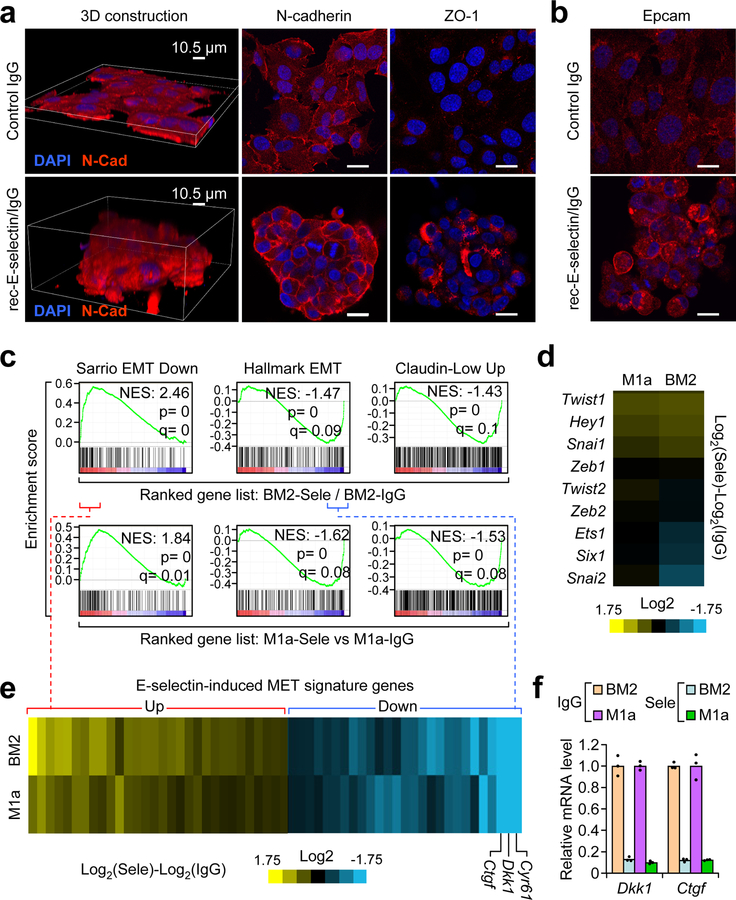
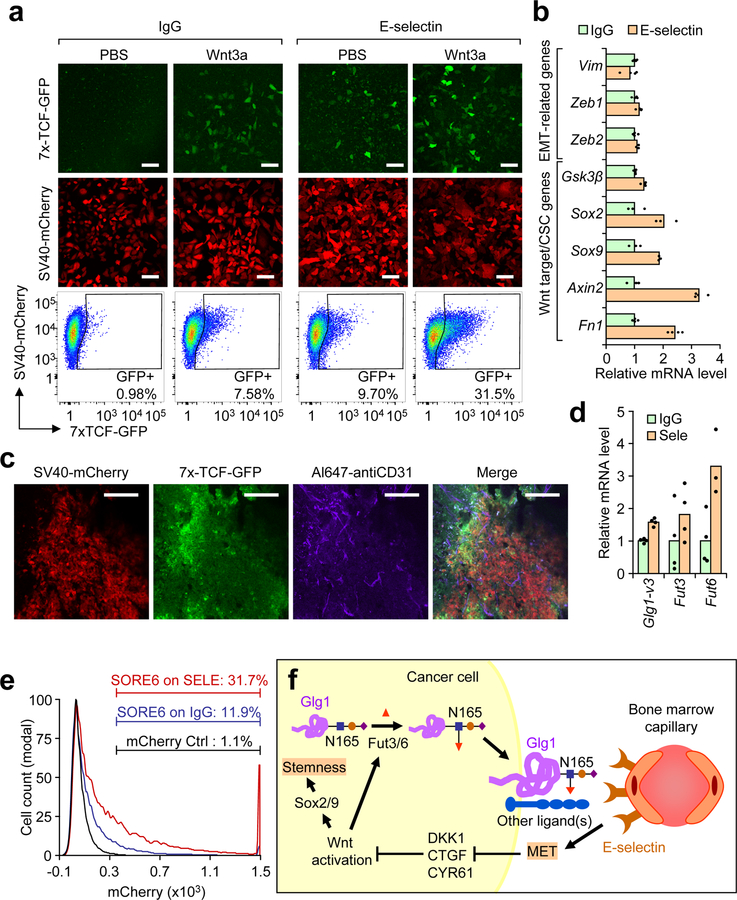
How disseminated tumour cells engage specific stromal components in distant organs for survival and outgrowth is a critical but poorly understood step of the metastatic cascade. Previous studies have demonstrated the importance of the epithelial-mesenchymal transition in promoting the cancer stem cell properties needed for metastasis initiation, whereas the reverse process of mesenchymal-epithelial transition is required for metastatic outgrowth. Here we report that this paradoxical requirement for the simultaneous induction of both mesenchymal-epithelial transition and cancer stem cell traits in disseminated tumour cells is provided by bone vascular niche E-selectin, whose direct binding to cancer cells promotes bone metastasis by inducing mesenchymal-epithelial transition and activating Wnt signalling. E-selectin binding activity mediated by the α1-3 fucosyltransferases Fut3/Fut6 and Glg1 are instrumental to the formation of bone metastasis. These findings provide unique insights into the functional role of E-selectin as a component of the vascular niche critical for metastatic colonization in bone.


Conflict of interest statement

Competing Financial Interests

No other authors declare potential conflicts of interest.

Figures

Figure 1
Figure 1. E-selectin is critical for bone but not lung metastasis.
(a,b) Bone, lung, and liver sections from WT or Sele−/− mice were assessed for E-selectin expression and CD31 co-localization by immunofluorescence. Scale bars: 100 μm. Data representative of three independent experiments. (c) BLI quantification of bone metastasis burden following intracardiac injection of the BM2 cell line into WT or Sele−/− SCID mice. n = 12 mice/group, Mann-Whitney U test, two-sided. (d) Representative BLI, X-ray, and μCT images of bone metastasis in WT and Sele−/− SCID mice. Images representative of median signal from (c). White arrows indicate osteolytic lesions. (e) Quantification of osteloytic area and the number of osteolytic lesions in the hind limbs of animals from (c). n = 23 Hindlimbs (WT), n = 24 hindlimbs (KO), Mann-Whitney U test, two-sided. Data representative of two independent experiments (c,d,e). Data represent mean ± SEM.
Figure 2
Figure 2. Specific α1–3 Fucosyltransferases (Fut3 and Fut6) promote bone metastasis.
(a) Comparative flow cytometry analysis of E-selectin binding to MDA-MB-231 cells with stable ectopic expression of α1–3 Fut enzymes. MDA-MB-231-RFP was used as an internal control. Data representative of four independent experiments. (b) BLI quantification of bone metastasis burden following intracardiac injection of M1a cells stably expressing each Fut enzyme into Nu/Nu mice. n = 6 (Fut3, Fut4, Fut6), 5 (Fut5, Fut9), 3 (Fut7), and 10 (Vector) mice. Statistics by Mann-Whitney U test at Day 21, two-sided. (c) Representative BLI and X-ray images of bone lesions from (b). White arrows indicate osteolytic lesions. (d) qPCR analysis of endogenous α1–3 Fut mRNA levels in the parental and sorted MDA-MB-231 cells with differential E-selectin binding abilities. Fut5/7/9 were not detectable (N.D.) in all cell lines. n = 3 technical replicates. (e) Tumor volume measurements after orthotopic injection of M1a cells stably-expressing each relevant Fut enzyme into NSG mice. p > 0.05 for all between-group comparisons by two-sided Student’s t-test at Day 39. n = 6 mice/group. (f,g) Violin plot showing BLI quantification of spontaneous bone (f) and lung (g) metastasis burden. Plot elements include median, box for interquartile range, spikes to upper- and lower- adjacent values. Statistics by Mann Whitney U test, one-sided. n = 11 lung/22 hindlimb (Fut3 and Fut 4), 6 lung/12 hindlimb (Fut 6 and Fut 7), and 12 lung/24 hindlimb (Vector). (h) Representative BLI images of bone and lung tissues from each experimental group. Experiment performed once (e-h). Data represent mean ± SEM. No statistically significant difference (p>0.05) between Fut4, Fut7, and Fut9 groups vs Vector group in b, Fut 4 and Fut 7 groups vs Vector group in f, and any group vs Vector group in e and g.
Figure 3
Figure 3. In vitro and in vivo characterization of Fut3 catalytic mutants.
(a) Western blot detection of three Fut3 catalytic mutants compared to wild-type Fut3 ectopically expressed in SUM159-M1a cells. (b) Comparative flow cytometry analysis of E-selectin binding to M1a cells expressing each Fut3 mutant using SUM159-RFP as an internal control. Data representative of 3 independent experiments (a,b). (c) BLI quantification of bone metastasis burden following intracardiac injection of M1a cells stably expressing each Fut3 mutant compared to vector and wild-type Fut3. n = 8 (Fut3 and Y315-stop) and 9 (E247K and Vector) mice/group. Mann-Whitney U test, two-sided. (d) Representative BLI and X-ray images from (c). (e,f) Quantification of osteloytic area (e) and the number of osteolytic lesions (f) in the hind limbs of Nu/Nu mice receiving an intracardiac injection of M1a cells expressing each Fut3 mutant. n = 16 (Fut3 and Y315-stop) and 18 (E247K and Vector) hindlimbs/group. Mann-Whitney U test, two-sided. Experiment performed once (cf). Data represent mean ± SEM. Unprocessed original scans of the blots in a are shown Supplementary Fig. 9.
Figure 4
Figure 4. Cell surface N-glycan analysis reveals candidate E-selectin ligands in metastatic breast cancer cells.
(a) Summary of mass spectrometry results of N-glycosites and N-glyco proteins using two biological replicates of each cell line collected over independent isolations. (b) Western blot confirming CD44 knockout by CRISPR-Cas9 in the BM2 cell line. Data representative of 3 independent experiments. (c) Comparative flow cytometry analysis of E-selectin binding to CD44-KO and control BM2 cell lines. MDA-MB-231-RFP used as an internal control and binding levels normalized to Ctrl-1. n = 4 independent biological replicates, Student’s t-test, two-sided. (d) Representative fragmentation spectra of the doubly-charged Glg1 tryptic peptide LNLTTDPK containing deamidated Asn(N)165 (red). N- and C-terminal (b and y) ions matching the predicted peptide fragment are indicated with their respective mass-to-charge (m/z) values. A complete y ion series was observed, including the site-determining y7 ion, localizing the deamidation to the Asn residue. The measured doubly-charged monoisotopic precursor ion m/z and its mass deviation (Δm) relative to the theoretical m/z are indicated. * interfering m/z from lower abundance co-isolated ion(s). Similar fragmentation spectra were obtained across independent isolations. (e) Schematic diagram of the three major Glg1 splice variants in humans. (f) Western blot analysis of Glg1 expression in SUM159 and M1a cells after stable transduction of retroviral vector expressing Glg1 variant 3. (g) Western blot analysis of Glg1 and CD44 after population-level CRISPR/Cas9 knockout of Glg1 and CD44 in M1a cells. Data representative of three independent experiments (f, g). (h) Comparative flow cytometry analysis of E-selectin binding to genetically manipulated SUM159 and M1a cells using SUM159-RFP as an internal control. Binding levels were normalized to respective controls. n = 5 (Glg1 or Vector), n = 3 (KO cell lines) independent biological replicates. Student’s t-test, two-sided, compares Glg1v3 cells to Vector cells and CRISPR-KO cells to CRISPR-Control cells. Data represent mean ± SEM. Unprocessed original scans of the blots in b, f, g are shown Supplementary Fig. 9.
Figure 5
Figure 5. E-selectin ligands co-localize with Glg1 at the cell surface.
(a) Total internal reflectance fluorescence (TIRF) microscopy at the critical angle using a spinning disc was performed on SUM159-M1a cells probed with recombinant E-selectin-Fc (green) and anti-Glg1 (red). Scale bar represents 5 μm. (b) Confocal Z-slice of M1a cells probed with E-selectin-Fc (green), anti-Glg1 (red) and Hoechst (blue). Scale bar represents 5 μm. Data representative of 3 independent experiments (a, b).
Figure 6
Figure 6. Glg1 is required to support bone metastasis progression.
(a) BLI quantification of bone metastasis burden after intracardiac injection of BM2 cells stably expressing Glg1-targeting or control shRNA or untransduced (parental) BM2 cells into Nu/Nu mice. n = 8 mice/group. Mann-Whitney U test, two-sided, compares shGlg1 BLI signal to control BLI signal. Data representative of two independent experiments. (b) Representative BLI, X-ray, and μCT images from mice injected with BM2 cells modified by CRISPR-mediated Glg1 knockout. White arrows indicate osteolytic bone lesions. (c,d) The number of lesions/ hindlimb (c) and average osteolytic area (d) were quantified from X-ray images in b. n = 17 hindlimbs/group. Mann-Whitney U test, two-sided. Data representative of two independent experiments (a-d). (e) Kaplan-Meier organ-specific metastasis-free survival curves of ER breast cancer patients in the EMC-MSK data set stratified by median expression level of Glg1 mRNA. n = 244, Cox’s proportional hazards model, two-sided. (f) Representative BLI, X-ray, and μCT images of mice treated with either GMI-1271 or PBS control after intracardiac injection of BM2 cells to generate bone metastasis in Nu/Nu mice. (g, h) Total number of lesions per hindlimb (g) and total osteolytic area (h) were quantified between treatments. n = 12 hindlimbs/group. Mann Whitney U test, two-sided. (i) Mice from f were censored upon becoming moribund and followed for Kaplan-Meier survival curve analysis. n = 9 mice/group, Cox’s proportional hazards model, two-sided. (j) Bones from moribund mice collected at day 39 (PBS, n = 3) or day 44 (GMI-1271, n = 4) were analyzed by μCT and trabecular bone volume from 4 mm above and below the knee joint was quantified. Mann-Whitney U test, two-sided. Experiment performed once (fj). Data represent mean ± SEM.
Figure 7
Figure 7. E-selectin binding to tumor cells induces a non-canonical mesenchymal-to-epithelial transition.
(a) Confocal imaging of E-selectin-induced morphological changes in M1a cells after culturing on E-selectin- compared to IgG-coated plates (10 μg/mL) for 24 h. Z-slice of confocal immunofluorescent images demonstrating N-cadherin and Tight Junction Protein-1 (ZO-1) localization/expression changes in M1a cells. Scale bars represent 20 μm. (b) Confocal imaging of EpCam immunofluorescence in BM2 cells seeded over E-selectin or IgG coated plates. Scale bars represent 20 μm. Images representative of 3 independent experiments (a–b). (c) GSEA of the Sarrio EMT Down (GSE8430), Hallmark EMT Up (M5930), and Claudin-low Up gene sets in the ranked gene list of the BM2 and M1a cells cultured in E-selectin- vs. IgG-coated plates. Single mRNA isolation used for each condition in each cell line. p and q statistics by GSEA software, n = 108 gene sets queried. (d) Heat map of the expression of known EMT transcriptional regulators in BM2 and M1a cells cultured in E-selectin vs. IgG coated plates. (e) Overlapping enrichment core genes from the Sarrio EMT down gene set (positive) and Hallmark EMT Up gene set (negative) between the BM2 and M1a cells were compiled to form the E-selectin-induced MET gene signature shown in the heatmap. The gene identities are listed in Supplementary Table 5. (f) qPCR analysis of Dkk1 and Ctgf mRNA levels in BM2 and M1a cells seeded over IgG or E-selectin for 24h. n = 3 technical replicates. Data represent mean ± SEM.
Figure 8
Figure 8. E-selectin-induced MET activates Wnt signaling.
(a) BM2 cells stably expressing the 7x TCF-GFP reporter and SV40-mCherry as internal control (BM2-TGC) were plated on either E-selectin or IgG coated (10 μg/mL) plates with or without recombinant Wnt3a (100 ng/mL). Fluorescence was assessed by confocal microscopy after 48 h and quantified by flow cytometry. Scale bars represent 100 μm. Data representative of >5 independent experiments. (b) qPCR analysis of EMT- or Wnt-associated genes from the BM2 cells plated on E-selectin or IgG (10 μg/mL) for 48 h. n= 3 technical replicates. (c) Ex vivo confocal images of bone metastasis in Nu/Nu mice injected with BM2-TGC. Live animal labeling with anti-CD31 was conducted to visualize vasculature. Scale bar represents 100 μm. Data representative of 4 biological replicates. (d) qPCR of Glg1-variant 3, Fut3 and Fut6 levels in BM2 cells seeded on either IgG or E-selectin (10 μg/mL) for 48 h. n = 4 technical replicates. (e) BM2 cells stably-expressing the SORE6-mCherry stemness reporter or control mCherry reporter were plated on E-selectin or control IgG (10 μg/mL) for 48 h. mCherry fluorescence was assessed by flow cytometry after 48 h. Data representative of 3 independent biological replicates. (f) Proposed model of E-selectin function during bone metastasis. Data represent mean ± SEM.

Comment in

References

    1. Valastyan S & Weinberg RA Tumor metastasis: molecular insights and evolving paradigms. Cell 147, 275–292 (2011). - PMC - PubMed
    1. Massague J & Obenauf AC Metastatic colonization by circulating tumour cells. Nature 529, 298–306 (2016). - PMC - PubMed
    1. Yang J & Weinberg RA Epithelial-mesenchymal transition: at the crossroads of development and tumor metastasis. Dev Cell 14, 818–829 (2008). - PubMed
    1. Nieto MA, Huang RY, Jackson RA & Thiery JP Emt: 2016. Cell 166, 21–45 (2016). - PubMed
    1. Esposito M, Guise T & Kang Y The Biology of Bone Metastasis. Cold Spring Harbor perspectives in medicine 8 (2018). - PMC - PubMed

Publication types

MeSH terms

Substances