. 2019 Apr 1;11(1):1586413.
doi: 10.1080/20002297.2019.1586413. eCollection 2019.

Analysis of oral bacterial communities: comparison of HOMI NGS with a tree-based approach implemented in QIIME

Affiliations

Analysis of oral bacterial communities: comparison of HOMI NGS with a tree-based approach implemented in QIIME

Robert J Palmer et al. J Oral Microbiol. .

Abstract

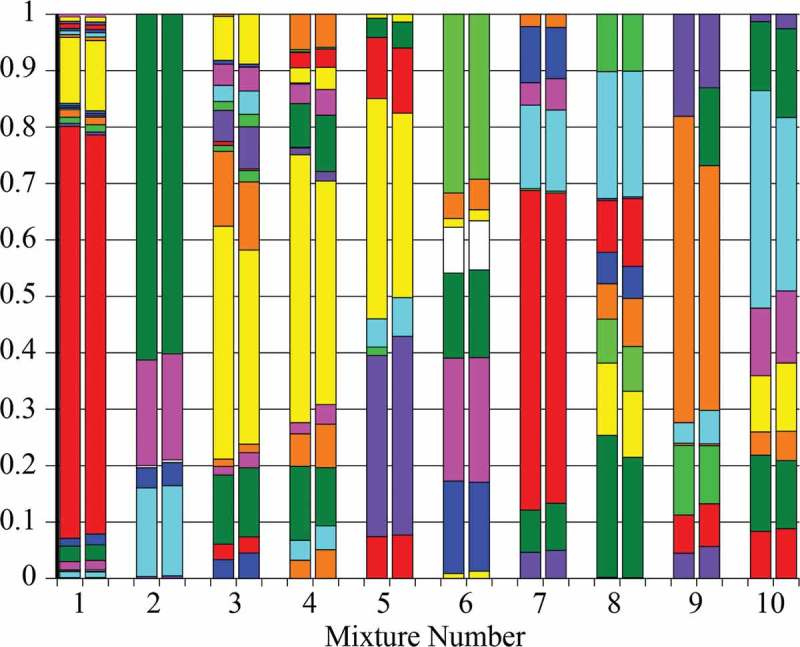
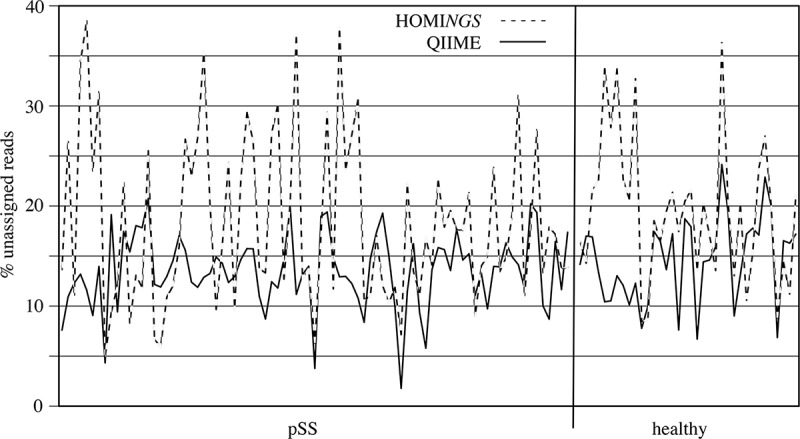
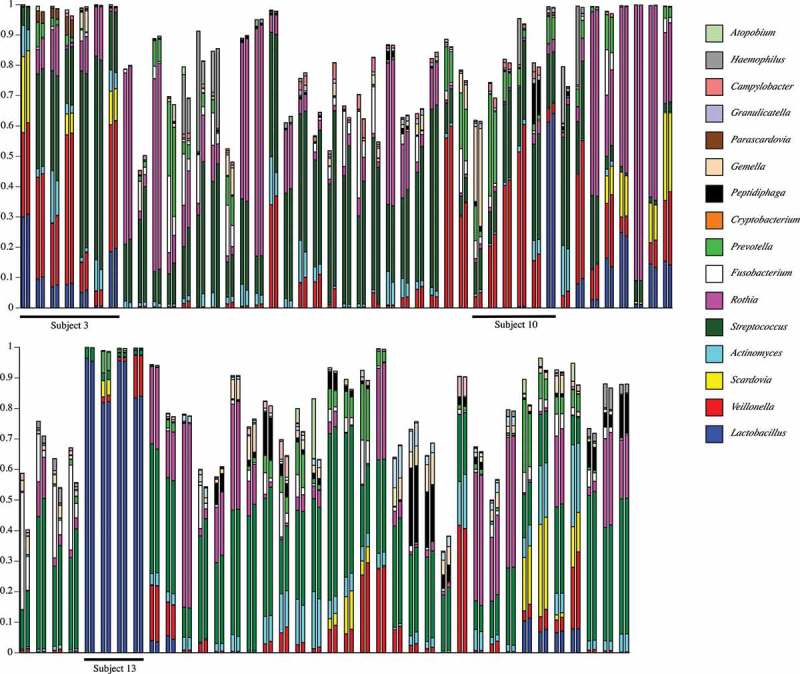
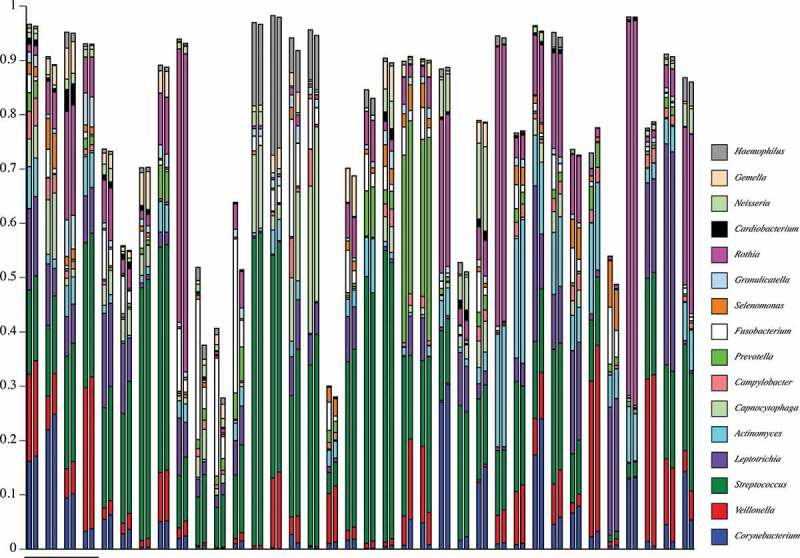
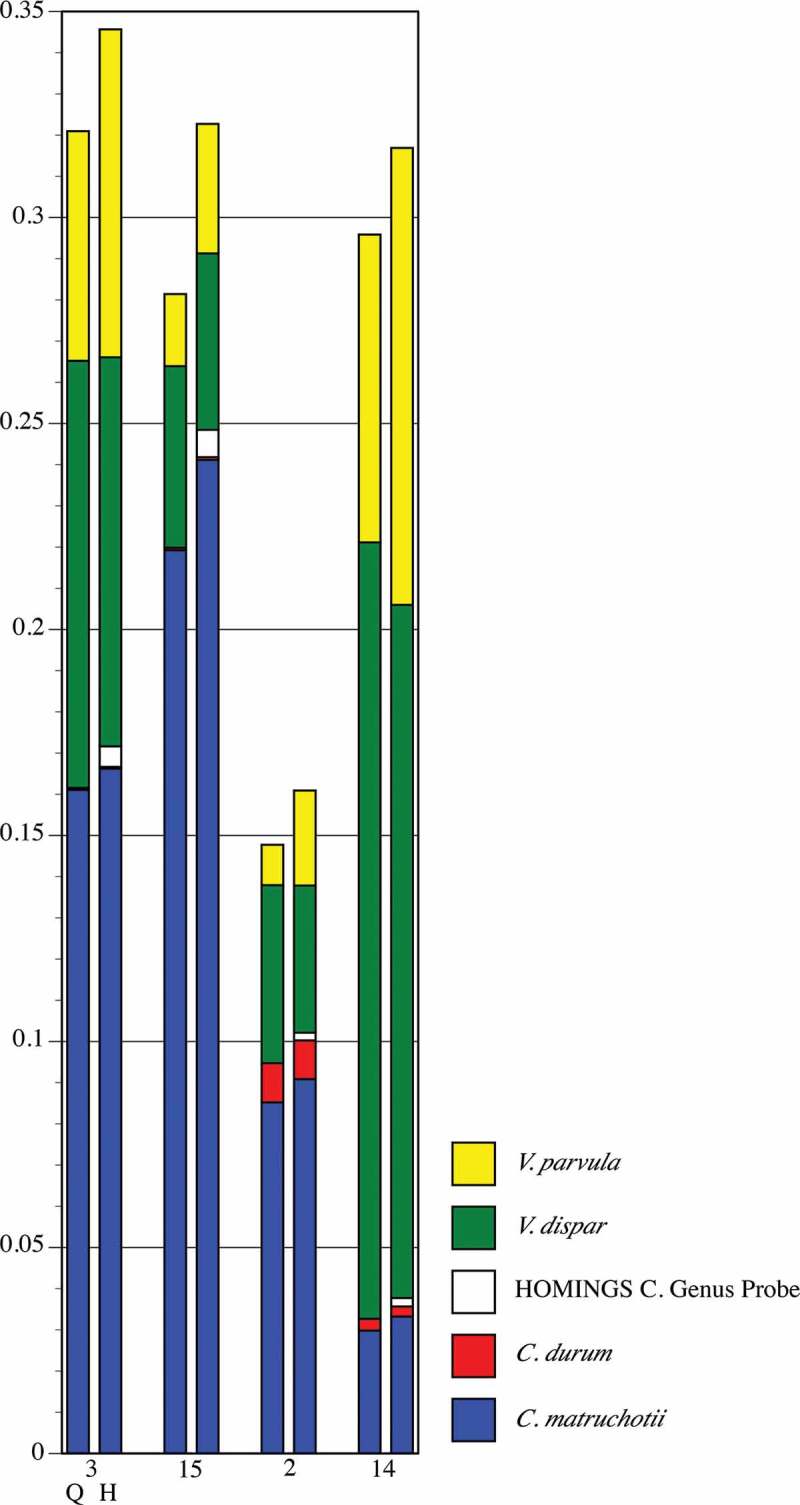
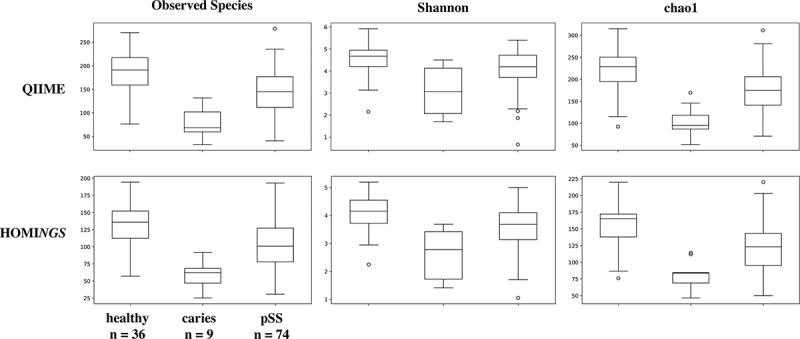
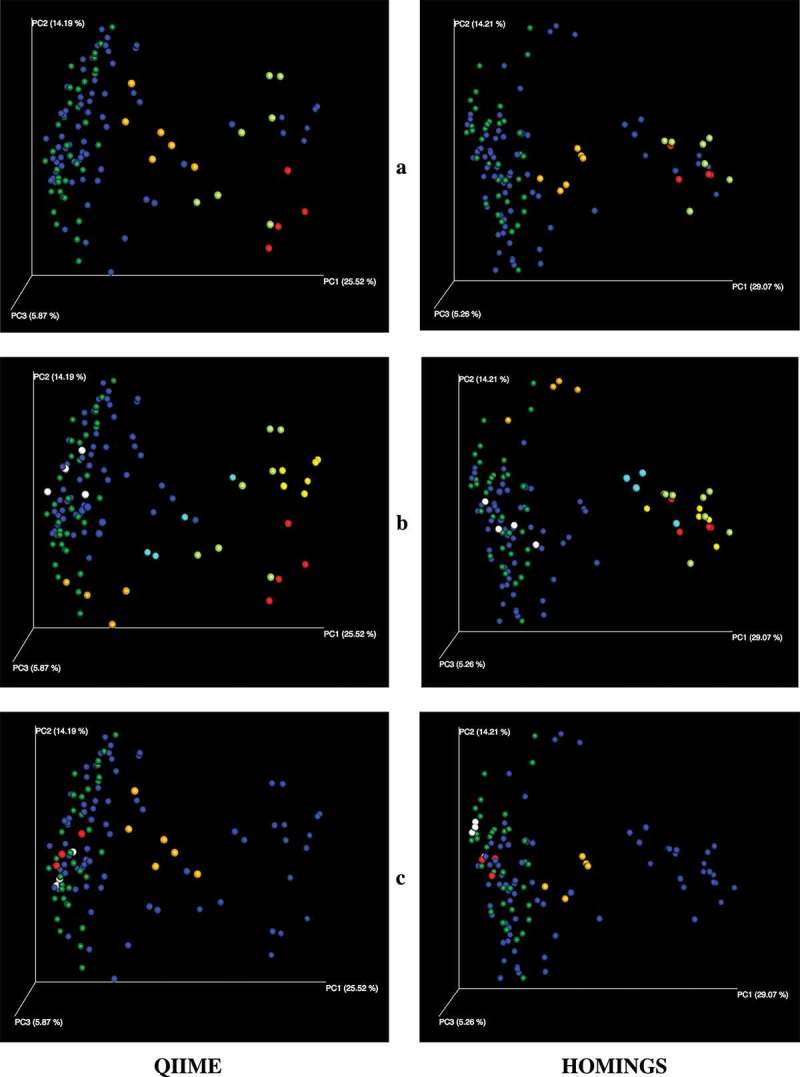
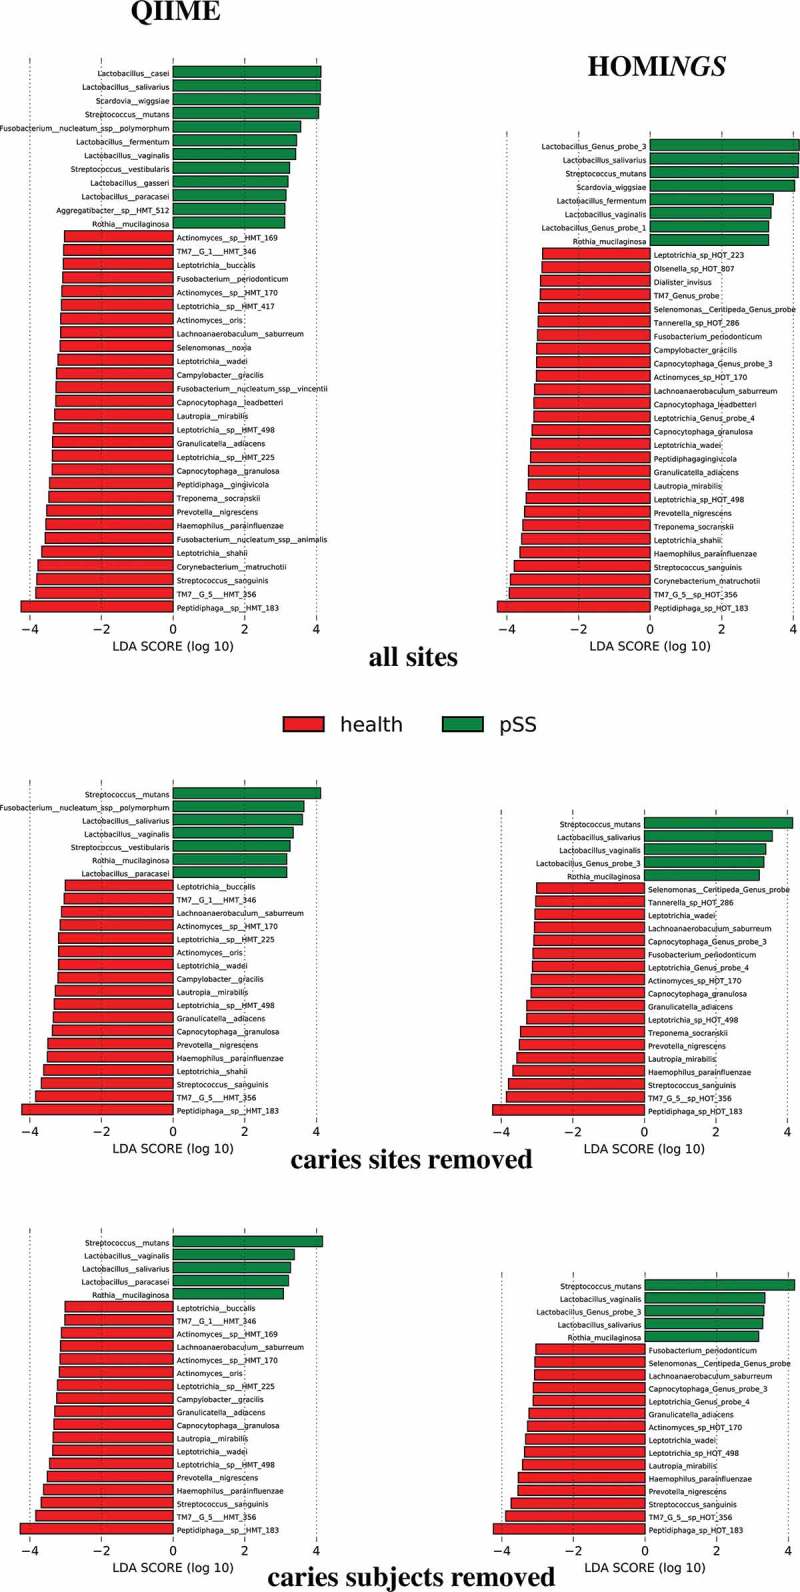
Background: Molecular taxonomic assignments in oral microbial communities have been made using probe-matching approaches, but never compared to those obtained by more readily accepted tree-based approaches. Objective: To compare community composition profiles obtained from a probe-matching approach (HOMINGS) to those from a closed-ended tree-based approach (QIIME using the eHOMD database). Design: HOMINGS and QIIME were used for parallel analysis of ten mock community samples, and of 119 supragingival plaque samples from ecologically unique sites (sound tooth surfaces in healthy subjects, sound tooth surfaces in patients with primary Sjögren's Syndrome, and carious lesions in Sjögren's Syndrome patients). Linear discriminant analysis Effective Size (LEfSe) was used to identify discriminating taxa among the natural plaque samples. Results: Community composition profiles of all samples were congruent between the two analysis aproaches. Alpha and beta diversity of the natural plaque communities were likewise similar. Communities from pSS patients and those from individuals with normal salivary flow differed in alpha and beta diversity. Both classification approaches yielded differences in composition predicted for samples from these subject cohorts, and discriminating taxa were similar between approaches. Conclusions: A direct comparison demonstrates that HOMINGS is largely equivalent to the tree-based approach as implemented here.

Keywords: HOMINGS; QIIME; microbiome; primary Sjögren’s Syndrome; supragingival dental plaque.


Figures

Figure 1.
Figure 1.
Proportional composition of 10 PCR product mixtures analyzed by QIIME (left column) and by ProbeSeq (right column). Colors represent individual sequences but are not the same for the different mixtures; 79 different products appear in the graph. Some sections in mixtures 1, 4 and 8 cannot be discerned because the amount of a particular sequence amount is low. See Supplementary Table 1 for all values.
Figure 2.
Figure 2.
Sample-dependent percentage of unassigned reads in QIIME, and of unmatched reads in HOMINGS, for all 119 samples. The vertical line separates pSS subjects (left) from healthy subjects (right).
Figure 3.
Figure 3.
Map of genus-level taxonomic assignments in samples from pSS subjects. Only the 16 most-abundant genera in pSS Subject 3 (underlined samples at upper left) are shown. Each plaque sample is represented as a pair of columns. Taxonomic assignments by QIIME are shown in the left column and those by HOMINGS in the right column. The underlined samples are from subjects with active caries. The seven samples from Subject 3 are examined in greater detail in subsequent figures.
Figure 4.
Figure 4.
Map of genus-level taxonomic assignments in samples from healthy subjects. Only the 16 most-abundant genera for healthy Subject 8 (underlined samples) are shown. Each plaque sample is represented as a pair of columns in which taxonomic assignments by QIIME are shown in the left column and those by HOMINGS in the right column. The samples from Subject 8 are examined in greater detail in subsequent figures.
Figure 5.
Figure 5.
Detail of proportional genus abundance in the seven samples from pSS Subject 3 (the underlined samples at upper left in Figure 3). Paired comparisons of assignments by QIIME (Q, left column) with those by HOMINGS (H, right column) for each tooth sample (tooth number, C = caries lesion, L = lingual surface).
Figure 6.
Figure 6.
Detail of proportional genus abundance in healthy Subject 8 (the underlined samples in Figure 4). Paired comparison of assignments by QIIME (Q, left column) and by HOMINGS (H, right column) for each tooth sample (tooth number).
Figure 7.
Figure 7.
Proportional abundance of Streptococcus spp. and Lactobacillus spp. for pSS Subject 3 (samples in Figure 5). Paired comparisons of assignments by QIIME (Q, left columns) with those by HOMINGS (H, right columns) for each tooth sample (tooth number, C = caries lesion, L = lingual surface). All species with abundance ≥0.005 (0.5%) in any sample are shown. For species that lack a species-level HOMINGS probe, the corresponding genus-level probe is shown. HOMINGS Streptococcus Genus Probe 4 (hatched blue block in the HOMINGS columns) covers the species indicated by dark/light blue blocks in the QIIME columns.
Figure 8.
Figure 8.
Proportional abundance of Streptococcus spp. and Leptotrichia spp. for healthy Subject 8 (samples in Figure 6). Paired comparisons of assignments by QIIME (Q, left columns) with those by HOMINGS (H, right columns) for each tooth sample (tooth number). All species with abundances greater than 0.005 (0.5%) in any sample are shown. For species that lack a HOMINGS probe, the corresponding genus-level probe is shown. HOMINGS Streptococcus Genus Probe 4 (hatched blue block in the HOMINGS columns) covers the species indicated by dark/light blue blocks in the QIIME columns. HOMINGS Streptococcus Genus Probe 1 covers S. gordonii. HOMINGS Leptotrichia Genus Probe 3 (brown) corresponds to L. hofstadiii and L. buccalis (brown hatched bars) in the QIIME analysis. HOMINGS Genus Probe 4 (white) had no equivalent species in the QIIME analysis.
Figure 9.
Figure 9.
Proportional abundance of Corynebacterium spp. and Veillonella spp. in healthy Subject 8 (samples in Figure 6). Paired comparisons of QIIME (left bar) with HOMINGS (right bar) for each tooth sample (tooth number). All species with abundances greater than 0.005 (0.5%) in any sample are shown. The HOMINGS Corynebacterium Genus Probe covers C. durum and C. matruchiotti.
Figure 10.
Figure 10.
Alpha diversity comparing samples from healthy subjects, caries samples from pSS subjects, and samples from sound tooth surfaces of pSS subjects.
Figure 11.
Figure 11.
PCoA plots of unweighted UniFrac distances. (a) Samples from healthy subjects in dark green. Samples from pSS subjects without active caries in dark blue. Samples from the three pSS subjects with active caries in bright green, red and orange. (b) Samples from healthy subjects in green. Samples from pSS subjects with measurable salivary flow in blue. Six pSS subjects had no measurable salivary flow. Samples from five of those subjects (yellow, light blue, bright green, orange, red) are separated from those of healthy subjects and other pSS subjects. Samples in red and bright green are from pSS subjects with caries who also had no measurable flow (see panel a). Samples from the sixth subject (white) are within the cluster of healthy samples. (c) Samples from healthy subjects in green. Samples from pSS subjects with reduced or no measurable salivary flow in blue. Three pSS subjects had normal salivary flow. Samples from two of those subjects (red, white) are within the cluster of healthy samples. The third subject (orange) had active caries (see panel a).
Figure 12.
Figure 12.
LEfSe analysis of abundance values for QIIME species ≥0.01% in any sample (left column) and HOMINGS probes (genus- and species-level) ≥0.01% of total probe counts in any sample (right column). All sites (top row), when samples from caries lesions are removed (middle row), and when samples from all subjects with caries are removed (bottom row). HMT refers to designations for unnamed/uncultured species in the eHOMD.

Similar articles

Cited by

References

    1. Marsh PD, Moter A, Devine DA. Dental plaque biofilms: communities, conflict and control. Periodontol 2000. 2011;55:16–15. PubMed PMID: WOS:000285065800002; English. - PubMed
    1. Socransky SS, Haffajee AD, Cugini MA, et al.. Microbial complexes in subgingival plaque. J Clin Periodontol. 1998;25(2):134–144. - PubMed
    1. Leung KCM, Leung WK, McMillan AS. Supra-gingival microbiota in Sjögren’s syndrome. Clin Oral Investig. 2007December;11(4):415–423. PubMed PMID: WOS:000251009800014; English. - PubMed
    1. Tanner ACR, Mathney JMJ, Kent RL, et al.. Cultivable anaerobic microbiota of severe early childhood caries. J Clin Microbiol. 2011April;49(4):1464–1474. PubMed PMID: WOS:000289080600042; English. - PMC - PubMed
    1. Abusleme L, Dupuy AK, Dutzan N, et al.. The subgingival microbiome in health and periodontitis and its relationship with community biomass and inflammation. ISME J. 2013May7;5:1016–1025. PubMed PMID: WOS:000317963300011; English DOI:10.1038/ismej.2012.174. - DOI - PMC - PubMed

LinkOut - more resources