. 2019 Mar 30:6:288-297.
doi: 10.1016/j.toxrep.2019.03.007. eCollection 2019.

Assessment of acute toxicity and biochemical responses to chlorpyrifos, cypermethrin and their combination exposed earthworm, Eudrilus eugeniae

Affiliations

Assessment of acute toxicity and biochemical responses to chlorpyrifos, cypermethrin and their combination exposed earthworm, Eudrilus eugeniae

Rishikesh K Tiwari et al. Toxicol Rep. .

Abstract

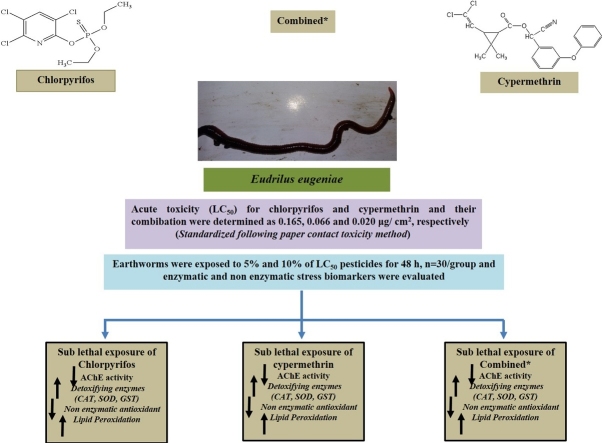
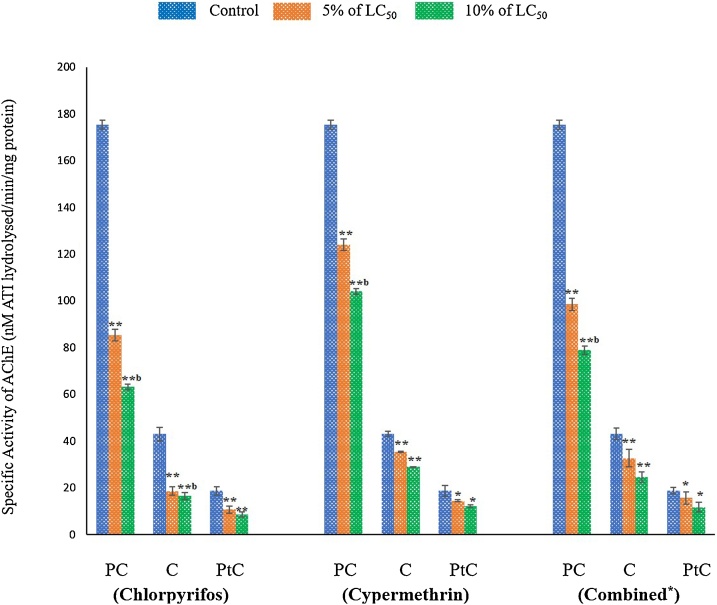
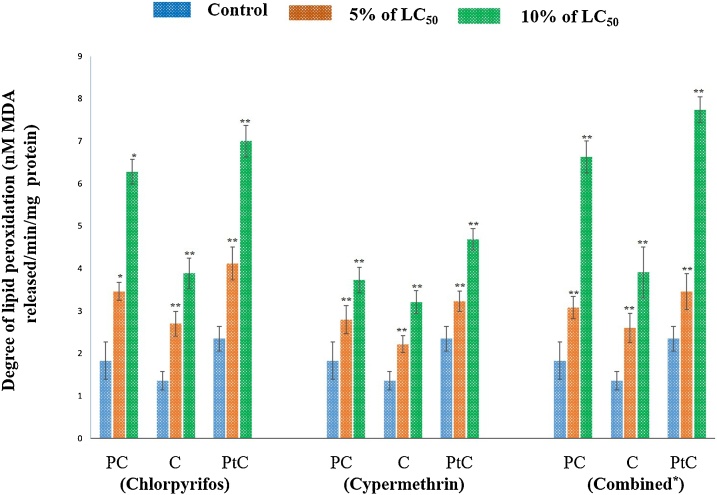
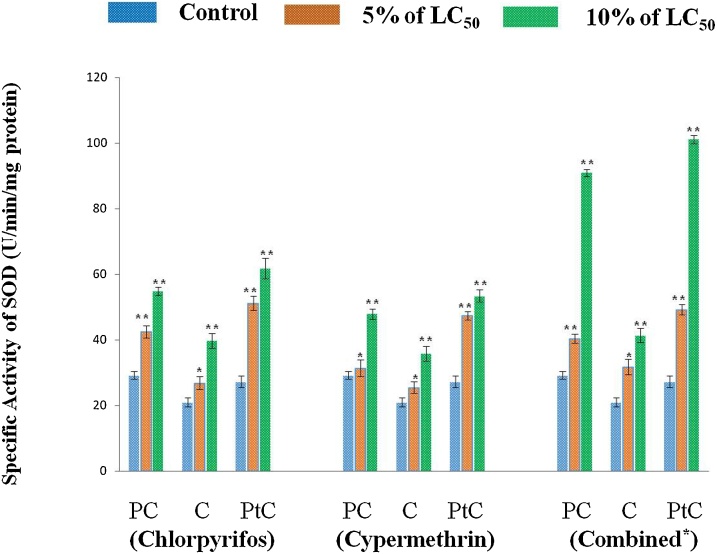
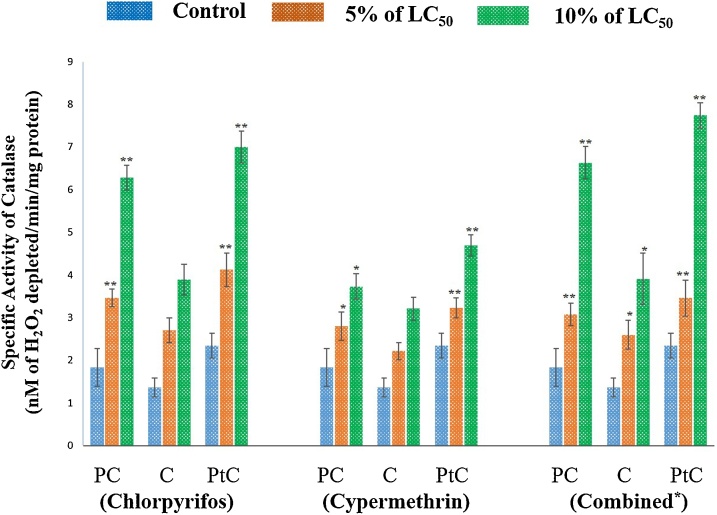
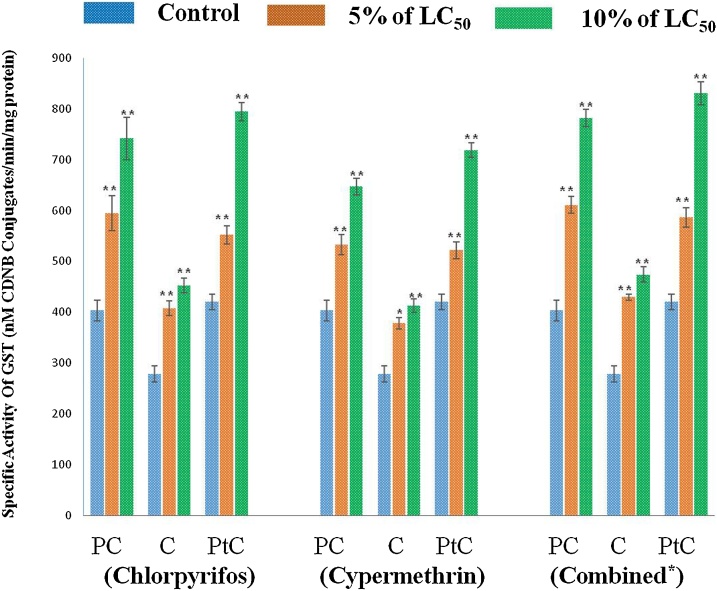
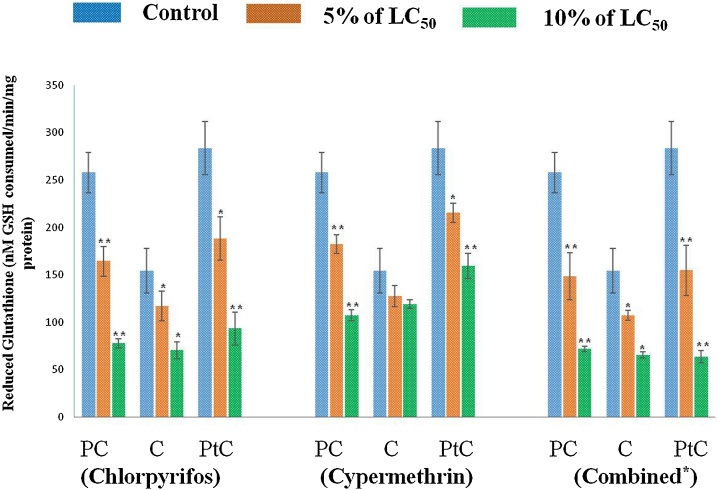
Recurrent application of chemical pesticides in the agricultural fields have adverse impact on flora and fauna of soil ecosystem. Earthworms immensely contribute in increasing the fertility of soil. They may act as a bioindicator for the ecotoxicological analysis of pesticide induced soil pollution. Earthworms, Eudrilus eugeniae were exposed to different concentrations of pesticides chlorpyrifos (OP), cypermethrin (a pyrethroid) and their combination for 48 h by paper contact toxicity method. The LC50 for commercial grade of chlorpyrifos, cypermethrin and combined pesticides were determined as 0.165, 0.066 and 0.020 μg/cm2, respectively. To assess the sub-lethal effect of these pesticides, E. eugeniae were exposed to 5% and 10% of LC50 of the pesticides for 48 h. Variation in morpho-behavioural changes such as coiling, clitellar swelling, mucus release, bleeding and body fragmentation in earthworms were observed after exposure of both pesticides and their combination. Various biochemical estimations such as specific activity of acetylcholinesterase (AChE), superoxide dismutase (SOD), catalase (CAT), glutathione -S-transferase (GST); levels of lipid peroxidation (LPO) and reduced glutathione (GSH) were carried out in different body segments. Significant changes in these stress markers were observed at low and high sub-acute concentration of pesticides exposed earthworm, Eudrilus eugeniae. Such changes indicate potential health risk to E. eugeniae if exposed to the high concentrations of these pesticides accumulated in soil.

Keywords: AChE activity; Chlorpyrifos; Chlorpyrifos + Cypermethrin; Cypermethrin; Eudrilus eugeniae; Stress markers.


Figures

None
Graphical abstract
Fig. 1
Fig. 1
Morphological changes in earthworm E. eugeniae exposed to different concentrations of chlorpyrifos, cypermethrin and their combination (A–L). A: Control and B: 0.112 μg/cm2, C: 0.196 μg/cm2, D: 0.224 μg/cm2 concentrations of chlorpyrifos; E: Control and F: 0.0168 μg/cm2, G: 0.0279 μg/cm2, H: 0.0391 μg/cm2 concentrations of cypermethrin and I: Control and J: 0.055 μg/cm2 K: 0.075 μg/cm2 L: 0.095 μg/cm2 concentrations of their combination (chlorpyrifos + cypermethrin). WBC: Whole Body Coiling, BC: Body Constriction, FB: Fragmentation of Body, TB: Thinning of Body, CS: Clitellar Shrinkage, BC: Body coiling.
Fig. 2
Fig. 2
For chlorpyrifos treated group, data represents mean ± SEM. ** p < 0.01 control vs 5% (8.4 ng/cm2) and 10% (16.8 ng/cm2.) of LC50. For cypermethrin exposed group, data represents mean ± SEM. * p < 0.05 control vs 5% (1.0 ng/cm2) and 10% (2.0 ng/cm2) of LC50, ** p < 0.01 control vs 5% and 10% of LC50 and for the earthworms exposed to combination of pesticide, data represents mean ± SEM * p < 0.05 control vs 5% and 10% of LC50, ** p < 0.01 control vs 5% (3.3 ng/cm2) and 10% (6.6 ng/cm2) of LC50. Here, PC: Pre-clitellar, C: Clitellar and PtC: Post- clitellar regions of earthworm.
Fig. 3
Fig. 3
For chlorpyrifos treated group, data represents mean ± SEM. ** p < 0.01 control vs 5% (8.4 ng/cm2) and 10% (16.8 ng/cm2.) of LC50. For cypermethrin exposed group, data represents mean ± SEM. * p < 0.05 control vs 5% (1.0 ng/cm2) and 10% (2.0 ng/cm2) of LC50, ** p < 0.01 control vs 5% and 10% of LC50 and for the earthworms exposed to combination of pesticide, data represents mean ± SEM * p < 0.05 control vs 5% and 10% of LC50, ** p < 0.01 control vs 5% (3.3 ng/cm2) and 10% (6.6 ng/cm2) of LC50. Here, PC: Pre-clitellar, C: Clitellar and PtC: Post- clitellar regions of earthworm.
Fig. 4
Fig. 4
For chlorpyrifos treated group, data represents mean ± SEM. ** p < 0.01 control vs 5% (8.4 ng/cm2) and 10% (16.8 ng/cm2.) of LC50. For cypermethrin exposed group, data represents mean ± SEM. * p < 0.05 control vs 5% (1.0 ng/cm2) and 10% (2.0 ng/cm2) of LC50, ** p < 0.01 control vs 5% and 10% of LC50 and for the earthworms exposed to combination of pesticide, data represents mean ± SEM * p < 0.05 control vs 5% and 10% of LC50, ** p < 0.01 control vs 5% (3.3 ng/cm2) and 10% (6.6 ng/cm2) of LC50. Here, PC: Pre-clitellar, C: Clitellar and PtC: Post- clitellar regions of earthworm.
Fig. 5
Fig. 5
For chlorpyrifos treated group, data represents mean ± SEM. ** p < 0.01 control vs 5% (8.4 ng/cm2) and 10% (16.8 ng/cm2.) of LC50. For cypermethrin exposed group, data represents mean ± SEM. * p < 0.05 control vs 5% (1.0 ng/cm2) and 10% (2.0 ng/cm2) of LC50, ** p < 0.01 control vs 5% and 10% of LC50 and for the earthworms exposed to combination of pesticide, data represents mean ± SEM * p < 0.05 control vs 5% and 10% of LC50, ** p < 0.01 control vs 5% (3.3 ng/cm2) and 10% (6.6 ng/cm2) of LC50. Here, PC: Pre-clitellar, C: Clitellar and PtC: Post- clitellar regions of earthworm.
Fig. 6
Fig. 6
For chlorpyrifos treated group, data represents mean ± SEM. ** p < 0.01 control vs 5% (8.4 ng/cm2) and 10% (16.8 ng/cm2.) of LC50. For cypermethrin exposed group, data represents mean ± SEM. * p < 0.05 control vs 5% (1.0 ng/cm2) and 10% (2.0 ng/cm2) of LC50, ** p < 0.01 control vs 5% and 10% of LC50 and for the earthworms exposed to combination of pesticide, data represents mean ± SEM * p < 0.05 control vs 5% and 10% of LC50, ** p < 0.01 control vs 5% (3.3 ng/cm2) and 10% (6.6 ng/cm2) of LC50. Here, PC: Pre-clitellar, C: Clitellar and PtC: Post- clitellar regions of earthworm.
Fig. 7
Fig. 7
For chlorpyrifos treated group, data represents mean ± SEM. ** p < 0.01 control vs 5% (8.4 ng/cm2) and 10% (16.8 ng/cm2.) of LC50. For cypermethrin exposed group, data represents mean ± SEM. * p < 0.05 control vs 5% (1.0 ng/cm2) and 10% (2.0 ng/cm2) of LC50, ** p < 0.01 control vs 5% and 10% of LC50 and for the earthworms exposed to combination of pesticide, data represents mean ± SEM * p < 0.05 control vs 5% and 10% of LC50, ** p < 0.01 control vs 5% (3.3 ng/cm2) and 10% (6.6 ng/cm2) of LC50. Here, PC: Pre-clitellar, C: Clitellar and PtC: Post- clitellar regions of earthworm.

References

    1. van Gestel C.A.M., Koolhaas J.E., Hamers T., van Hoppe M., van Roovert M., Korsman C., Reinecke S.A. Effects of metal pollution on earthworm communities in a contaminated floodplain area: linking biomarker, community and functional responses. Environ. Pollut. 2009;157:895–903. - PubMed
    1. Ali A.S., Naaz I. Earthworm biomarkers: the new tools of environmental impact assessment. Biosci. Biotechnol. Res. Commun. 2013;6:163–169.
    1. Handrix P.F. Soil fauna. In: Sumner M.E., editor. Handbook of Soil Science. Section C. Soil Biology and Biochemistry. 2000. pp. C45–C85. Boca Raton-London-New York- Washington D C.
    1. Jadhav S.S., David M. Effect of flubendiamide on morphology, avoidance behaviour and acetylcholinesterase activity in earthworm Eudrilus eugeniae. Int. J. Pharm. Pharm. Sci. 2017;9:233–238.
    1. Chen J., Saleem M., Wang C., Liang W., Zhang Q. Individual and combined effects of herbicide tribenuron-methyl and fungicide tebuconazole on soil earthworm Eisenia fetida. Sci. Rep. 2018;8:2967. - PMC - PubMed