

Fluorescent Nano-Biomass Dots: Ultrasonic-Assisted Extraction and Their Application as Nanoprobe for Fe3+ detection
- PMID: 30989400
- PMCID: PMC6465388
- DOI: 10.1186/s11671-019-2950-x
Fluorescent Nano-Biomass Dots: Ultrasonic-Assisted Extraction and Their Application as Nanoprobe for Fe3+ detection
Abstract
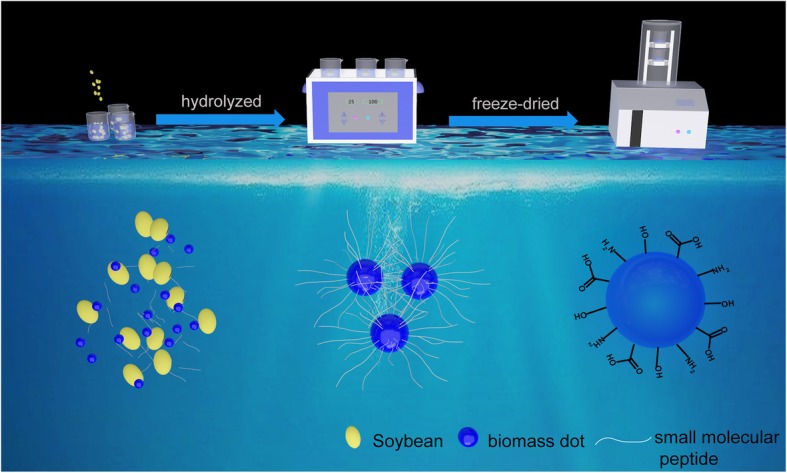
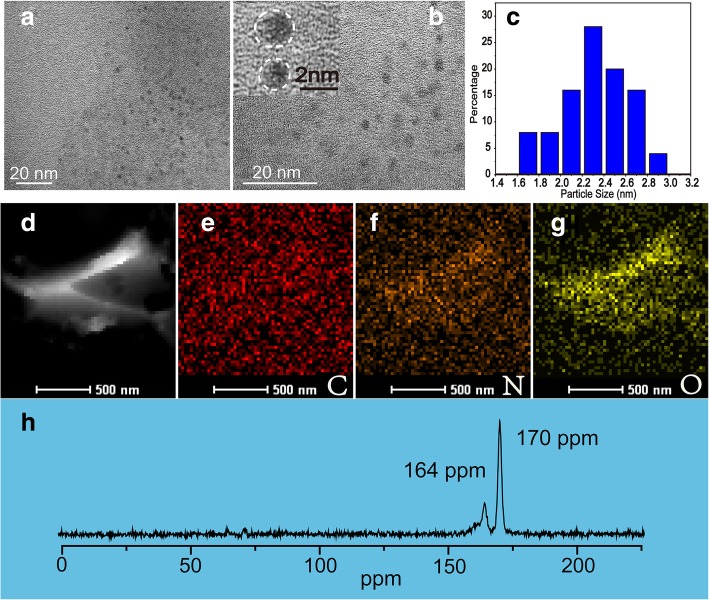
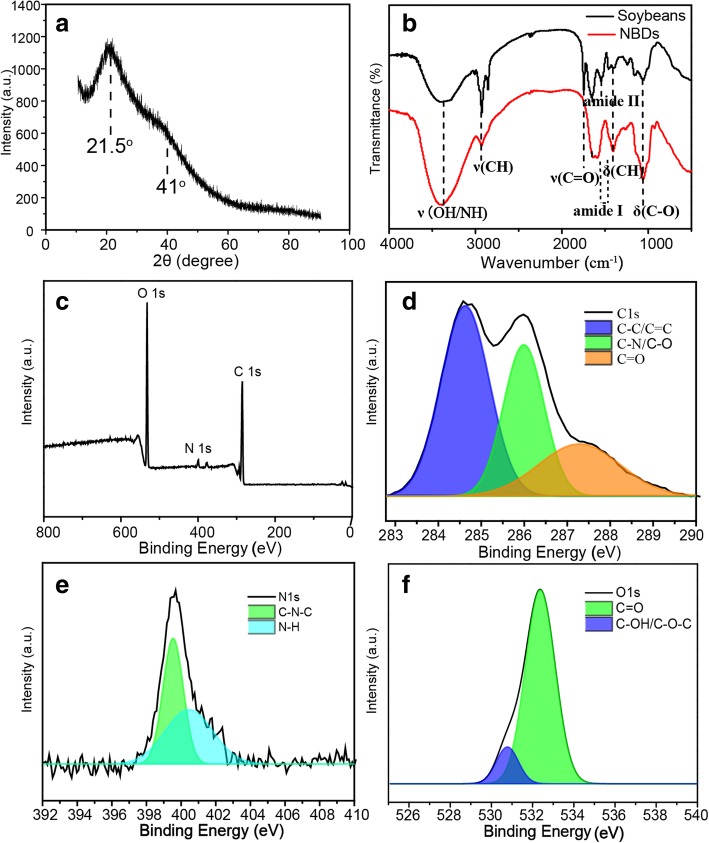
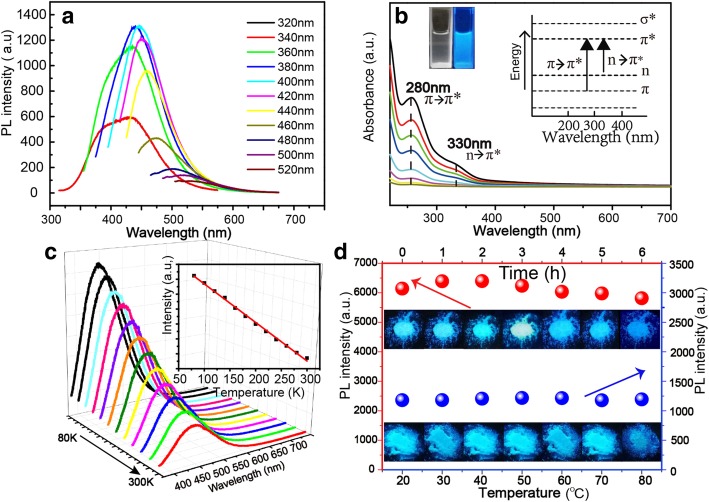
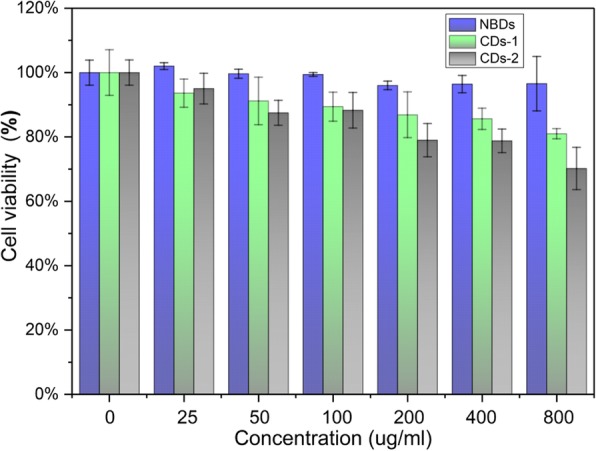
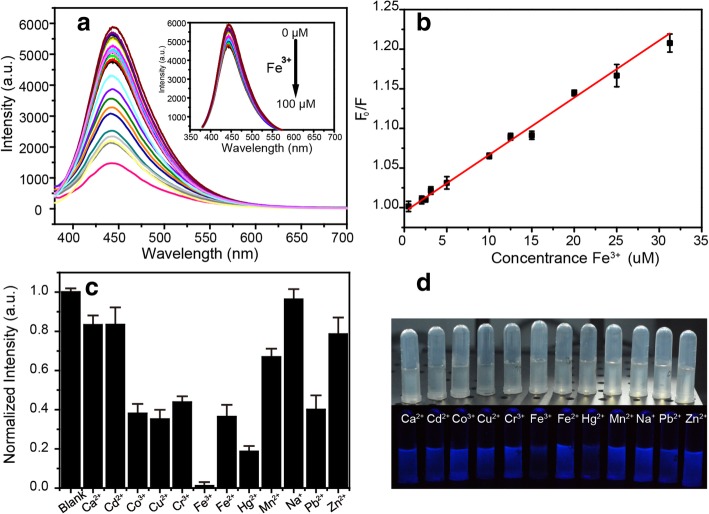
Biomass as sustainable and renewable resource has been one of the important energy sources for human life. Herein, luminescent nano-biomass dots (NBDs) have been extracted from soybean through ultrasonic method, which endows biomass with fluorescence property. The as-prepared NBDs are amorphous in structure with an average diameter of 2.4 nm and show bright blue fluorescence with a quantum yield of 16.7%. Benefiting from the edible raw materials and heating-free synthesis process, the cytotoxicity test shows that the cell viability still keeps 100% even if the concentration of the NBDs reaches 800 μg/ml, indicating the good biocompatibility of the NBDs. In addition, the fluorescence of the NBDs is very sensitive to Fe3+, which can be used for Fe3+ detection in terms of their health superiority. The limit of detection (LOD) of the proposed sensor was determined as 2.9 μM, which is lower than the maximum allowable level of Fe3+ (5.37 μM) in drinking water.
Keywords: Fe3+ detection; Fluorescence; Nano-biomass dots; Nanoprobe; Ultrasonic methods.
Conflict of interest statement
Competing Interests
The authors declare that they have no competing interests.
Publisher’s Note
Springer Nature remains neutral with regard to jurisdictional claims in published maps and institutional affiliations.
Figures

References
-
- Guyotsionnest P, Roberts JA. Background limited midinfrared photodetection with photovoltaic hgte colloidal quantum dots. Appl Phys Lett. 2015;107:253104. doi: 10.1063/1.4938135. - DOI
Grants and funding
- 21601159/National Natural Science Foundation of China
- 61604132/National Natural Science Foundation of China
- 61505033/National Natural Science Foundation of China
- 11374296/National Natural Science Foundation of China
- National Science Fund for Distinguished Young Scholars/National Science Fund for Distinguished Young Scholars
LinkOut - more resources
Full Text Sources
Other Literature Sources
