. 2019 Sep;106(3):668-680.
doi: 10.1002/cpt.1463. Epub 2019 May 14.

Enantiospecific Pharmacogenomics of Fluvastatin

Affiliations

Enantiospecific Pharmacogenomics of Fluvastatin

Päivi Hirvensalo et al. Clin Pharmacol Ther. 2019 Sep.

Abstract

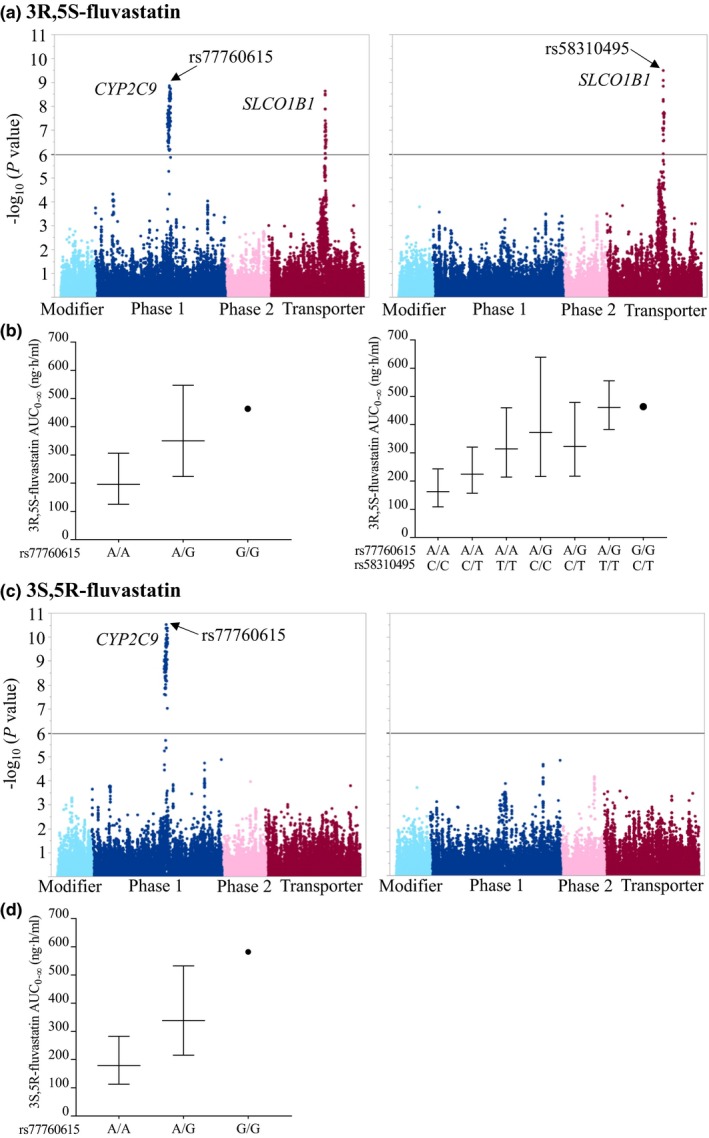
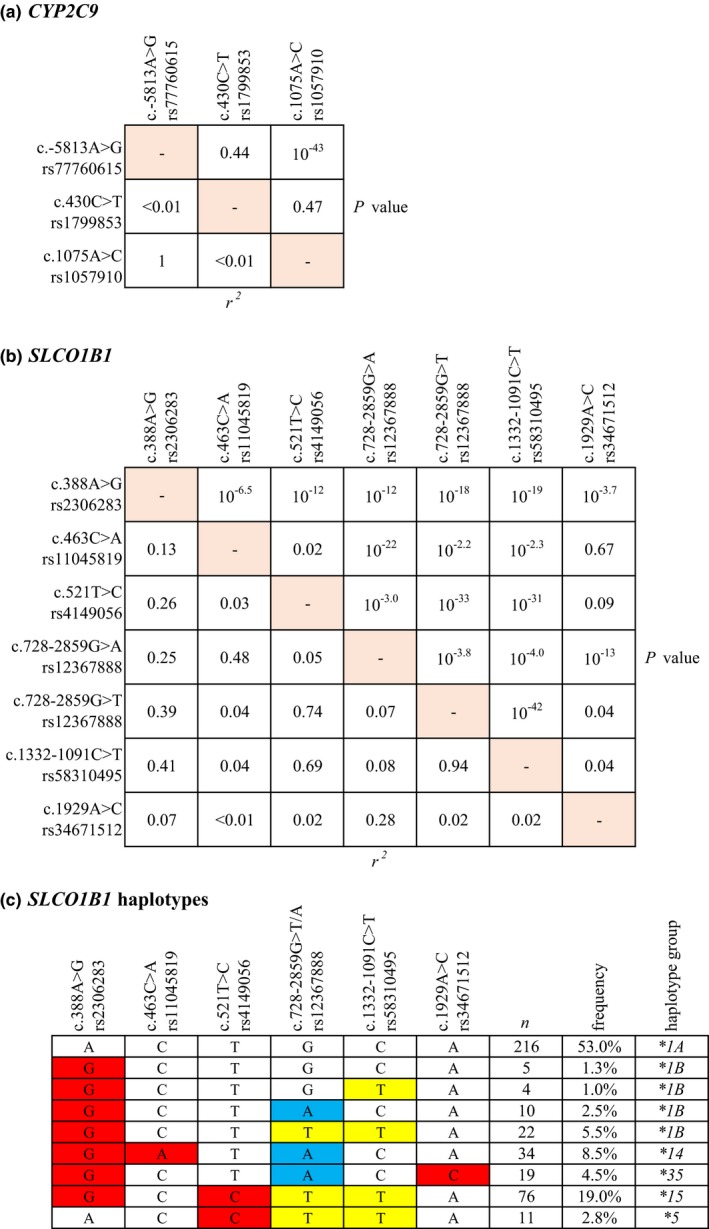
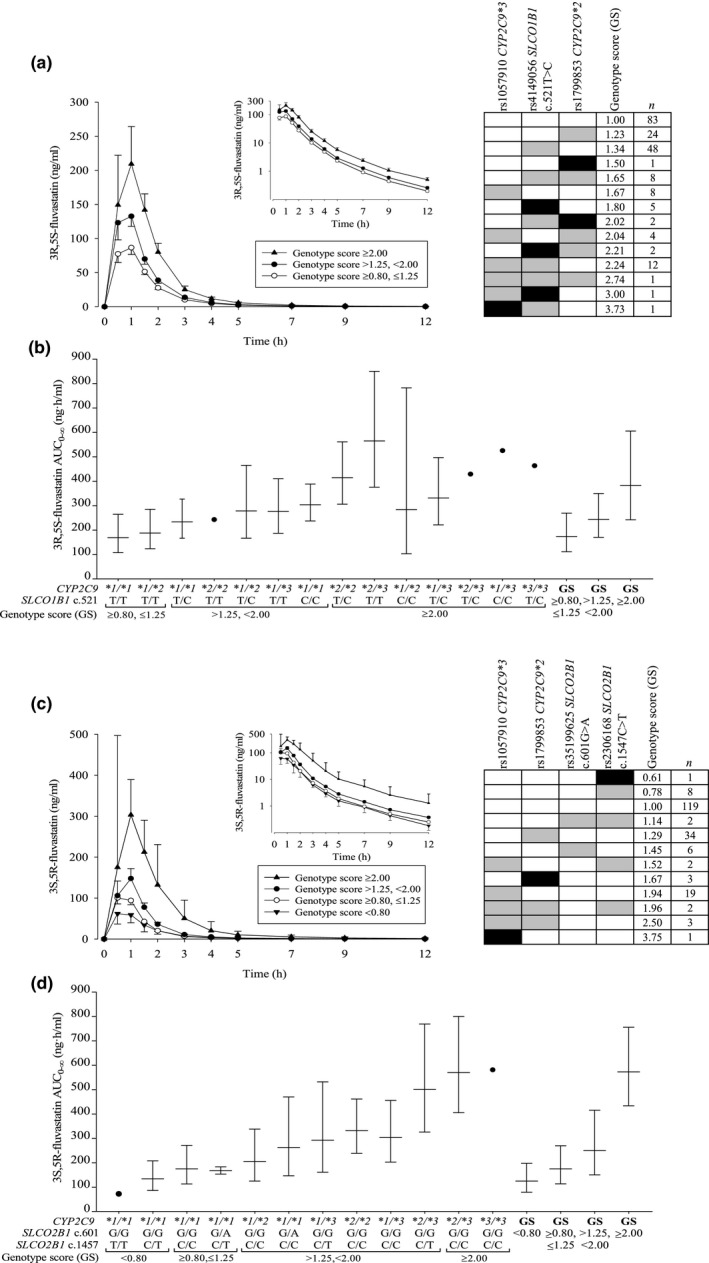
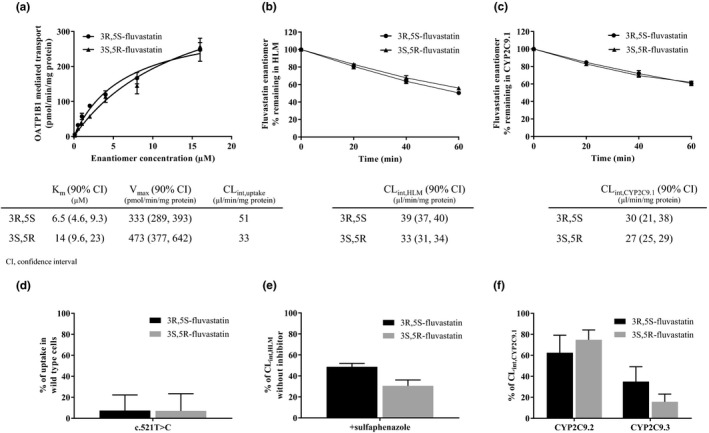
The aim of this study was to investigate how variability in multiple genes related to pharmacokinetics affects fluvastatin exposure. We determined fluvastatin enantiomer pharmacokinetics and sequenced 379 pharmacokinetic genes in 200 healthy volunteers. CYP2C9*3 associated with significantly increased area under the plasma concentration-time curve (AUC) of both 3R,5S-fluvastatin and 3S,5R-fluvastatin (by 67% and 94% per variant allele copy, P = 3.77 × 10⁻⁹ and P = 3.19 × 10⁻¹² ). In contrast, SLCO1B1 c.521T>C associated with increased AUC of active 3R,5S-fluvastatin only (by 34% per variant allele copy; P = 8.15 × 10⁻⁸ ). A candidate gene analysis suggested that CYP2C9*2 also affects the AUC of both fluvastatin enantiomers and that SLCO2B1 single-nucleotide variations may affect the AUC of 3S,5R-fluvastatin. Thus, SLCO transporters have enantiospecific effects on fluvastatin pharmacokinetics in humans. Genotyping of both CYP2C9 and SLCO1B1 may be useful in predicting fluvastatin efficacy and myotoxicity.


Conflict of interest statement

The authors declared no competing interests for this work.

Figures

Figure 1
Figure 1
The associations of 46,064 SNVs in 379 pharmacokinetic genes with 3R,5S‐fluvastatin (a) and 3S,5R‐fluvastatin (c) AUC 0–∞, adjusting for BSA (left panel), and BSA and the CYP2C9 rs77760615 SNV (right panel). The y‐axes in (a) and (c) describe the negative logarithm of the P value for each SNV, and the horizontal lines indicate the Bonferroni‐corrected significance level of 1.09 × 10−6. The x‐axes show individual SNVs grouped by protein function. The geometric mean ± geometric standard deviation BSA‐adjusted AUC 0–∞ values grouped by the top associated SNVs are illustrated in (b) and (d). AUC0–∞, area under the plasma concentration‐time curve from 0 hour to infinity; BSA, body surface area; SNV, single‐nucleotide variation. [Colour figure can be viewed at wileyonlinelibrary.com]
Figure 2
Figure 2
Linkage disequilibrium of (a) CYP2C9 and (b) SLCO1B1 missense and top noncoding SNVs. (c) SLCO1B1 haplotypes (MAF ≥0.01) inferred with missense and top noncoding SLCO1B1 SNVs. Intronic nucleotide changes are depicted in yellow and blue, and missense variations in red. MAF, minor allele frequency; SNV, single‐nucleotide variation. [Colour figure can be viewed at wileyonlinelibrary.com]
Figure 3
Figure 3
Geometric mean (90% CI) BSA‐adjusted plasma concentrations of (a) 3R,5S‐fluvastatin and (c) 3S,5R‐ fluvastatin after a single 40 mg oral dose of racemic fluvastatin in 200 healthy volunteers with different combinations of CYP2C9 and SLCO1B1 or SLCO2B1 genotypes. The insets depict the same data on a semilogarithmic scale. The volunteers were grouped by genotype scores predicting the fold differences in AUC 0–∞ values between carriers of different genotype combinations and non‐carriers. The right panels in (a) and (c) show the genotype scores for individuals with different genotypes. Reference genotypes are depicted with white, heterozygous with gray, and homozygous variant genotypes with black rectangles. The geometric mean ± geometric standard deviation BSA‐adjusted AUC 0–∞ values grouped by combinations of CYP2C9 and SLCO1B1 or SLCO2B1 genotypes, as well as the genotype scores are illustrated in (b) and (d). AUC0–∞, area under the plasma concentration‐time curve from 0 hour to infinity; BSA, body surface area; CI, confidence interval.
Figure 4
Figure 4
Fluvastatin enantiomer transport by reference OATP1B1 (a), metabolism in HLM (b), and metabolism by reference CYP2C9.1 (c); effects of SLCO1B1 c.521T>C on their transport (d), and sulfaphenazole (e) and CYP2C9.2 and CYP2C9.3 (f) on their metabolism in vitro. Fluvastatin enantiomer concentrations were 0.1–16 μM (a), 0.1 μM (b, c, e, f), and 0.5 μM (d). Sulfaphenazole concentration was 10 μM (e). CLint, intrinsic clearance; HLM, human liver microsomes; Km, Michaelis–Menten constant; Vmax, maximum transport rate.

References

    1. Kathawala, F.G. HMG‐CoA reductase inhibitors: an exciting development in the treatment of hyperlipoproteinemia. Med. Res. Rev. 11, 121–146 (1991). - PubMed
    1. Fischer, V. et al The 3‐hydroxy‐3‐methylglutaryl coenzyme A reductase inhibitor fluvastatin: effect on human cytochrome P‐450 and implications for metabolic drug interactions. Drug Metab. Dispos. 27, 410–416 (1999). - PubMed
    1. Neuvonen, P.J. , Niemi, M. & Backman, J.T. Drug interactions with lipid‐lowering drugs: mechanisms and clinical relevance. Clin. Pharmacol. Ther. 80, 565–581 (2006). - PubMed
    1. Kopplow, K. , Letschert, K. , König, J. , Walter, B. & Keppler, D. Human hepatobiliary transport of organic anions analyzed by quadruple‐transfected cells. Mol. Pharmacol. 68, 1031–1038 (2005). - PubMed
    1. Hirano, M. , Maeda, K. , Matsushima, S. , Nozaki, Y. , Kusuhara, H. & Sugiyama, Y. Involvement of BCRP (ABCG2) in the biliary excretion of pitavastatin. Mol. Pharmacol. 68, 800–807 (2005). - PubMed

Publication types

MeSH terms

Substances