. 2019 Aug;18(4):e12958.
doi: 10.1111/acel.12958. Epub 2019 Apr 15.

Phenotypical and functional heterogeneity of neural stem cells in the aged hippocampus

Affiliations

Phenotypical and functional heterogeneity of neural stem cells in the aged hippocampus

Soraya Martín-Suárez et al. Aging Cell. 2019 Aug.

Abstract

Adult neurogenesis persists in the hippocampus of most mammal species during postnatal and adult life, including humans, although it declines markedly with age. The mechanisms driving the age-dependent decline of hippocampal neurogenesis are yet not fully understood. The progressive loss of neural stem cells (NSCs) is a main factor, but the true neurogenic output depends initially on the actual number of activated NSCs in each given time point. Because the fraction of activated NSCs remains constant relative to the total population, the real number of activated NSCs declines in parallel to the total NSC pool. We investigated aging-associated changes in NSCs and found that there are at least two distinct populations of NSCs. An alpha type, which maintains the classic type-1 radial morphology and accounts for most of the overall NSC mitotic activity; and an omega type characterized by increased reactive-like morphological complexity and much lower probability of division even under a pro-activation challenge. Finally, our results suggest that alpha-type NSCs are able to transform into omega-type cells overtime and that this phenotypic and functional change might be facilitated by the chronic inflammation associated with aging.

Keywords: adult neurogenesis; aging; hippocampus; neural stem cells.


Conflict of interest statement

None declared.

Figures

Figure 1
Figure 1
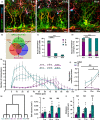
Neural stem cells (NSCs) drastically change their morphological properties with aging. (a) Confocal microscopy images showing the differences between NSCs in 3‐month‐old (3 m, left image) and 12‐month‐old (12 m, right image). Nestin‐GFP mice after staining for GFP (green) and GFAP (red). (b) Z‐stack projections of Nestin‐GFP+/GFAP+ cells prepared for 3D‐Sholl analysis. Color indicates distance from the center from closest (dark blue) to furthest (dark red). (c) Age‐associated differences in the complexity of NSCs (Nestin‐GFP+/GFAP+ cells). (d) Quantification of the length (center of soma to furthest tip of NSCs). (e) Quantification of the NSC volume. (f) Quantification of the number of NSC primary processes (those emerging from the soma). (g) Number of NSC secondary processes, defined as those branching from the primary process. (h) Quantification of the distance between the center of cell body and the SGZ. Scale bar is 10 μm in (a). *p < 0.05, **p < 0.01, ***p < 0.001 one‐way ANOVA after all pairwise multiple comparisons by Holm‐Sidak post hoc test (d‐h). 3 versus 12 m, + p < 0.05, ++ p < 0.01; 3 versus 18 m, *p < 0.05, **p < 0.01, ***p < 0.001; 12 versus 18 m, p < 0.05, repeated measures ANOVA followed by Bonferroni post hoc test in c. Bars show mean ± SEM. Dots show individual data
Figure 2
Figure 2
At least two populations of Nestin‐GFP+/GFAP+ cells are found in aged DG. (a) Confocal microscopy images (projection from z‐stacks) showing the increase in the complexity of neural stem cells (NSCs) over aging (3‐, 12‐, and 18‐month‐old mice). (b) Scheme showing the differential pattern of marker expression of cell types in the DG. (c) Quantification of the total number of the different NSC‐like populations (α, β, and Ω) in 3‐, 12‐, and 18‐month‐old mice. (d) Quantification of the different NSC‐like populations (α, β, and Ω) in percentage showing the significant decrease of α‐cells and the concomitant increase in the proportion of Ω‐cells. The β‐cell subpopulation remains relatively constant. (e) Quantification of the α‐ and Ω‐cell complexity by 3D‐Sholl analysis in each time point (see table for statistical analysis). (f) Quantification of the complexity index (K‐index) showing a significant increase of the complexity in Ω‐cells and in the total population of NSCs with age. (g) Ward's hierarchical clustering based on 3D‐Sholl analysis to independently classify α and Ω cells in each age point. (h) Quantification of the cell volume by cell type and age point. (i) Quantification of the distance of the cell body to the SGZ. Scale bar is 20 μm in (a). (e) *p < 0.05, **p < 0.01, ***p < 0.001 repeated measures ANOVA followed by Bonferroni post hoc test. (c, d and f) one‐way ANOVA after all pairwise multiple comparisons by Holm‐Sidak post hoc test. (h–i) *p < 0.05, **p < 0.01, ***p < 0.001 by Student's t test. Bars show mean ± SEM. Dots show individual data
Figure 3
Figure 3
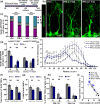
Ω‐cells divide with lower probability. (a) Representative confocal microscopy images of dividing Nestin‐GFP+/GFAP+ α‐NSC after staining for GFP, BrdU, and GFAP at 3 and 18 months old. (b) Quantification of the cell division (incorporation of BrdU) in the different subpopulations of neural stem cells (NSCs). (c) Quantification of the proportion of dividing α and Ω‐cells, among the total α and Ω‐cell population, at each age point. (d) Quantification of the re‐entry into the cell cycle of NSCs (Ki67‐ and BrdU‐positive NSCs). (e) Confocal microscopy image (projection from z‐stacks) staining for GFP, BrdU, and Ki67. Scale bar is 10 μm in (a and g). ***p < 0.001 one‐way ANOVA after all pairwise multiple comparisons by Holm‐Sidak post hoc test. Bars show mean ± SEM. Dots show individual data
Figure 4
Figure 4
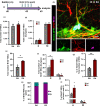
Ω‐cells are more quiescent even in pro‐activation conditions. (a) Experimental paradigm of Sal/KA and BrdU administration to 12‐month‐old animals. (b) Confocal microscopy projections of z‐stacks showing a dividing α‐NSC after immunostaining for GFP, GFAP, and BrdU. (c) Quantification of the total number of neural stem cells (NSCs). (d) Quantification of the total number of NSCs by subpopulations. (e) Quantification of total dividing NSCs. (f) Quantification of the total number of dividing NSCs by subtypes. (g) Quantification of the proportion of total dividing NSCs. (h) Quantification of the proportion of the dividing NSCs by subpopulations. (i) Quantification of the proliferative capacity of α and Ω‐NSCs of the total α and Ω‐NSC populations. Scale bar is 10 μm in B. *p < 0.05, **p < 0.01, ***p < 0.001, *p < 0.05, and ***p < 0.001 by Student's t test. Bars show mean ± SEM. Dots show individual data
Figure 5
Figure 5
Chronic inflammation converts α‐cells into Ω. (a) Experimental paradigm of Sal/IFN‐α and BrdU administration. (b) Confocal microscopy projections of neural stem cells (NSCs) after immunostaining for GFAP and GFP. (c) Quantification of the different subtypes of NSCs. (d) Quantification of the changes in NSC complexity. (e) Quantification of the total number of α and Ω cells. (f) Quantification of the dividing NSCs. (g) Quantification of the proportion of dividing NSCs. (h) Quantification of the dividing NSCs by subtypes. Straight line fitting of the data showing that Ω cells significantly and negatively correlated with the number of α cells. Scale bar is 10 μm in (b). (e) *p < 0.05, **p < 0.01, ***p < 0.001 for comparisons at 1 day after treatment; + p < 0.05, ++ p < 0.01, +++ p < 0.001 for comparisons at 1 month after treatment. Repeated measures ANOVA followed by Bonferroni post hoc test. (c, d, and f–i) *p < 0.05, **p < 0.01, ***p < 0.001, *p < 0.05, and ***p < 0.001 by Student's t test. Bars show mean ± SEM. Dots show individual data
Figure 6
Figure 6
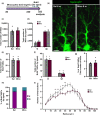
Chronic anti‐inflammatory treatment does not revert the conversion of α‐ into Ω‐cells. (a) Experimental paradigm of minocycline (30 days) and BrdU administration (one day before sacrifice) to 8‐month‐old animals. (b) Confocal microscopy projections of Nestin‐GFP‐labeled neural stem cells (NSCs). (c) Quantification of the total number of NSCs. (d) Quantification of the total number of NSCs by subpopulations. (e) Quantification of total dividing NSCs. (f) Quantification of the total number of dividing NSCs by subtypes. (g) Quantification of the proportion of total dividing NSCs. (h) Quantification of the proportion of the dividing NSCs by subpopulations. (d) Quantification of the changes in NSC morphological complexity. This is the only parameter in which administration of minocycline has an effect. Scale bar is 10 μm in b. *p < 0.05, **p < 0.01. Repeated measures ANOVA followed by Bonferroni post hoc test in (i). Student's t test in (e–h). Bars show mean ± SEM. Dots show individual data. n = 5 in control and n = 4 in minocycline

References

    1. Andersen, J. , Urbán, N. , Achimastou, A. , Ito, A. , Simic, M. , Ullom, K. , … Guillemot, F. (2014). A transcriptional mechanism integrating inputs from extracellular signals to activate hippocampal stem cells. Neuron, 83(5), 1085–1097. 10.1016/j.neuron.2014.08.004 - DOI - PMC - PubMed
    1. Ben Abdallah, N.‐M.‐B. , Slomianka, L. , Vyssotski, A. L. , & Lipp, H.‐P. (2010). Early age‐related changes in adult hippocampal neurogenesis in C57 mice. Neurobiology of Aging, 31(1), 151–161. 10.1016/j.neurobiolaging.2008.03.002 - DOI - PubMed
    1. Bergami, M. , Rimondini, R. , Santi, S. , Blum, R. , Götz, M. , & Canossa, M. (2008). Deletion of TrkB in adult progenitors alters newborn neuron integration into hippocampal circuits and increases anxiety‐like behavior. Proceedings of the National Academy of Sciences of the USA, 105(40), 15570–15575. 10.1073/pnas.0803702105 - DOI - PMC - PubMed
    1. Boldrini, M. , Fulmore, C. A. , Tartt, A. N. , Simeon, L. R. , Pavlova, I. , Poposka, V. , … Mann, J. J. (2018). Human hippocampal neurogenesis persists throughout aging. Cell Stem Cell, 22(4), 589–599.e5. 10.1016/j.stem.2018.03.015 - DOI - PMC - PubMed
    1. Bonaguidi, M. A. , Wheeler, M. A. , Shapiro, J. S. , Stadel, R. P. , Sun, G. J. , Ming, G. , & Song, H. (2011). In vivo clonal analysis reveals self‐renewing and multipotent adult neural stem cell characteristics. Cell, 145(7), 1142–1155. 10.1016/j.cell.2011.05.024 - DOI - PMC - PubMed

Publication types

LinkOut - more resources