Discovery and validation of a prognostic proteomic signature for tuberculosis progression: A prospective cohort study
- PMID: 30990820
- PMCID: PMC6467365
- DOI: 10.1371/journal.pmed.1002781
Discovery and validation of a prognostic proteomic signature for tuberculosis progression: A prospective cohort study
Erratum in
-
Correction: Discovery and validation of a prognostic proteomic signature for tuberculosis progression: A prospective cohort study.PLoS Med. 2019 Jul 18;16(7):e1002880. doi: 10.1371/journal.pmed.1002880. eCollection 2019 Jul. PLoS Med. 2019. PMID: 31318860 Free PMC article.
Abstract
Background: A nonsputum blood test capable of predicting progression of healthy individuals to active tuberculosis (TB) before clinical symptoms manifest would allow targeted treatment to curb transmission. We aimed to develop a proteomic biomarker of risk of TB progression for ultimate translation into a point-of-care diagnostic.
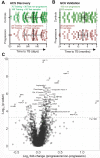
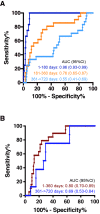
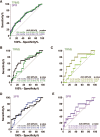
Methods and findings: Proteomic TB risk signatures were discovered in a longitudinal cohort of 6,363 Mycobacterium tuberculosis-infected, HIV-negative South African adolescents aged 12-18 years (68% female) who participated in the Adolescent Cohort Study (ACS) between July 6, 2005 and April 23, 2007, through either active (every 6 months) or passive follow-up over 2 years. Forty-six individuals developed microbiologically confirmed TB disease within 2 years of follow-up and were selected as progressors; 106 nonprogressors, who remained healthy, were matched to progressors. Over 3,000 human proteins were quantified in plasma with a highly multiplexed proteomic assay (SOMAscan). Three hundred sixty-one proteins of differential abundance between progressors and nonprogressors were identified. A 5-protein signature, TB Risk Model 5 (TRM5), was discovered in the ACS training set and verified by blind prediction in the ACS test set. Poor performance on samples 13-24 months before TB diagnosis motivated discovery of a second 3-protein signature, 3-protein pair-ratio (3PR) developed using an orthogonal strategy on the full ACS subcohort. Prognostic performance of both signatures was validated in an independent cohort of 1,948 HIV-negative household TB contacts from The Gambia (aged 15-60 years, 66% female), longitudinally followed up for 2 years between March 5, 2007 and October 21, 2010, sampled at baseline, month 6, and month 18. Amongst these contacts, 34 individuals progressed to microbiologically confirmed TB disease and were included as progressors, and 115 nonprogressors were included as controls. Prognostic performance of the TRM5 signature in the ACS training set was excellent within 6 months of TB diagnosis (area under the receiver operating characteristic curve [AUC] 0.96 [95% confidence interval, 0.93-0.99]) and 6-12 months (AUC 0.76 [0.65-0.87]) before TB diagnosis. TRM5 validated with an AUC of 0.66 (0.56-0.75) within 1 year of TB diagnosis in the Gambian validation cohort. The 3PR signature yielded an AUC of 0.89 (0.84-0.95) within 6 months of TB diagnosis and 0.72 (0.64-0.81) 7-12 months before TB diagnosis in the entire South African discovery cohort and validated with an AUC of 0.65 (0.55-0.75) within 1 year of TB diagnosis in the Gambian validation cohort. Signature validation may have been limited by a systematic shift in signal magnitudes generated by differences between the validation assay when compared to the discovery assay. Further validation, especially in cohorts from non-African countries, is necessary to determine how generalizable signature performance is.
Conclusions: Both proteomic TB risk signatures predicted progression to incident TB within a year of diagnosis. To our knowledge, these are the first validated prognostic proteomic signatures. Neither meet the minimum criteria as defined in the WHO Target Product Profile for a progression test. More work is required to develop such a test for practical identification of individuals for investigation of incipient, subclinical, or active TB disease for appropriate treatment and care.
Conflict of interest statement
I have read the journal's policy and the authors of this manuscript have the following competing interests: TH, DS, NJ, MAD, DS, and UO are employees and shareholders of SomaLogic. KW is a shareholder in SomaLogic. APN, TH, ET, NJ, UO, DZ, and TJS are co-inventors on patents of the proteomic signatures. MH served as Guest Editor on PLOS Medicine’s Special Issue on New Tools and Strategies for Tuberculosis Diagnosis, Care, and Elimination.
Figures


References
-
- World Health Organization. GLOBAL TUBERCULOSIS REPORT 2018. 2018;: 1–243.
-
- World Health Organization. Global tuberculosis report 2015. 2015.
Publication types
MeSH terms
Substances
Grants and funding
LinkOut - more resources
Full Text Sources
Other Literature Sources
Medical
Miscellaneous

