

Published Erratum
doi: 10.1371/journal.pone.0215630.
eCollection 2019.
Correction: HIV Viremia and T-cell Activation Differentially Affect the Performance of Glomerular Filtration Rate Equations Based on Creatinine and Cystatin C
- PMID: 30990858
- PMCID: PMC6467568
- DOI: 10.1371/journal.pone.0215630
Item in Clipboard
Published Erratum
Correction: HIV Viremia and T-cell Activation Differentially Affect the Performance of Glomerular Filtration Rate Equations Based on Creatinine and Cystatin C
PLoS One.
.
Abstract
[This corrects the article DOI: 10.1371/journal.pone.0082028.].
Figures
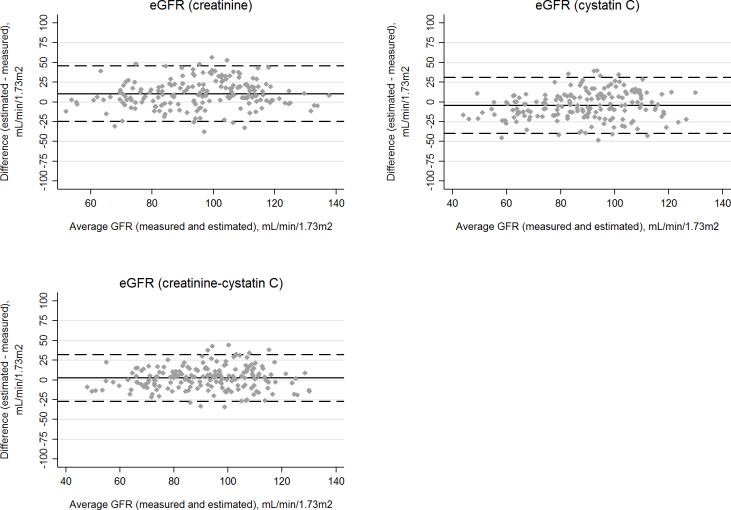
Bland-Altman plots for estimated and measured glomerular filtration rate (GFR) in HIV-positive participants using the CKD-EPI equations for serum creatinine (A), cystatin C (B), or both biomarkers (C). The average GFR (measured and estimated) is shown on the X axes. Bias, defined as the difference between estimated and measured GFR, is displayed on the Y axes. The average biases are represented by the horizontal solid lines and the horizontal dashed lines represent 2 standard deviations above and below the averages.
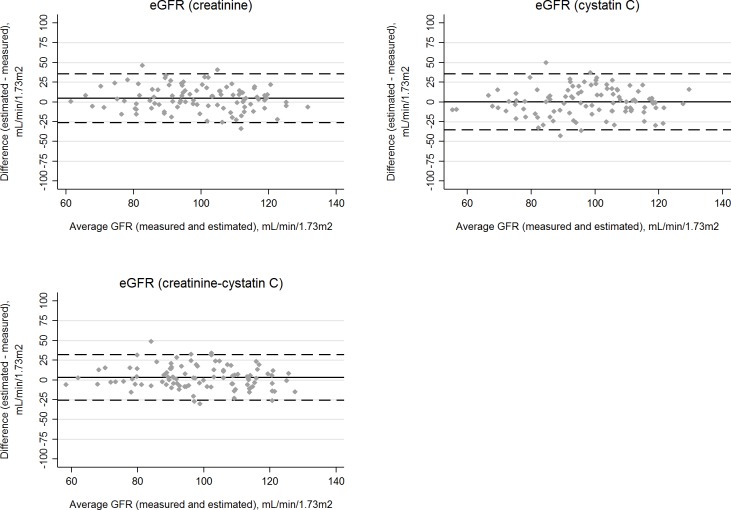
Bland-Altman plots for estimated and measured glomerular filtration rate (GFR) in HIV-negative participants using the CKD-EPI equations for serum creatinine (A), cystatin C (B), or both biomarkers (C). The average GFR (measured and estimated) is shown on the X axes. Bias, defined as the difference between estimated and measured GFR, is displayed on the Y axes. The average biases are represented by the horizontal solid lines and the horizontal dashed lines represent 2 standard deviations above and below the averages.
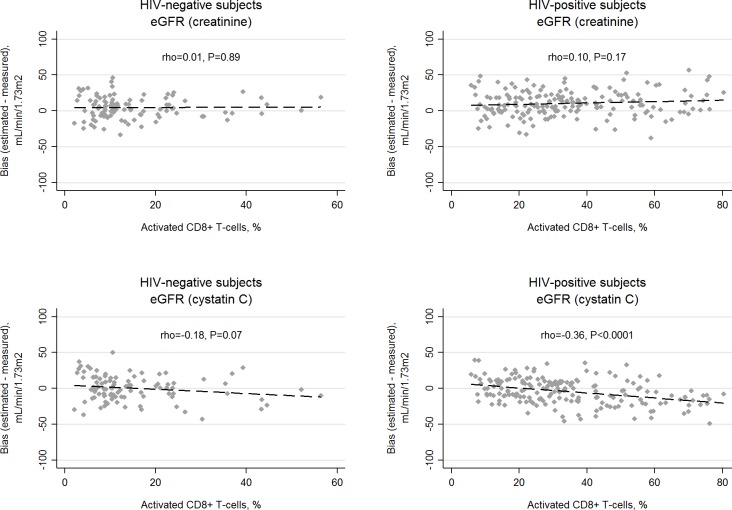
Correlation of estimated glomerular filtration rate (eGFR) bias, defined as the difference between eGFR and measured GFR, with percentage of activated CD8 T cells (CD38+ and HLA-DR+) using the creatine-based CKD-EPI equation in HIV-negative (A) and HIV-positive (B) subjects, and the cystatin C-based CKD-EPI equation in HIV negative (C) and HIV-positive (D) subjects. The percentage of CD8+ T cells with an activated phenotype is shown on the X axes (note, different scales for HIV-positive and HIV-negative groups). Rho is the spearman rank correlation coefficient, which may vary between -1 and 1. The dashed lines represent least-squares regression lines.
Erratum for
-
HIV viremia and T-cell activation differentially affect the performance of glomerular filtration rate equations based on creatinine and cystatin C.PLoS One. 2013 Dec 23;8(12):e82028. doi: 10.1371/journal.pone.0082028. eCollection 2013. PLoS One. 2013. PMID: 24376511 Free PMC article.
References
Publication types
LinkOut - more resources
Full Text Sources
Molecular Biology Databases
