. 2019 May 1;78(5):436-452.
doi: 10.1093/jnen/nlz023.

Peri-Infarct Upregulation of the Oxytocin Receptor in Vascular Dementia

Affiliations

Peri-Infarct Upregulation of the Oxytocin Receptor in Vascular Dementia

Erin C McKay et al. J Neuropathol Exp Neurol. .

Abstract

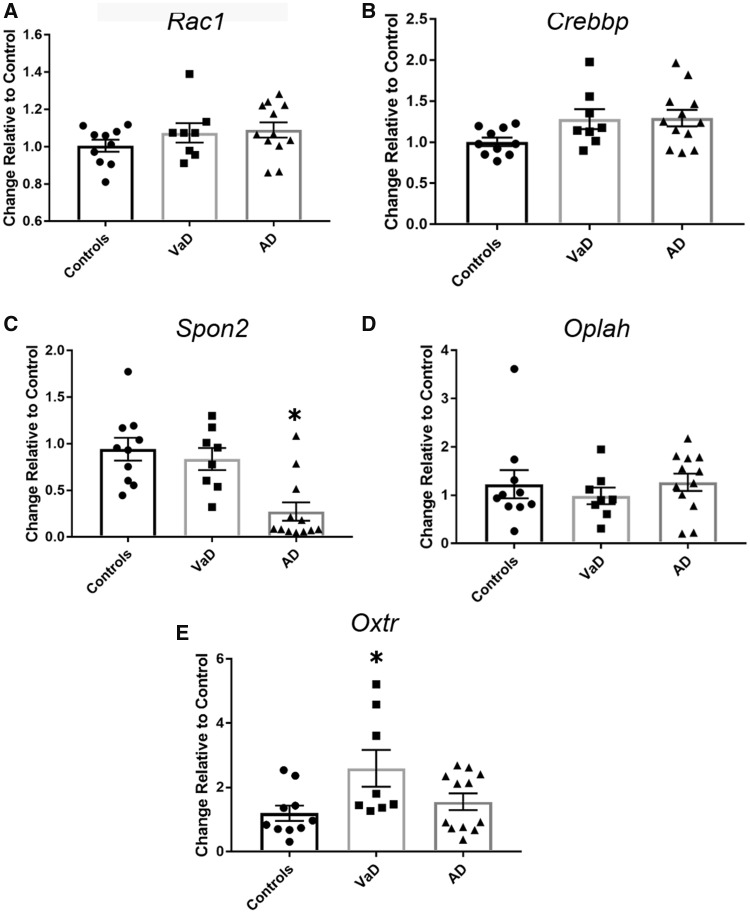
Vascular dementia (VaD) is cognitive decline linked to reduced cerebral blood perfusion, yet there are few therapeutic options to protect cognitive function following cerebrovascular accidents. The purpose of this study was to profile gene expression changes unique to VaD to identify and characterize disease relevant changes that could offer clues for future therapeutic direction. Microarray-based profiling and validation studies of postmortem frontal cortex samples from VaD, Alzheimer disease, and age-matched control subjects revealed that the oxytocin receptor (OXTR) was strongly and differentially upregulated in VaD. Further characterization in fixed tissue from the same cases showed that OXTR upregulation occurs de novo around and within microinfarcts in peri-infarct reactive astrocytes as well as within vascular profiles, likely on microvascular endothelial cells. These results indicate that increased OXTR expression in peri-infarct regions may be a specific response to microvascular insults. Given the established OXTR signaling cascades that elicit antioxidant, anti-inflammatory, and pro-angiogenic responses, the present findings suggest that de novo OXTR expression in the peri-infarct space is a tissue-protective response by astroglial and vascular cells in the wake of ischemic damage that could be exploited as a therapeutic option for the preservation of cognition following cerebrovascular insults.

Keywords: Alzheimer disease; Astrocvytes; Microinfarcts; Microvascular endothelial cells; Oxytocin receptor; Vascular dementia.


Figures

FIGURE 1.
FIGURE 1.
Venn diagram representing common and disease-specific genes in CTL, VaD, and AD subjects. Comparisons are based on significantly differentially expressed genes (FDR-adjusted p < 0.05) in frontal cortex from the 3 clinical diagnostic groups.
FIGURE 2.
FIGURE 2.
Pathway analysis of dysregulated genes in VaD compared with AD frontal cortex. Horizontal bar graph shows that gene expression alterations in AD were heavily enriched for synaptic function, cytoskeletal remodeling, and glutamatergic signaling compared with controls. In contrast, VaD displayed an enrichment of genes dysregulated in oxidative phosphorylation and clathrin-coated transport compared with controls. Pathways most strongly differentiating AD and VaD were associated with cell adhesion and RhoA-mediated G protein-coupled signaling. Red hashed line: p < 0.05 (FDR-adjusted).
FIGURE 3.
FIGURE 3.
Network analysis of VaD-specific gene dysregulation. Two major interaction hubs were identified centering on Rac1 and Crebbp (Table 2). Rac1 was significantly downregulated in VaD compared with AD and controls (log fold change = –0.4, FDR adjusted p < 0.01). Likewise, several genes encoding RAC1 inhibitors (e.g. Ralbp1) were upregulated whereas genes encoding RAC1 activators (e.g. Plekhg4) were downregulated in VaD. In contrast, Crebbp gene expression was significantly upregulated in VaD samples (log fold change = 0.4, FDR-adjusted p < 0.02). Crebbp is a modulatory hub for several upregulated genes encoding core histones (e.g. Hist1h2bm, Hist1h4b) and regulators of chromatin remodeling (e.g. Satb1). Notably, Oxtr was among the most strongly upregulated genes within the VaD network (log fold change = 1.86, FDR-adjusted p < 0.04). Light to dark blue = increased downregulation in VaD relative to controls and AD; light to dark red = increased upregulation in VaD relative to controls and AD.
FIGURE 4.
FIGURE 4.
qPCR validation of selected genes dysregulated via microarray analysis. (A) qPCR analysis of Crebbp mRNA in the same tissue blocks of frontal cortex examined by microarrays revealed a nonsignificant trend of upregulation in VaD and AD samples compared with control levels (one-way ANOVA [F = 2.99, p =0.06]). (B)Rac1 levels did not differ between the 3 diagnostic groups (F = 1.22, p =0.31). (C)Spon2 was significantly downregulated in AD compared with control samples (F = 11.18, p =0.0003). (D)Oplah mRNA levels were unchanged among the 3 diagnostic groups (F = 0.4850, p =0.6209). (E)Oxtr mRNA levels were significantly upregulated in the VaD samples (F = 3.886, p =0.03). *p < 0.05.
FIGURE 5.
FIGURE 5.
Western blot confirmation of OXTR protein upregulation in VaD frontal cortex. Membrane fractions of the same tissue blocks of frontal cortex were used to detect protein levels of OXTR. (A) Representative western blot showing OXTR and calnexin immunoreactivity in CTL, VaD, and AD cases. (B) Quantitative analysis revealed that protein levels were significantly different among the 3 diagnostic groups (Kruskal-Wallis test [H = 7.426, p = 0.03]). OXTR levels in VaD were significantly different than CTL (Dunn's multiple comparison test [mean rank = −10.63, multiplicity-adjusted p = 0.033]), with intermediate but nonsignificant levels detected in AD. *p < 0.05. Samples were run as technical replicates with means used for statistical analysis.
FIGURE 6.
FIGURE 6.
OXTR expression in cerebrovascular endothelial cells. (A, B) OXTR immunoreactivity is enriched in vascular profiles in human frontal cortex tissue (left). Deletion of primary OXTR antibody supports antigen specificity (right). Images shown at 20× (A) and at 40× (B). (C) Fluorescence immunocytochemical detection of OXTR with DAPI counterstain in cultures of human brain derived endothelial cells, shown with (left) and without (right) primary antibody.
FIGURE 7.
FIGURE 7.
De novo peri-infarct expression of OXTR. (A, B) H&E staining identifies both white (A) and grey (B) matter infarcts in paraffin embedded frontal cortex tissue from VaD cases. Shown at 4× magnification. (C, D) OXTR IHC in adjacent sections revealed prominent expressions surrounding the white (C) and grey (D) matter microinfarcts. Shown at 4× (top) and 10× (bottom) magnification. The OXTR-immunoreactive profiles showed an astroglial typical morphology.
FIGURE 8.
FIGURE 8.
Peri-infarct astroglial and vascular expression of OXTR. (A, B) Photomicrographs show white matter microinfarction via H&E staining at 4× (A) and 10× (B, panel A inset). (C, D) Photomicrographs show dual-label IHC of OXTR (brown reaction product) and GFAP (black reaction product) at 4× (C) and 10× (D, panel C inset) in an adjacent section.
FIGURE 9.
FIGURE 9.
Gradient of OXTR expression in astrocytes and blood vessels relative to microinfarction site. (A) Photomicrograph shows dual-label IHC of OXTR and GFAP from Figure 8 with numbered insets as shown in (B). (B) OXTR expression is enriched in GFAP-immunopositive profiles in a field close to the microinfarction [3] and in the left part of fields [1] and [4] proximal to the lesion. In contrast, OXTR is minimal in GFAP-immunopositive profiles in a field farther from the microinfarction [2] and in the right part of fields [1] and [4] distal to the lesion. All fields shown at 20×. (C) OXTR-expressing astrocytes are indicated with black arrows, whereas vessels labeled with OXTR are indicated with black arrowheads and OXTR-negative astrocytes are labeled with asterisks. All fields shown at 40×. (D) Another field from the same section further demonstrates dual-labeled GFAP positive astrocytes and vessels expressing OXTR (40×).
FIGURE 10.
FIGURE 10.
RNAscope detection of GFAP mRNA in profiles expressing OXTR. (A) Photomicrograph shows OXTR IHC (blue-black reaction product) combined with GFAP mRNA amplification via RNAscope (brown reaction product) in a peri-infarct field (20×). Insets 1 and 2 are shown at 40× magnification. (B) GFAP mRNA labeling in the absence of OXTR primary antibody validates specificity of co-expression at 20× (left) and 40× (right, insert).

References

    1. World Health Organization. Towards a Dementia Plan: A WHO Guide [Internet]. Dementia: A Public Health Priority – World Health Organization; 2017
    1. Wimo A, Jönsson L, Bond J, et al. The worldwide economic impact of dementia 2010. Alzheimer’s Dement 2013;9:1–11 - PubMed
    1. Livingston G, Barber J, Rapaport P.. Clinical effectiveness of a manual based coping strategy programme (START, STrAtegies for RelaTives) in promoting the mental health of carers of family members with dementia: Pragmatic randomised controlled trial. BMJ 2013;347:f6276. - PMC - PubMed
    1. Jorm AF, Jolley D.. The incidence of dementia: A meta-analysis. Neurology 1998;51:728–33 - PubMed
    1. Corrada MM, Brookmeyer R, Paganini-Hill A, et al. Dementia incidence continues to increase with age in the oldest old the 90+ study. Ann Neurol 2010;67:114–21 - PMC - PubMed

Publication types

Substances