. 2019 Apr 15;35(4):677-691.e10.
doi: 10.1016/j.ccell.2019.03.006.

Small-Molecule Targeting of Oncogenic FTO Demethylase in Acute Myeloid Leukemia

Affiliations

Small-Molecule Targeting of Oncogenic FTO Demethylase in Acute Myeloid Leukemia

Yue Huang et al. Cancer Cell. .

Abstract

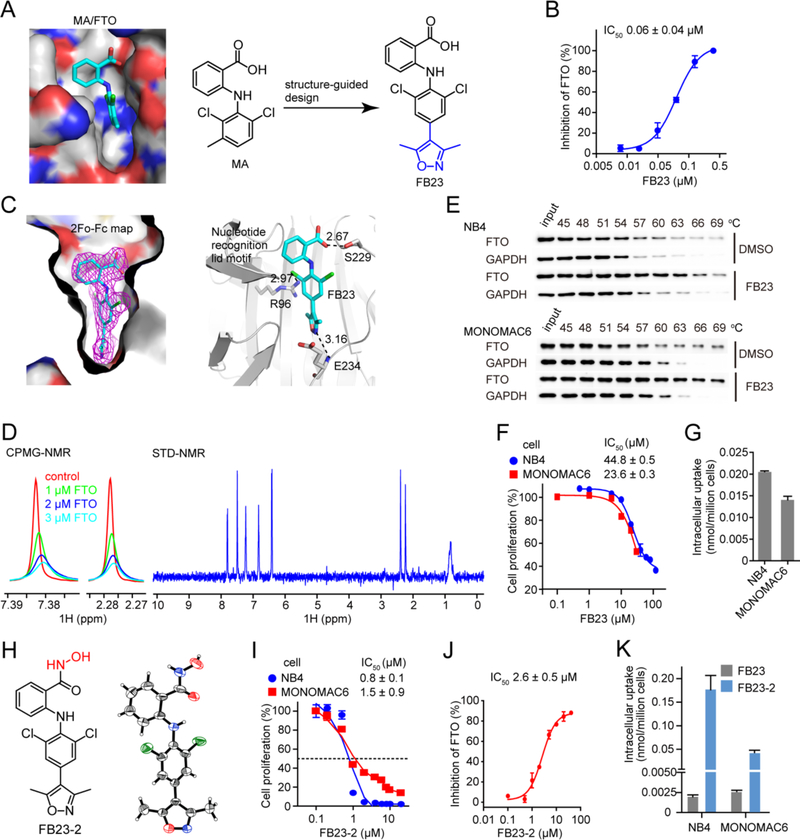
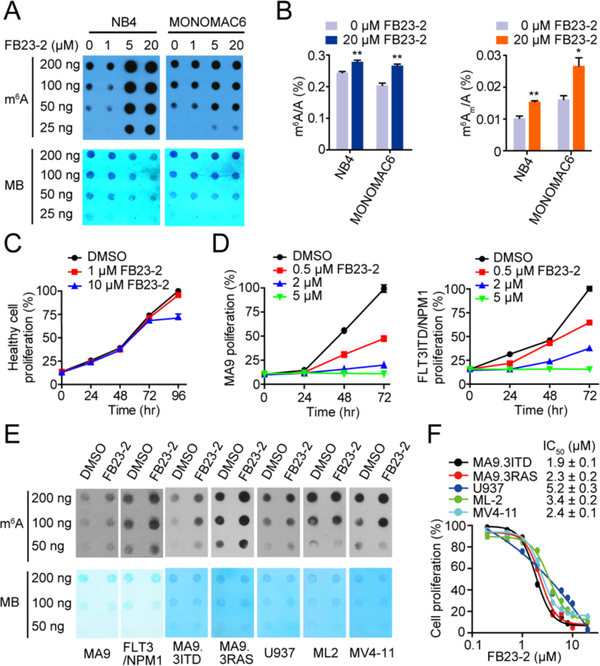
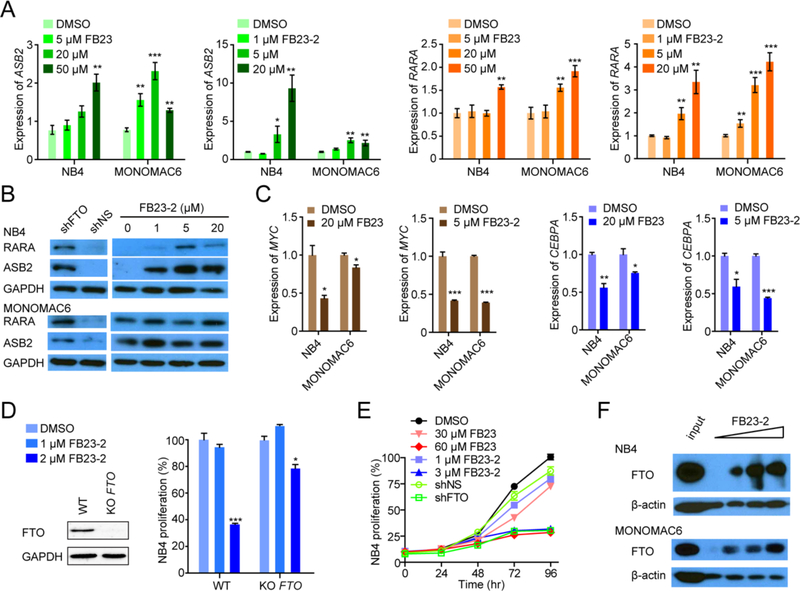
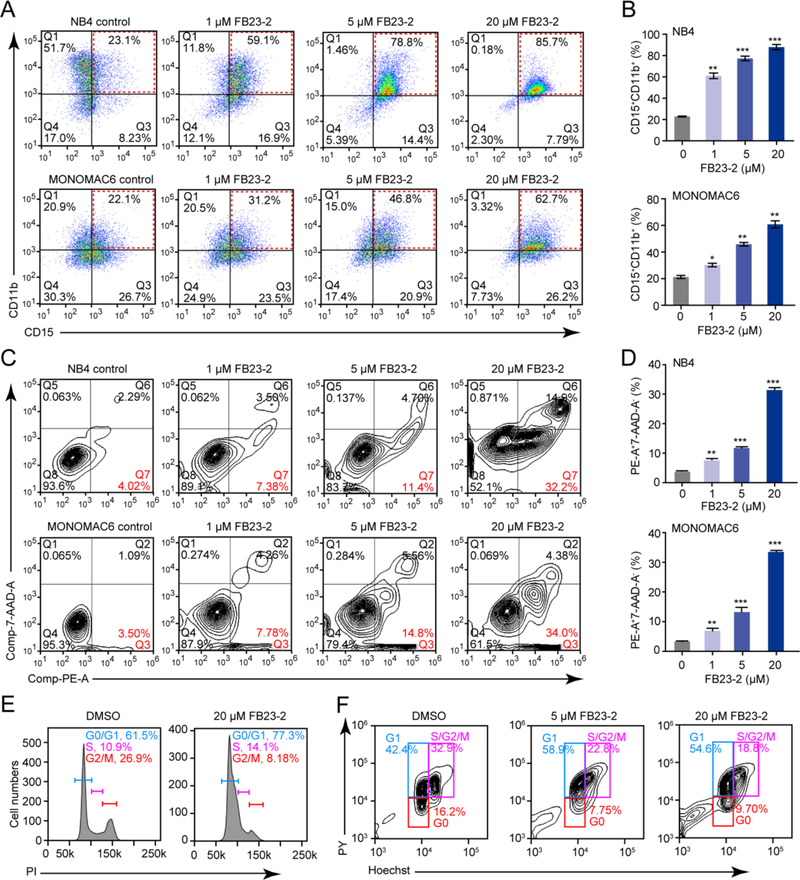
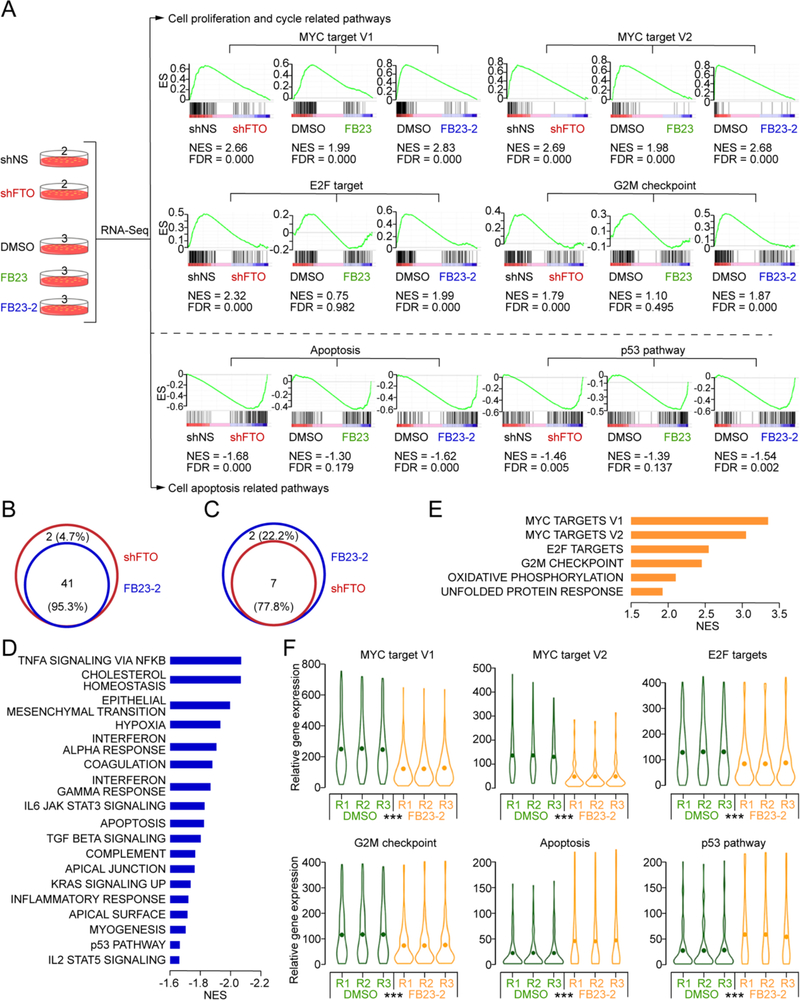
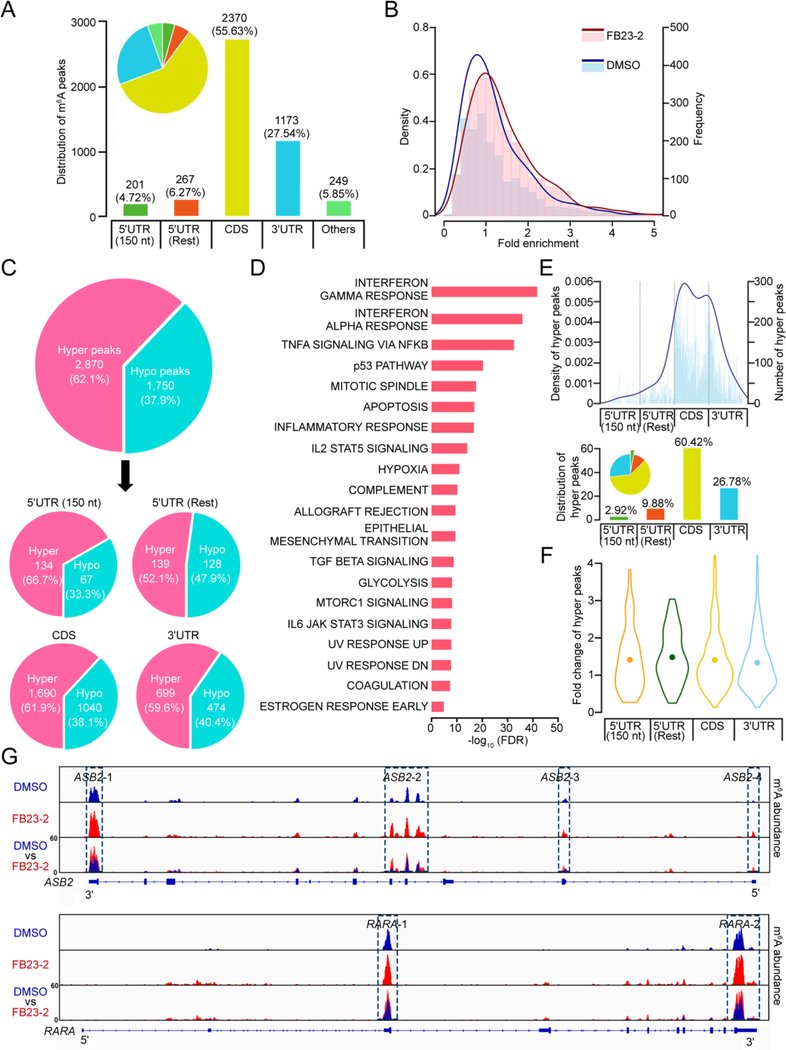
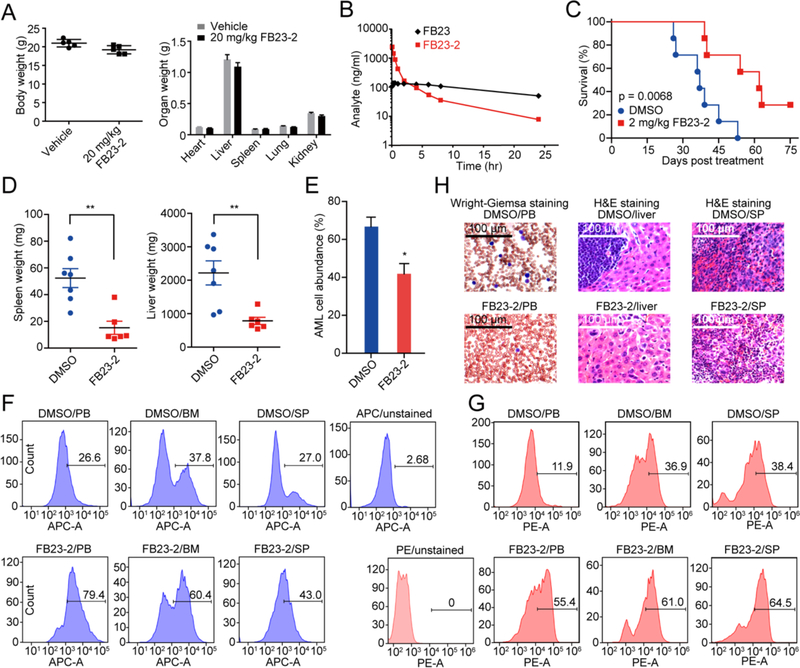
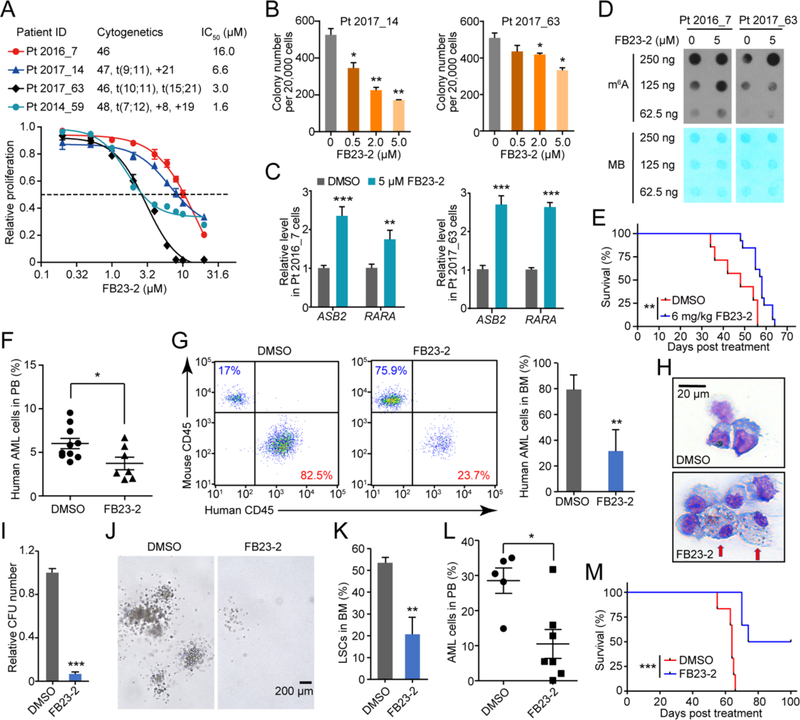
FTO, an mRNA N6-methyladenosine (m6A) demethylase, was reported to promote leukemogenesis. Using structure-based rational design, we have developed two promising FTO inhibitors, namely FB23 and FB23-2, which directly bind to FTO and selectively inhibit FTO's m6A demethylase activity. Mimicking FTO depletion, FB23-2 dramatically suppresses proliferation and promotes the differentiation/apoptosis of human acute myeloid leukemia (AML) cell line cells and primary blast AML cells in vitro. Moreover, FB23-2 significantly inhibits the progression of human AML cell lines and primary cells in xeno-transplanted mice. Collectively, our data suggest that FTO is a druggable target and that targeting FTO by small-molecule inhibitors holds potential to treat AML.

Keywords: FTO inhibitor; RNA epitranscriptomics; acute myeloid leukemia; cancer therapy; structure-based design; target validation.


Figures

Figure 1.
Figure 1.. Design and characteristic profiling of FTO inhibitors.
(A) Structure-guided design of inhibitor FB23. The MA binding pocket in FTO is shown, and MA is colored in cyan. (B) Effect of FB23 on FTO demethylation of m6A in RNA in vitro using HPLC quantification. (C) Structural complex of FTO bound with FB23. 2Fo-Fc density map contoured to 1.0 sigma was shown in magenta. Dark dotted lines indicate hydrogen bonding, and the distance in Å is labelled. (D) NMR measurement of FB23 interacting with FTO. The CPMG-NMR spectra are recorded for FB23 without FTO (red), and with FTO at 1.0 μM (green), 2.0 μM (blue), and 3.0 μM (cyan), respectively. The STD-NMR spectrum for FB23 is recorded with 5 μM FTO. (E) Representative western blots for the effects of 50 μM FB23 on thermal stabilization of FTO protein. CETSA was assayed in cell lysates. The results are derived from three biological replicates. (F) Effect of FB23 treatment of 72 hr on proliferation of AML cells. (G) Determination of cellular uptake of FB23 by LC-MS/MS quantitation. AML cells were treated with 10 μM FB23 for 24 hr. (H) Structure of FB23-2. Its absolute configuration was determined by X-ray. (I) Effect of FB23-2 treatment of 72 hr on proliferation of AML cells. (J) Inhibition of FB23-2 on FTO demethylation of m6A in RNA in vitro using HPLC quantification. (K) Determination of cellular uptake of FB23-2 by LC-MS/MS quantitation. FB23, the hydrolysate of FB23-2 was also detected. AML cells were treated with 10 μM FB23-2 for 24 hr. Error bars, mean ± SD, n = 3. See also Figure S1 and Table S1.
Figure 2.
Figure 2.. FB23-2 displays anti-proliferation effect via upregulating global m6A levels.
(A) Determination of m6A abundance in mRNA in NB4 and MONOMAC6 cells upon FB23-2 treatment for 72 hr via dot blot assay. MB (Methylene Blue) represents loading control of RNA samples. The results are derived from two biological replicates. (B) Quantitation of the percentage of m6A/A and m6Am/A ratios in mRNA by LC-MS/MS in NB4 and MONOMAC6 cells treated with 20 μM FB23-2 for 72 hr. (C) Effect of FB23-2 on proliferation of human normal BM cells isolated from a healthy donor. (D) Effect of FB23-2 on proliferation in MA9 and FLT3ITD/NPM1 mouse BM cells. (E) Determination of m6A abundance in MA9 and FLT3/NPM1 primary cells isolated from AML mice and in the five human AML cell lines upon 5 μM FB23-2 treatment for 72 hr by dot blot assay. (F) Effect of FB23-2 treatment of 96 hr on proliferation of a panel of AML cell lines with different genetic backgrounds and molecular mutations. *, p < 0.05; **, p < 0.01; unpaired Student’s t-test. Error bar, mean ± SD, n = 3.
Figure 3.
Figure 3.. Regulatory pathway and target engagement of FTO inhibitors.
(A) Effects of FB23 and FB23-2 treatment of 72 hr on ASB2 and RARA mRNA expression in NB4 and MONOMAC6 AML cells by RT-qPCR. (B) Effects of FTO KD (shFTO) and FB23-2 treatment of 72 hr on RARA and ASB2 abundance in AML cells by western blot. shNS, the control shRNA. The results are derived from two biological replicates. (C) Effects of FB23 and FB23-2 treatment of 72 hr on MYC and CEBPA mRNA expression in AML cells by RT-qPCR. (D) Effect of FB23-2 treatment of 72 hr on proliferation of FTO KO NB4 cells. FTO abundance was measured by western blot. The percentage of each stable cell line treated with FB23-2 was normalized to that treated with DMSO. (E) Effects of FTO inhibitors and shFTO on proliferation of NB4 cells. (F) Representative DARTS results for FTO levels by western blot. AML cell lysates with 50 μM, 200 μM, and 500 μM FB23-2 were incubated for 1 hr at room temperature before pronase digestion. The results are derived from three biological replicates. *, p < 0.05; **, p < 0.01; ***, p < 0.001; unpaired Student’s t-test. Error bar, mean ± SD, n = 3. See also Figure S2 and Table S2–S3.
Figure 4.
Figure 4.. The impact of FB23-2 on AML cell differentiation, apoptosis, and cycle arrest in vitro.
(A and B) The effect of FB23-2 on ATRA-induced myeloid differentiation in AML cells was analysed by FACS (A) and the percentage of CD15+CD11b+ cells was quantified (B). NB4 cells were treated with 200 nM ATRA, while MONOMAC6 cells were treated with 1 μM ATRA for 48 hr. (C and D) The effect of FB23-2 on cell apoptosis was analysed by FACS (C) and the percentage of cells positive for Annexin V and 7-AAD staining was quantified (D). NB4 cells were treated for 48 hr, while MONOMAC6 cells for 72 hr. (E and F) Determination of the effect of FB23-2 on cell cycle arrest by FACS based on PI staining (E) or Hoechst/Pyronin Y staining (F) in MONOMAC6 cells after 24 hr of treatment. *, p < 0.05; **, p < 0.01; ***, p < 0.001; unpaired Student’s t-test. Error bars, mean ± SD, n = 3.
Figure 5.
Figure 5.. Transcriptome-wide RNA-seq assays to identify potential targets of FTO inhibitors in AML cells.
(A) Transcriptome strategy of RNA-seq conducted on NB4 cells exposed to 5 μM inhibitor for 48 hr. shFTO and shNS groups contain two biological replicates; FB23, FB23-2, and DMSO groups contain three replicates. Gene set enrichment analysis (GSEA) was used to analyse the signaling pathways enrichment in different groups. Normalized enrichment score (NES) indicated the analysis results across gene sets. False discovery rate (FDR) presented if a set was significantly enriched. ES, enrichment score. (B) Venn diagram of the shared pathways among the increased signaling pathways in FTO KD and FB23-2 treated NB4 cells. (C) Venn diagram of the shared pathways among the decreased signaling pathways in FTO KD and FB23-2 treated NB4 cells. (D and E) The core enriched signaling pathways, including increased (D) and decreased (E), in FTO inhibited (shFTO + FB23 + FB23-2) cells compared to control (shNS + DMSO). The NES values of the pathways with p < 0.001 are presented. (F) Violin plots showing the relative abundance of genes involved in the MYC pathway, G2M checkpoint, E2F targets, apoptosis, and p53 pathway in DMSO and FB23-2 treated NB4 cells. ***, p < 0.001; paired t-test. See also Figure S3 and Table S4.
Figure 6.
Figure 6.. Transcriptome-wide m6A-seq assays to confirm the effects of FB23-2 in AML cells.
(A) Distribution of m6A peaks in different regions of mRNA as detected in m6A-seq assays conducted on MONOMAC6 cells upon treatment with DMSO or 5 μM FB23-2 for 72 hr. 5’UTR (150 nt) represents the first 150 nt of 5’ end of 5’UTR, while 5’UTR (Rest) represents the remaining regions of 5’ end of 5’UTR. (B) The density (line) and frequency (histogram) of m6A peaks from m6A-seq assays conducted in FB23-2 treated (red) and DMSO treated (blue) MONOMAC6 cells. (C) Distribution of FB23-2-increased m6A peaks (termed hyper peaks) and FB23-2-decreased m6A peaks (termed hypo peaks) from m6A-seq assays conducted in FB23-2 and DMSO treated MONOMAC6 cells. The peaks which were significantly (p < 0.001) altered in FB23-2 group compared with DMSO group are presented. (D) GSEA analysis of the genes with increased m6A abundance upon FB23-2 treatment identified by m6A-seq in MONOMAC6 cells. (E) The adjusted density (line, top) and distribution (histogram, bottom) of hyper peaks from (C) across different mRNA regions. (F) Fold changes of hyper peaks from (C) in different regions of mRNAs. (G) The m6A abundance in ASB2 and RARA transcripts. The m6A peaks were called by exomePeak. See also Figure S4.
Figure 7.
Figure 7.. FB23-2 delays leukemogenesis in vivo.
(A) The weight of body and organs of female BALB/c mice (n = 5) treated with vehicle or 20 mg/kg FB23-2 daily for 14 days. The weight was recorded at day 15. (B) Pharmacokinetics of FB23-2. The concentration of FB23-2 and FB23 in the serum was quantitated by LC-MS/MS after i.p. administration of 3 mg/kg to rat. (C) Kaplan-Meier survival curves of MONOMAC6 xeno-transplanted mice (n = 7 for each group) after vehicle or FB23-2 treatment. The p value was calculated with the log-rank test. (D) The weight of spleen and liver of mice from (C) at the endpoint. (E) The percentage of human AML cells in the PB of mice from (C) at the endpoint was analysed by FACS. (F-G) FACS analysis of the distribution of human AML cells in PB, BM, and spleen (SP) of mice from (C) at the endpoint and stained with anti-human CD15 (F) and anti-human CD11b (G). (H) Staining of PB, liver, and SP of mice from (C) at the endpoint. *, p < 0.05; **, p < 0.01; unpaired Student’s t-test. Error bars, mean ± SEM. See also Figure S5 and Tables S5–S7.
Figure 8.
Figure 8.. Therapeutic efficacy of FB23-2 in PDX mouse model.
(A) Effect of FB23-2 treatment of 96 hr on proliferation of primary BM cells collected from four leukemic patients. The proliferation is relative to vehicle group. (B) Effect of FB23-2 on colony formation in AML patient cells for 12 days. (C) Expression of ASB2 and RARA in control and 5 μM FB23-2 treated primary BM cells for 72 hr detected by RT-qPCR. (D) Determination of m6A abundance in the poly(A)+ RNA samples upon FB23-2 treatment of 72 hr in primary BM cells via dot blot assay. The results are derived from two biological replicates. (E) Kaplan-Meier analysis of patient AML cell-bearing NSGS mice with i.p. administration of DMSO (n = 7) or FB23-2 (n = 13). The BM sample from patient Pt 2017_63 was used for transplantation. The graph starts from the first day after transplantation. (F and G) FACS analysis of the percentage of patient AML (human CD45+) cells in PB collected from PDX mice one day after the 17-day full treatment of DMSO (n = 10) or FB23-2 (n = 7) (F), and in BM collected when the mice became moribund (n = 3 – 4) (G). (H) Wright-Giemsa staining to show the effect of FB23-2 on differentiation of human leukemia cells from primary PDX mice BM when the mice became moribund (n = 3 – 4). Arrows indicated differentiated cells. (I-J) Relative CFUs (I) and morphology of colonies (J) of patient AML cells from primary PDX mice (n = 3 – 4). (K) FACS analysis of the percentage of LSCs (human CD34+CD38 cells) in BM from primary PDX mice when they became moribund (n = 3 – 4). (L) FACS analysis of the percentage of human AML cells (human CD45+) in PB isolated from the secondarily transplanted PDX mice 8 weeks post transplantation, which were reconstituted with the same number of leukemia cells from primary PDX mice treated with DMSO (n = 5) or FB23-2 (n = 7). (M) Kaplan–Meier analysis of the secondary recipient mice transplanted with AML cells collected from primary PDX mice treated at indicated (n = 6). *, p < 0.05; **, p < 0.01; ***, p < 0.001; unpaired Student’s t-test. Error bars, mean ± SEM; if not indicated, n = 3. See also Figure S6 and Table S8.

Comment in

References

    1. Aik W, Demetriades M, Hamdan MK, Bagg EA, Yeoh KK, Lejeune C, Zhang Z, McDonough MA, and Schofield CJ (2013). Structural basis for inhibition of the fat mass and obesity associated protein (FTO). J. Med. Chem 56, 3680–3688. - PubMed
    1. Akichika S, Hirano S, Shichino Y, Suzuki T, Nishimasu H, Ishitani R, Sugita A, Hirose Y, Iwasaki S, Nureki O, and Suzuki T (2019). Cap-specific terminal N (6)-methylation of RNA by an RNA polymerase II-associated methyltransferase. Science 363. - PubMed
    1. Alarcon CR, Lee H, Goodarzi H, Halberg N, and Tavazoie SF (2015). N6-methyladenosine marks primary microRNAs for processing. Nature 519, 482–485. - PMC - PubMed
    1. Barbieri I, Tzelepis K, Pandolfini L, Shi J, Millan-Zambrano G, Robson SC, Aspris D, Migliori V, Bannister AJ, Han N, et al. (2017). Promoter-bound METTL3 maintains myeloid leukaemia by m(6)A-dependent translation control. Nature 552, 126–131. - PMC - PubMed
    1. Blaschke K, Ebata KT, Karimi MM, Zepeda-Martínez JA, Goyal P, Mahapatra S, Tam A, Laird DJ, Hirst M, Rao A, et al. (2013). Vitamin C induces Tet-dependent DNA demethylation and a blastocyst-like state in ES cells. Nature 500, 222. - PMC - PubMed

Publication types

MeSH terms