. 2019:23:101820.
doi: 10.1016/j.nicl.2019.101820. Epub 2019 Apr 10.

Fixel-based analysis of the preterm brain: Disentangling bundle-specific white matter microstructural and macrostructural changes in relation to clinical risk factors

Affiliations

Fixel-based analysis of the preterm brain: Disentangling bundle-specific white matter microstructural and macrostructural changes in relation to clinical risk factors

Diliana Pecheva et al. Neuroimage Clin. 2019.

Abstract

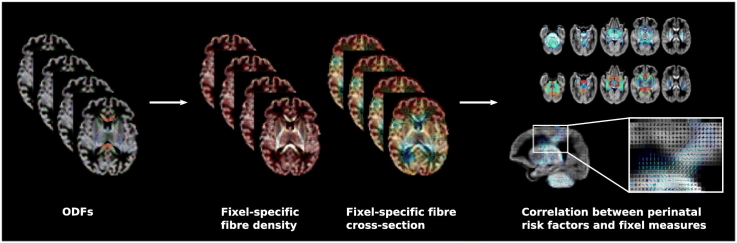
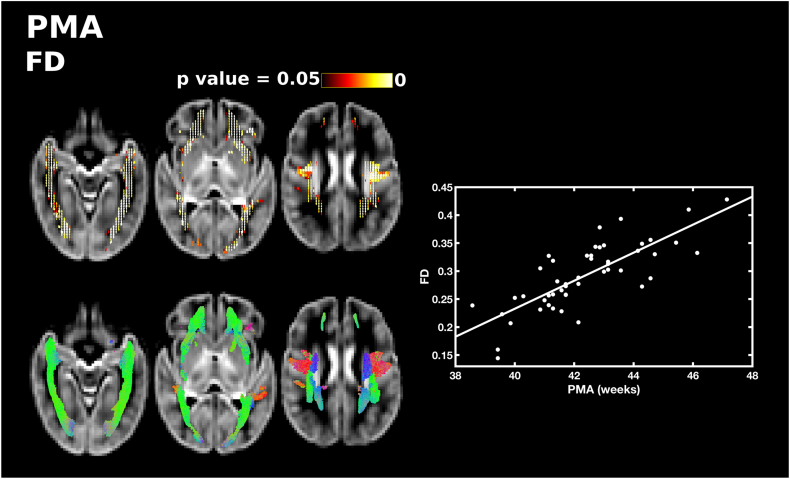
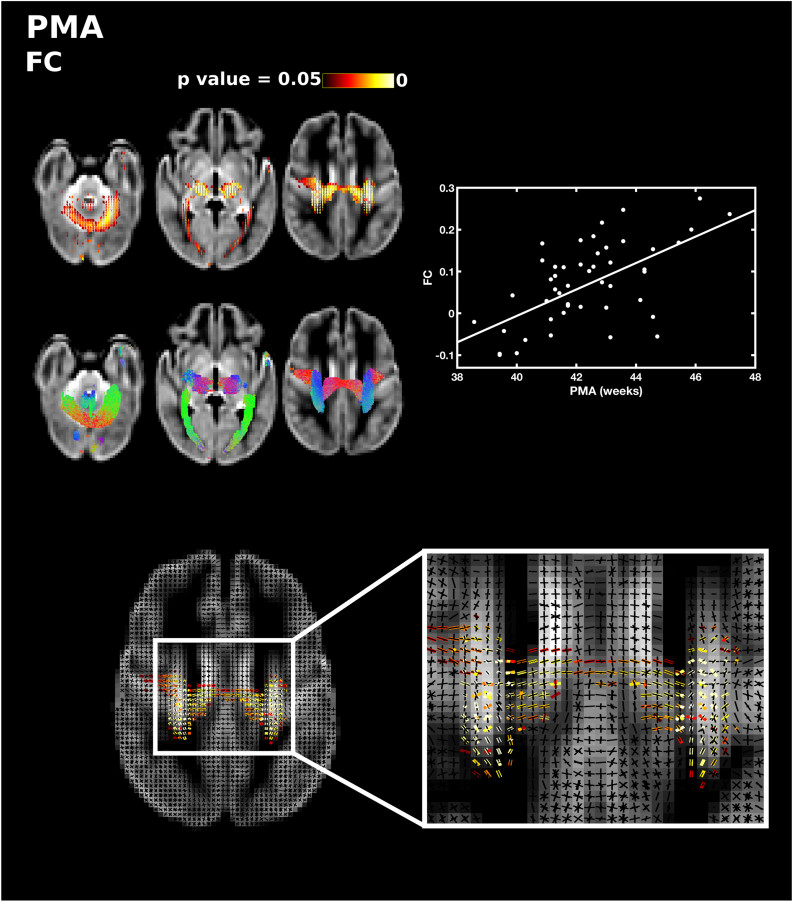
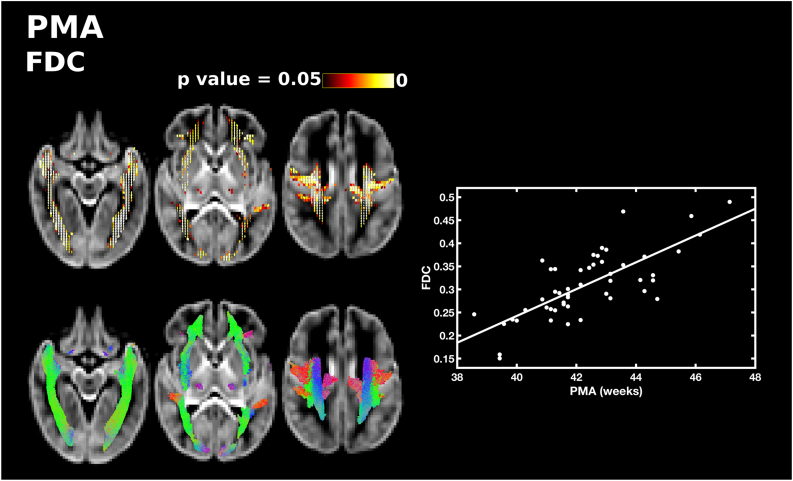
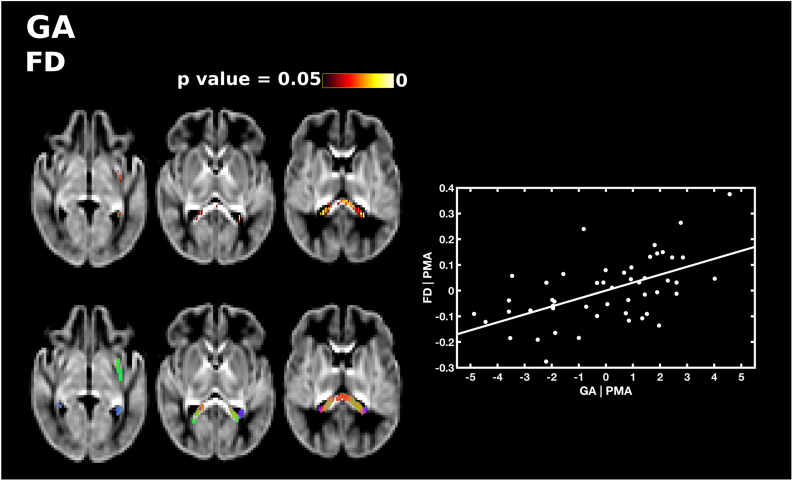
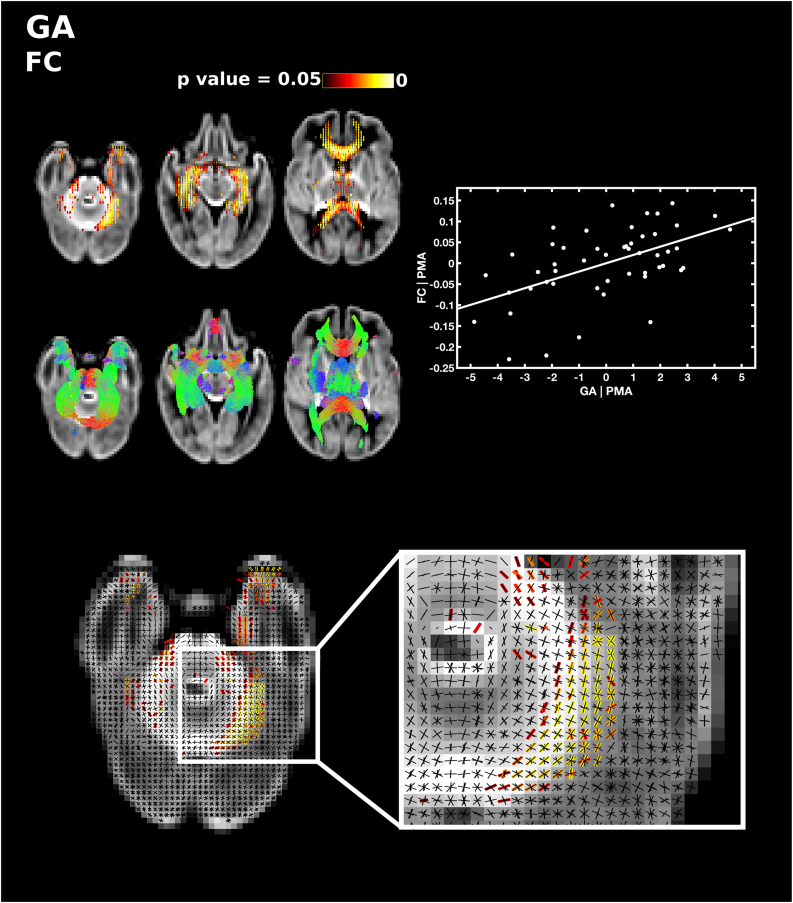
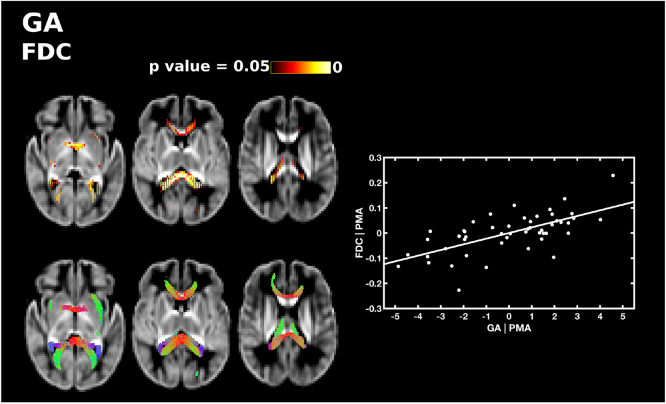
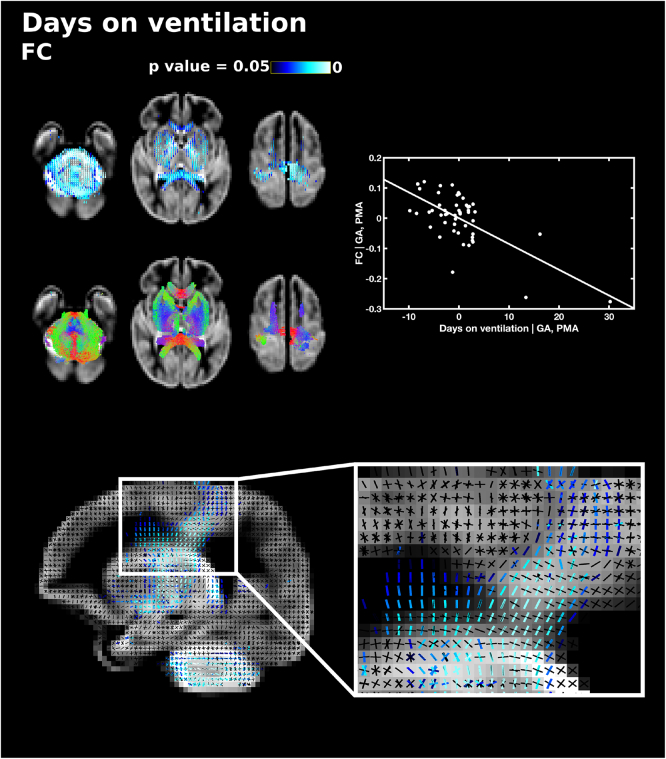
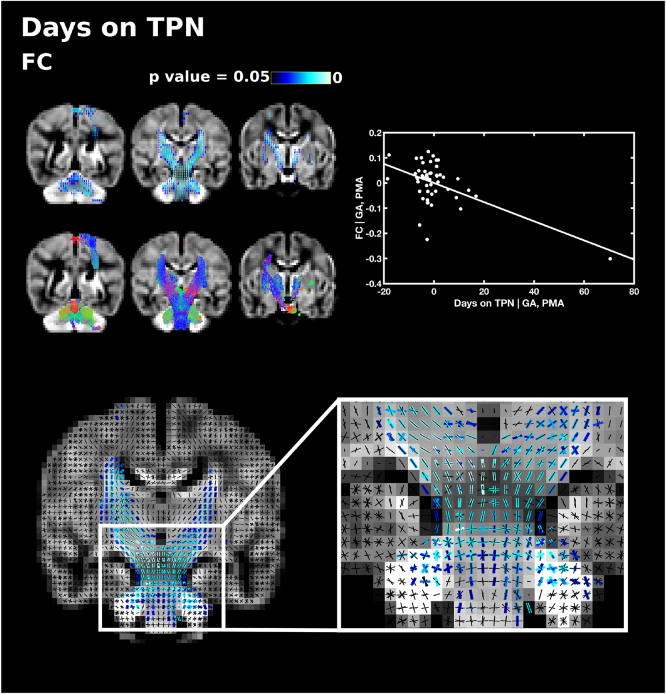
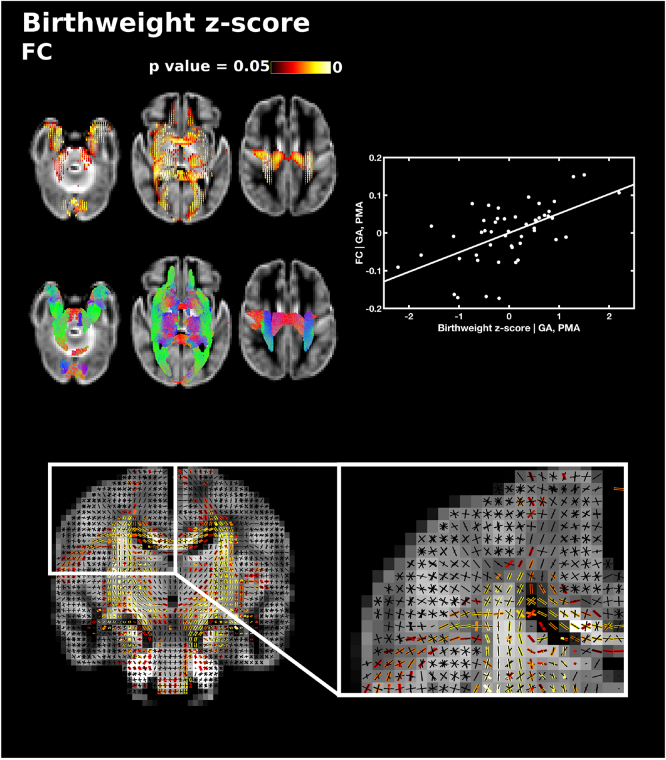
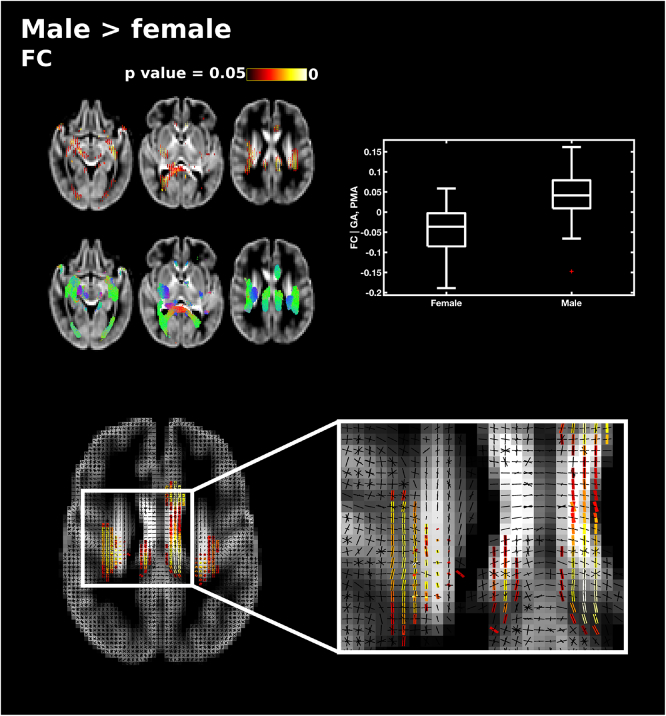
Diffusion MRI (dMRI) studies using the tensor model have identified abnormal white matter development associated with perinatal risk factors in preterm infants studied at term equivalent age (TEA). However, this model is an oversimplification of the underlying neuroanatomy. Fixel-based analysis (FBA) is a novel quantitative framework, which identifies microstructural and macrostructural changes in individual fibre populations within voxels containing crossing fibres. The aim of this study was to apply FBA to investigate the relationship between fixel-based measures of apparent fibre density (FD), fibre bundle cross-section (FC), and fibre density and cross-section (FDC) and perinatal risk factors in preterm infants at TEA. We studied 50 infants (28 male) born at 24.0-32.9 (median 30.4) weeks gestational age (GA) and imaged at 38.6-47.1 (median 42.1) weeks postmenstrual age (PMA). dMRI data were acquired in non-collinear directions with b-value 2500 s/mm2 on a 3 Tesla system sited on the neonatal intensive care unit. FBA was performed to assess the relationship between FD, FC, FDC and PMA at scan, GA at birth, days on mechanical ventilation, days on total parenteral nutrition (TPN), birthweight z-score, and sex. FBA reveals fibre population-specific alterations in FD, FC and FDC associated with clinical risk factors. FD was positively correlated with GA at birth and was negatively correlated with number of days requiring ventilation. FC was positively correlated with GA at birth, birthweight z-scores and was higher in males. FC was negatively correlated with number of days on ventilation and days on TPN. FDC was positively correlated with GA at birth and birthweight z-scores, negatively correlated with days on ventilation and days on TPN and higher in males. We demonstrate that these relationships are fibre-specific even within regions of crossing fibres. These results show that aberrant white matter development involves both microstructural changes and macrostructural alterations.

Keywords: Brain; Diffusion MRI; Fixel-based analysis; Preterm.


Figures

Unlabelled Image
Graphical abstract
Fig. 1
Fig. 1
The relationship between PMA at scan and apparent fibre density (FD). Fixels with a significant positive correlation (corrected p < 0.05) are shown on the top row, and streamlines passing through significant fixels (coloured by direction red: left-right; green: anterior-posterior; blue: inferior-superior) are shown on the bottom row, in the axial plane. The scatter plot shows the correlation between PMA and FD averaged over all significant fixels. (For interpretation of the references to color in this figure legend, the reader is referred to the web version of this article.)
Fig. 2
Fig. 2
The relationship between PMA at scan and fibre cross-section (FC). Fixels with a significant positive correlation (corrected p < 0.05) are shown on the top row, and streamlines passing through significant fixels (coloured by direction red: left-right; green: anterior-posterior; blue: inferior-superior) are shown on the bottom row, in the axial plane. The scatter plot shows the correlation between PMA and FC averaged over all significant fixels. The single slice axial plane shows a close up of fixels within a crossing fibre region that are significantly correlated with PMA (red-yellow) overlaid on the fixel template (black), showing that callosal and corticospinal fixels are significantly associated with PMA but not association fibre fixels. (For interpretation of the references to color in this figure legend, the reader is referred to the web version of this article.)
Fig. 3
Fig. 3
The relationship between PMA at scan and fibre density and cross-section (FDC). Fixels with a significant positive correlation (corrected p < 0.05) are shown on the top row, and streamlines passing through significant fixels (coloured by direction red: left-right; green: anterior-posterior; blue: inferior-superior) are shown on the bottom row, in the axial plane. The scatter plot shows the correlation between PMA and FDC averaged over all significant fixels. (For interpretation of the references to color in this figure legend, the reader is referred to the web version of this article.)
Fig. 4
Fig. 4
The relationship between GA at birth and apparent fibre density (FD), corrected for PMA at scan. Fixels with a significant positive correlation (corrected p < 0.05) are shown on the top row, and streamlines passing through significant fixels (coloured by direction red: left-right; green: anterior-posterior; blue: inferior-superior) are shown on the bottom row, in the axial plane. The scatter plot shows the partial correlation between GA and FD averaged over all significant fixels, corrected for PMA. (For interpretation of the references to color in this figure legend, the reader is referred to the web version of this article.)
Fig. 5
Fig. 5
The relationship between GA at birth and fibre cross-section (FC), corrected for PMA at scan. Fixels with a significant positive correlation (corrected p < 0.05) are shown on the top row, and streamlines passing through significant fixels (coloured by direction red: left-right; green: anterior-posterior; blue: inferior-superior) are shown on the bottom row, in the axial plane. The scatter plot shows the partial correlation between GA and FC averaged over all significant fixels, corrected for PMA. The single slice axial plane in the FC panel shows a close up of fixels within the cerebellum that are significantly correlated with GA (red-yellow) overlaid on the fixel template (black), highlighting which fibres within crossing fibre regions are significantly associated with prematurity. (For interpretation of the references to color in this figure legend, the reader is referred to the web version of this article.)
Fig. 6
Fig. 6
The relationship between GA at birth and apparent fibre density and cross-section (FDC), corrected for PMA at scan. Fixels with a significant positive correlation (corrected p < 0.05) are shown on the top row, and streamlines passing through significant fixels (coloured by direction red: left-right; green: anterior-posterior; blue: inferior-superior) are shown on the bottom row, in the axial plane. The scatter plot shows the partial correlation between GA and FDC averaged over all significant fixels, corrected for PMA. (For interpretation of the references to color in this figure legend, the reader is referred to the web version of this article.)
Fig. 7
Fig. 7
The relationship between the number of days requiring mechanical ventilation and fibre cross-section (FC), corrected for PMA at scan and GA at birth. Fixels with a significant negative correlation (corrected p < 0.05) are shown on the top row, and streamlines passing through significant fixels (coloured by direction red: left-right; green: anterior-posterior; blue: inferior-superior) are shown on the bottom row, in the axial plane. The scatter plot shows the partial correlation between days on mechanical ventilation and FC averaged over all significant fixels, corrected for PMA and GA. The sagittal plane shows a close up of fixels significantly correlated with days on ventilation (blue) overlaid on the fixel template (black) in the centrum semiovale, showing that only corticospinal fixels and not callosal or association fibre fixels are associated with days on ventilation. (For interpretation of the references to color in this figure legend, the reader is referred to the web version of this article.)
Fig. 8
Fig. 8
The relationship between the number of days on total parenteral nutrition (TPN) and fibre cross-section (FC), corrected for PMA at scan and GA at birth. Fixels with a significant negative correlation (corrected p < .05) are shown on the top row, and streamlines passing through significant fixels (coloured by direction red: left-right; green: anterior-posterior; blue: inferior-superior) are shown on the bottom row, in the coronal plane. The scatter plot shows the partial correlation between days TPN and FC averaged over all significant fixels, corrected for PMA and GA. The single slice coronal plane shows a close up of fixels significantly correlated with days on TPN (blue) overlaid on the fixel template (black) in the brainstem, showing that both corticospinal fibres and pontine fixels are associated with days on TPN. (For interpretation of the references to color in this figure legend, the reader is referred to the web version of this article.)
Fig. 9
Fig. 9
The relationship between birthweight z-scores and fibre cross-section (FC), corrected for PMA at scan and GA at birth. Fixels with a significant positive correlation (corrected p < 0.05) are shown on the top row, and streamlines passing through significant fixels (coloured by direction red: left-right; green: anterior-posterior; blue: inferior-superior) are shown on the bottom row, in the axial plane. The scatter plot shows the partial correlation between birthweight z-scores and FC averaged over all significant fixels, corrected for PMA and GA. The single slice coronal plane shows a close up of fixels significantly correlated with birthweight z-scores (red-yellow) overlaid on the fixel template (black) in the centrum semiovale, showing that corticospinal and callosal fixels are associated with birthweight z-scores, but not association fibre fixels. (For interpretation of the references to color in this figure legend, the reader is referred to the web version of this article.)
Fig. 10
Fig. 10
Differences in fibre cross-section (FC) between male and female subjects, corrected for PMA at scan and GA at birth. Fixels with significantly higher FC in male subjects (corrected p < 0.05) are shown on the top and streamlines passing through significant fixels (coloured by direction red: left-right; green: anterior-posterior; blue: inferior-superior) are shown on the bottom row in the axial plane. The boxplot shows FC values for male and female subjects averaged over all significant fixels, corrected for GA and PMA. The single slice axial plane shows a close up of significant fixels (red-yellow) overlaid on the fixel template (black), showing that fixels in cingulum and superior longitudinal fasciculus but not corpus callosum differ between male and female subjects. (For interpretation of the references to color in this figure legend, the reader is referred to the web version of this article.)

Similar articles

Cited by

References

    1. Allin M., Walshe M., Fern A., Nosarti C., Cuddy M., Rifkin L., Murray R., Rushe T., Wyatt J. Cognitive maturation in preterm and term born adolescents. J. Neurol. Neurosurg. Psychiatry. 2008;79:381–386. - PubMed
    1. Andersson J.L.R., Sotiropoulos S.N. An integrated approach to correction for off-resonance effects and subject movement in diffusion MR imaging. Neuroimage. 2016;125:1063–1078. - PMC - PubMed
    1. Andersson J.L., Skare S., Ashburner J. How to correct susceptibility distortions in spin-echo echo-planar images: application to diffusion tensor imaging. Neuroimage. 2003;20:870–888. - PubMed
    1. Andersson J.L., Graham M.S., Zsoldos E., Sotiropoulos S.N. Incorporating outlier detection and replacement into a non-parametric framework for movement and distortion correction of diffusion MR images. Neuroimage. 2016;141:556–572. - PubMed
    1. Andersson J.L.R., Graham M.S., Drobnjak I., Zhang H., Filippini N., Bastiani M. Towards a comprehensive framework for movement and distortion correction of diffusion MR images: within volume movement. Neuroimage. 2017;152:450–466. - PMC - PubMed

Publication types