Review
. 2019 Jun 19;16(4):041005.
doi: 10.1088/1478-3975/ab1a09.

The 2019 mathematical oncology roadmap

Affiliations
Review

The 2019 mathematical oncology roadmap

Russell C Rockne et al. Phys Biol. .

Abstract

Whether the nom de guerre is Mathematical Oncology, Computational or Systems Biology, Theoretical Biology, Evolutionary Oncology, Bioinformatics, or simply Basic Science, there is no denying that mathematics continues to play an increasingly prominent role in cancer research. Mathematical Oncology-defined here simply as the use of mathematics in cancer research-complements and overlaps with a number of other fields that rely on mathematics as a core methodology. As a result, Mathematical Oncology has a broad scope, ranging from theoretical studies to clinical trials designed with mathematical models. This Roadmap differentiates Mathematical Oncology from related fields and demonstrates specific areas of focus within this unique field of research. The dominant theme of this Roadmap is the personalization of medicine through mathematics, modelling, and simulation. This is achieved through the use of patient-specific clinical data to: develop individualized screening strategies to detect cancer earlier; make predictions of response to therapy; design adaptive, patient-specific treatment plans to overcome therapy resistance; and establish domain-specific standards to share model predictions and to make models and simulations reproducible. The cover art for this Roadmap was chosen as an apt metaphor for the beautiful, strange, and evolving relationship between mathematics and cancer.


Figures

Figure 1.
Figure 1.
Illustrating the types of advances one might expect to see in the integration of mechanistic modeling into machine learning methods (and vice versa) applied to the case of brain cancer. Mechanistic models, e.g. [–5], and machine learning, e.g. [6, 7], can interact in multiple ways. (1) ML models can help mechanistic models make sense of multi-scale data to calibrate parameters, e.g. [8, 9]. (2) Mechanistic model predictions can be used as input into ML models to augment spatially or temporally sparse data, e.g. [10] (3) Static outputs from ML models can be used as initial conditions for mechanistic models and (4) ML models and mechanistic models can work together via data assimilation to create spatially and temporally resolved predictions over long periods of time.
Figure 2.
Figure 2.
A breast cancer patient was scanned by magnetic resonance imaging at four points during neoadjuvant therapy (NAT). The first two scans (left set of images) are used to calibrate model parameters for predicting response observed at the third time point. The last two scans (right set) are used to update parameters for predicting response observed at the time of surgery.
Figure 3.
Figure 3.
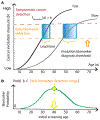
(A) Evolutionary trajectories of slow versus fast carcinogenesis correspond to longer versus shorter lead times for potential clinical intervention, respectively. (B) Screening programme design aims to maximise positive biomarker yield in an average at-risk population.
Figure 4.
Figure 4.
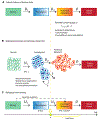
Three models of carcinogenesis to evaluate screening. (A) Natural history models may also explicitly include misdiagnoses into transition rates. (B) Biological models can incorporate growth rates initiated by tumor suppressor gene inactivation (e.g. APC in colorectal adenomas [39]). (C) Inferred biological event models can include alternative pathways such as known germline mutations (e.g. VHL in patients with von Hippel-Lindau disease [40]).
Figure 5.
Figure 5.
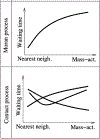
Schematic illustrating the different effects spatial restriction can have on the waiting time until a fitness valley is crossed, in the Moran Process and the contact process. Nearest neighbor interactions represent the strictest degrees of spatial restriction, while mass action corresponds to perfect mixing of cells.
Figure 6.
Figure 6.
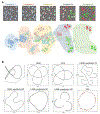
(A) Simulation of a longitudinal single-cell analysis with datasets at different timepoints. Different colours represent different cell types or states. In the down side, a TDA representation. (B) Comparison of TDA and traditional algorithms for dimensional reduction, as multidimensional scaling (MDS), principal component analysis (PCA) and t-distributed stochastic neighbor embedding (t-SNE).
Figure 7.
Figure 7.
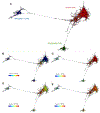
(A) A topological representation of a glioblastoma RNAseq single-cell dataset shows diverse stromal/tumour populations. The expression of specific genes shows similarity with known cell populations: (B) representation of MKI67 expression, (C) oligodendrocyte genes expression, (D) neural progenitor expression, and (E) astrocyte genes expression.
Figure 8.
Figure 8.
Schematic of relevant systems investigated when modelling cancer metabolism.
Figure 9.
Figure 9.
Pre-treatment tumor growth dynamics can be derived from volume measurements at diagnosis and treatment planning and used to calculate patient-specific PSI to predict RT responses.
Figure 10.
Figure 10.
Conventional high dose therapy (top) maximally selects for resistant phenotypes (pink). Adaptive therapy (bottom) maintains a small population of cells that are sensitive to treatment. While the resistant cells survive, the cost of resistance renders them less fit in the absence of therapy. Thus, sensitive cells return when therapy is removed, suppressing growth of the resistant population.
Figure 11.
Figure 11.
The same effective game [95] implemented by three different population structures and reductive games; from left to right: inviscid population, random 3-regular graph, experimental in vitro non-small-cell lung cancer [91].
Figure 12.
Figure 12.
Correspondence of research strategies to the process of tumour evolution: Tumour heterogeneity is driven by clonal populations traversing evolutionary trajectories, the interactions between them, and the diversification that results. The milieu of molecular mechanisms that can be observed at the time of biopsy potentially confers finite drug sensitivity phenotypes.
Figure 13.
Figure 13.
(A) Diagram of experimental setup, with varying proportions up drug sensitive (red) and resistant (green) cells. (B) Parameterization of the two-player game matrix, given the linear relationship between growth rate of drug resistant cells and proportion of seeded sensitive cells. (C) 2D representation of a fitness landscape in which the x-y plane represents genotype, and the landscape height represents fitness. From a single starting point of the wild-type genotype, diverging evolutionary trajectories emerge from saddle points, ending at multiple possible local fitness optima. (D) A six locus landscape drawn as a directed graph, in which each node is a genotype and each edge represents an evolutionary path between them. Arrows illustrate potential paths through multi-dimensional genotype space, toward local fitness optima as shown in panel C.

References

    1. Rockne R et al. 2010. Predicting the efficacy of radiotherapy in individual glioblastoma patients in vivo: a mathematical modeling approach Phys. Med. Biol 55 3271–85 - PMC - PubMed
    1. Neal ML. et al. Discriminating survival outcomes in patients with glioblastoma using a simulation-based, patient-specific response metric. PLoS One. 2013;8:e51951. - PMC - PubMed
    1. Neal ML et al. 2013. Response classification based on a minimal model of glioblastoma growth is prognostic for clinical outcomes and distinguishes progression from pseudoprogression Cancer Res. 73 2976–86 - PMC - PubMed
    1. Baldock A. et al. Patient-specific metrics of invasiveness reveal significant prognostic benefit of resection in a predictable subset of gliomas. PLoS One. 2014;9:e99057. - PMC - PubMed
    1. Swanson KR, Rockne RC, Claridge J, Chaplain MA, Alvord EC and Anderson ARA 2011. Quantifying the roleof angiogenesis in malignant progression of gliomas: insilico modeling integrates imaging and histology Cancer Res. 71 7366–75 - PMC - PubMed

Publication types