

The effect of ApoE ε4 on longitudinal brain region-specific glucose metabolism in patients with mild cognitive impairment: a FDG-PET study
- PMID: 30991617
- PMCID: PMC6449776
- DOI: 10.1016/j.nicl.2019.101795
The effect of ApoE ε4 on longitudinal brain region-specific glucose metabolism in patients with mild cognitive impairment: a FDG-PET study
Abstract
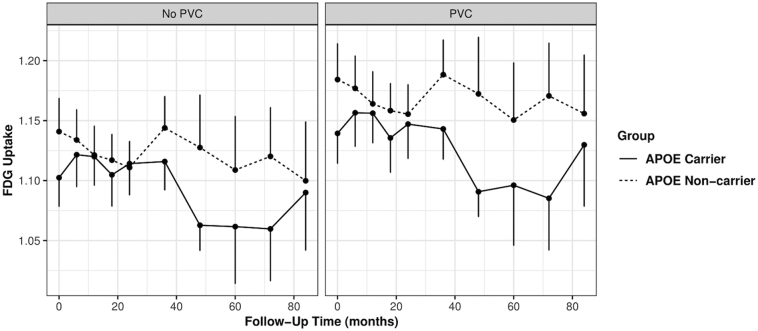
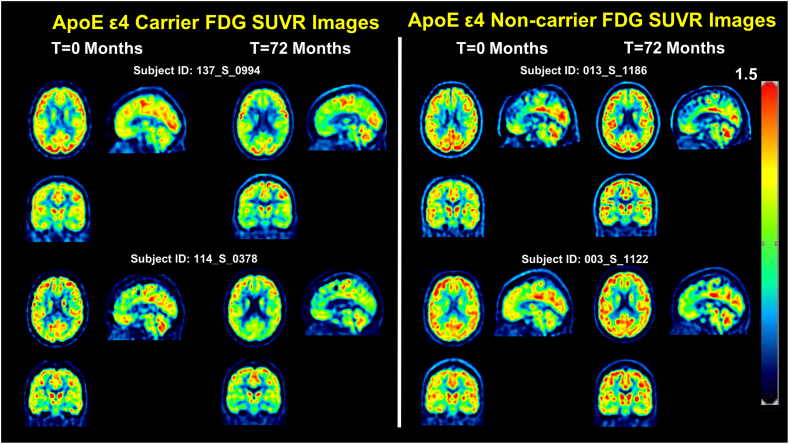
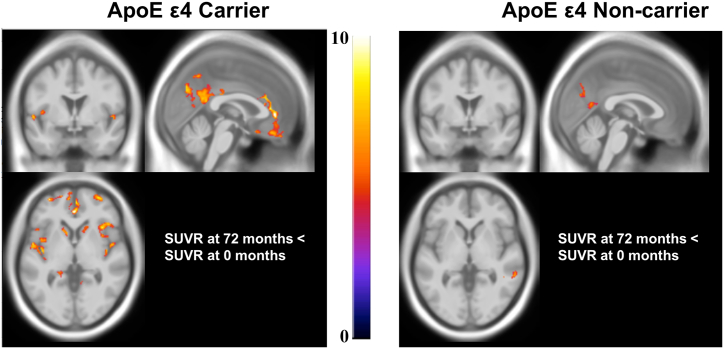
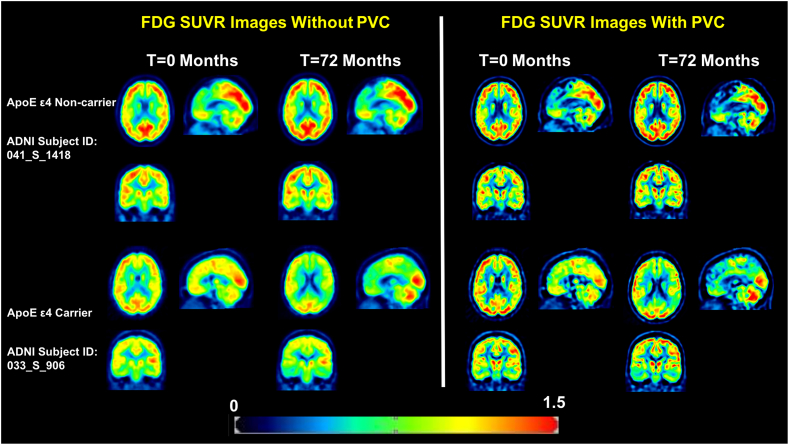
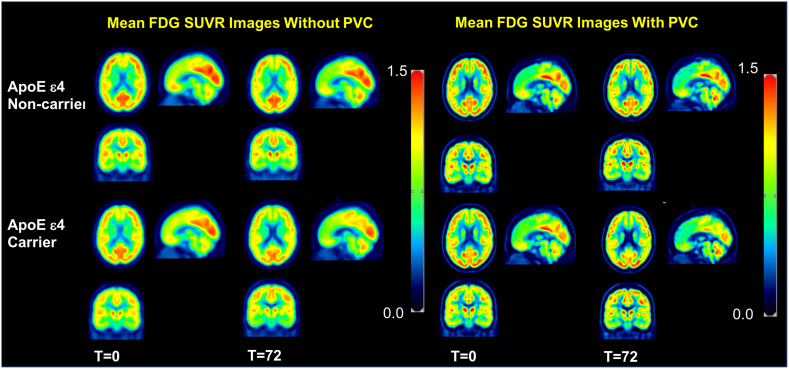
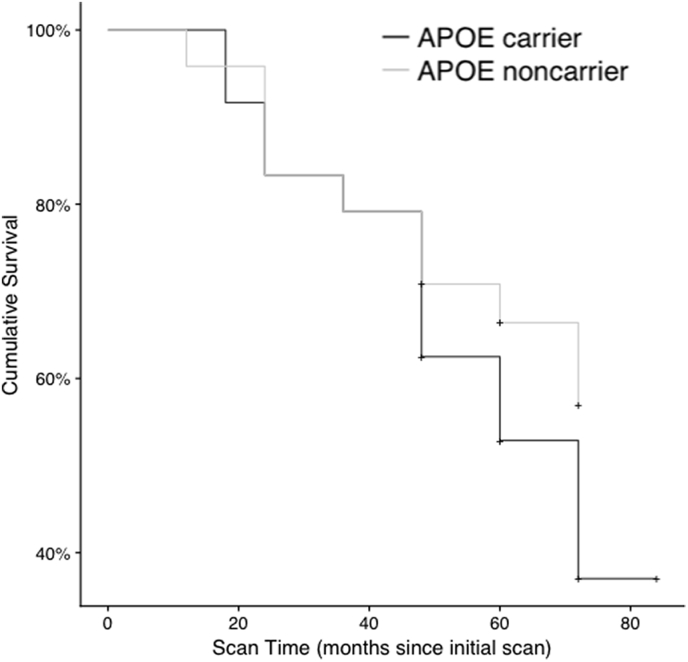
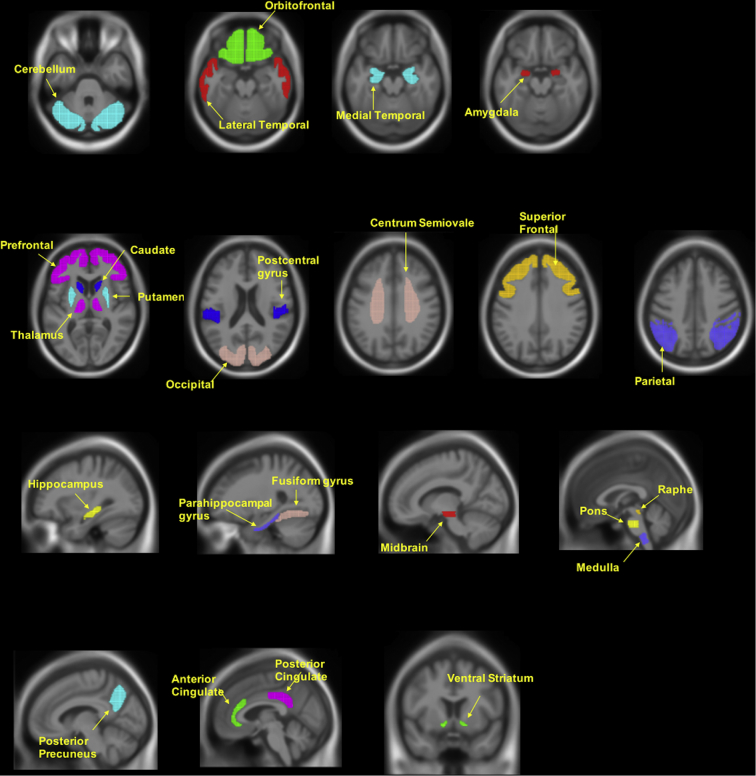
While the ApoE ε4 allele is a known risk factor for mild cognitive impairment (MCI) and Alzheimer's disease, brain region specific effects remain elusive. In this study, we investigate whether the ApoE ε4 allele exhibits brain region specific effects in longitudinal glucose uptake among patients with MCI from the Alzheimer's Disease Neuroimaging Initiative (ADNI). Preprocessed FDG PET images, MRIs, and demographic information were downloaded from the ADNI database. An iterative reblurred Van Cittertiteration method was used for partial volume correction (PVC) on all PET images. Structural MRIs were used for PET spatial normalization and region of interest (ROI) definition in standard space. Longitudinal changes in ROI FDG standardized uptake value ratio (SUVR) relative to cerebellum in 24 ApoE ε4 carriers and 24 age-matched ApoE ε4 non-carriers were measured for up to 84-months (median 72 months, SD = 11.2 months) and compared using a generalized linear mixed effects model controlling for gender, education, baseline age, and follow-up period. Additionally, voxelwise analysis was performed by implementing a paired t-test comparing matched baseline and 72 month FDG SUVR images in ApoE carriers and non-carriers separately. Results with PVC were compared with ones from non-PVC based analysis. After applying PVC, the superior fontal, parietal, lateral temporal, medial temporal, caudate, thalamus, and post-cingulate, and amygdala regions had greater longitudinal decreases in FDG uptake in ApoE ε4 carriers with MCI compared to non-carriers with MCI. Similar forebrain and limbic clusters were found through voxelwise analysis. Compared to the PVC based analysis, fewer significant ApoE-associated regions and clusters were found in the non-PVC based PET analysis. Our findings suggest that the ApoE ε4 genotype is associated with a longitudinal decline in glucose uptake in 8 forebrain and limbic brain regions in the context of MCI. In conclusion, this 84-months longitudinal FDG PET study demonstrates a novel ApoE ε4-associated brain-region specific glucose metabolism pattern in patients with MCI. Partial volume correction improved FDG PET quantification.
Keywords: Alzheimer's disease; ApoE ε4; FDG PET; Longitudinal; Mild cognitive impairment; Partial volume correction.
Copyright © 2019 The Authors. Published by Elsevier Inc. All rights reserved.
Figures
Similar articles
-
Sex modulates the ApoE ε4 effect on brain tau deposition measured by 18F-AV-1451 PET in individuals with mild cognitive impairment.Theranostics. 2019 Jul 9;9(17):4959-4970. doi: 10.7150/thno.35366. eCollection 2019. Theranostics. 2019. PMID: 31410194 Free PMC article.
-
Association of sex and APOE ε4 with brain tau deposition and atrophy in older adults with Alzheimer's disease.Theranostics. 2020 Aug 21;10(23):10563-10572. doi: 10.7150/thno.48522. eCollection 2020. Theranostics. 2020. PMID: 32929366 Free PMC article.
-
18F-fluorodeoxyglucose positron emission tomography, aging, and apolipoprotein E genotype in cognitively normal persons.Neurobiol Aging. 2014 Sep;35(9):2096-106. doi: 10.1016/j.neurobiolaging.2014.03.006. Epub 2014 Mar 11. Neurobiol Aging. 2014. PMID: 24702820 Free PMC article.
-
Sex modifies APOE ε4 dose effect on brain tau deposition in cognitively impaired individuals.Brain. 2021 Nov 29;144(10):3201-3211. doi: 10.1093/brain/awab160. Brain. 2021. PMID: 33876815 Free PMC article.
-
Cognitive Intra-individual Variability in Cognitively Healthy APOE ε4 Carriers, Mild Cognitive Impairment, and Alzheimer's Disease: a Meta-analysis.Neuropsychol Rev. 2024 Nov 21. doi: 10.1007/s11065-024-09654-2. Online ahead of print. Neuropsychol Rev. 2024. PMID: 39570562 Review.
Cited by
-
Hypoperfusion Precedes Tau Deposition in the Entorhinal Cortex: A Retrospective Evaluation of ADNI-2 Data.J Clin Neurol. 2023 Mar;19(2):131-137. doi: 10.3988/jcn.2022.0088. Epub 2023 Jan 2. J Clin Neurol. 2023. PMID: 36647226 Free PMC article.
-
Mitochondria dysfunction in the pathogenesis of Alzheimer's disease: recent advances.Mol Neurodegener. 2020 May 29;15(1):30. doi: 10.1186/s13024-020-00376-6. Mol Neurodegener. 2020. PMID: 32471464 Free PMC article. Review.
-
Age, sex and APOE-ε4 modify the balance between soluble and fibrillar β-amyloid in non-demented individuals: topographical patterns across two independent cohorts.Mol Psychiatry. 2022 Apr;27(4):2010-2018. doi: 10.1038/s41380-022-01436-7. Epub 2022 Mar 2. Mol Psychiatry. 2022. PMID: 35236958 Free PMC article.
-
APOE-ε4-related differences in left thalamic microstructure in cognitively healthy adults.Sci Rep. 2020 Nov 13;10(1):19787. doi: 10.1038/s41598-020-75992-9. Sci Rep. 2020. PMID: 33188215 Free PMC article.
-
Insights into Computational Drug Repurposing for Neurodegenerative Disease.Trends Pharmacol Sci. 2019 Aug;40(8):565-576. doi: 10.1016/j.tips.2019.06.003. Epub 2019 Jul 17. Trends Pharmacol Sci. 2019. PMID: 31326236 Free PMC article. Review.
References
-
- Breslow J.L., Zannis V.I., SanGiacomo T.R., Third J.L., Tracy T., Glueck C.J. Studies of familial type III hyperlipoproteinemia using as a genetic marker the apoE phenotype E2/2. J. Lipid Res. 1982;23:1224–1235. - PubMed
-
- Bruscoli M., Lovestone S. Is MCI really just early dementia? A systematic review of conversion studies. Int. Psychogeriatrics. 2004 - PubMed
-
- Chan D., Janssen J.C., Whitwell J.L., Watt H.C., Jenkins R., Frost C., Rossor M.N., Fox N.C. Change in rates of cerebral atrophy over time in early-onset Alzheimer's disease: longitudinal MRI study. Lancet. 2003;362:1121–1122. - PubMed
MeSH terms
Substances
LinkOut - more resources
Full Text Sources
Medical
Miscellaneous
