

Effect of age, ethnicity, sex, cognitive status and APOE genotype on amyloid load and the threshold for amyloid positivity
- PMID: 30991618
- PMCID: PMC6447735
- DOI: 10.1016/j.nicl.2019.101800
Effect of age, ethnicity, sex, cognitive status and APOE genotype on amyloid load and the threshold for amyloid positivity
Abstract
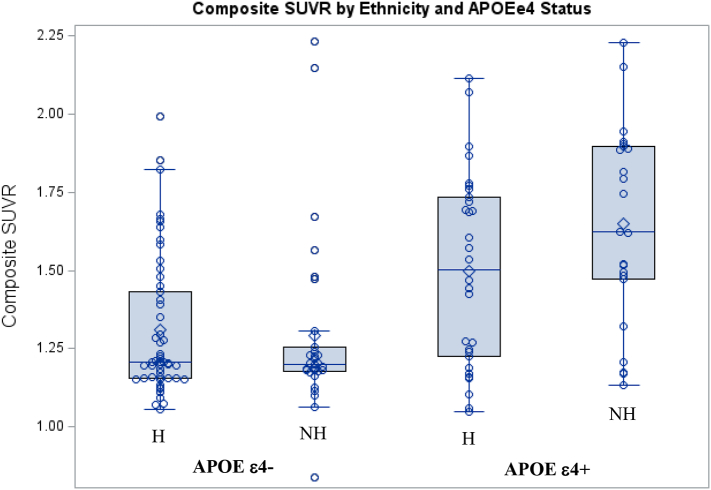
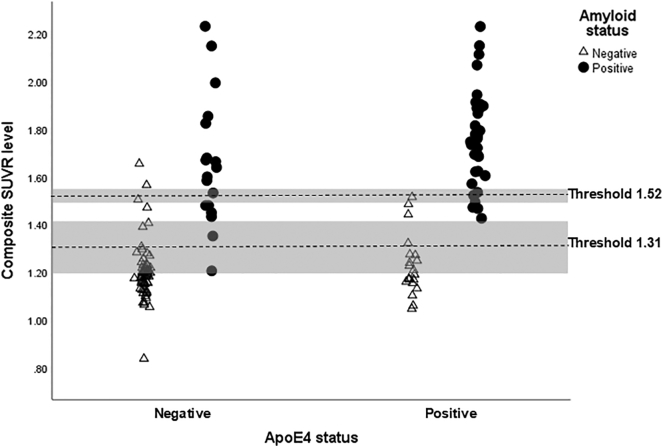
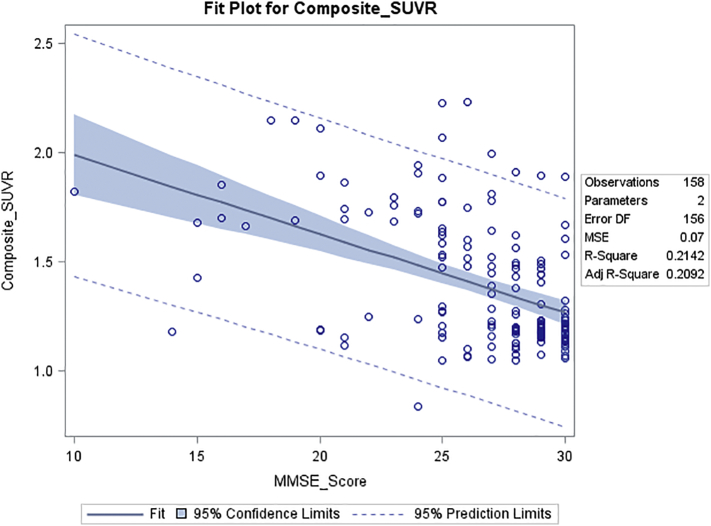
The threshold for amyloid positivity by visual assessment on PET has been validated by comparison to amyloid load measured histopathologically and biochemically at post mortem. As such, it is now feasible to use qualitative visual assessment of amyloid positivity as an in-vivo gold standard to determine those factors which can modify the quantitative threshold for amyloid positivity. We calculated quantitative amyloid load, measured as Standardized Uptake Value Ratios (SUVRs) using [18-F]florbetaben PET scans, for 159 Hispanic and non-Hispanic participants, who had been classified clinically as Cognitively Normal (CN), Mild Cognitive Impairment (MCI) or Dementia (DEM). PET scans were visually rated as amyloid positive (A+) or negative (A-), and these judgments were used as the gold standard with which to determine (using ROC analyses) the SUVR threshold for amyloid positivity considering factors such as age, ethnicity (Hispanic versus non-Hispanic), gender, cognitive status, and apolipoprotein E ε4 carrier status. Visually rated scans were A+ for 11% of CN, 39.0% of MCI and 70% of DEM participants. The optimal SUVR threshold for A+ among all participants was 1.42 (sensitivity = 94%; specificity = 92.5%), but this quantitative threshold was higher among E4 carriers (SUVR = 1.52) than non-carriers (SUVR = 1.31). While mean SUVRs did not differ between Hispanic and non-Hispanic participants;, a statistically significant interaction term indicated that the effect of E4 carrier status on amyloid load was greater among non-Hispanics than Hispanics. Visual assessment, as the gold standard for A+, facilitates determination of the effects of various factors on quantitative thresholds for amyloid positivity. A continuous relationship was found between amyloid load and global cognitive scores, suggesting that any calculated threshold for the whole group, or a subgroup, is artefactual and that the lowest calculated threshold may be optimal for the purposes of early diagnosis and intervention.
Keywords: APOE; Amyloid; Cognition; Hispanic; SUVR; Threshold.
Copyright © 2019 The Authors. Published by Elsevier Inc. All rights reserved.
Figures
Similar articles
-
Independent and Interactive Influences of the APOE Genotype and Beta-Amyloid Burden on Cognitive Function in Mild Cognitive Impairment.J Korean Med Sci. 2016 Feb;31(2):286-95. doi: 10.3346/jkms.2016.31.2.286. Epub 2016 Jan 13. J Korean Med Sci. 2016. PMID: 26839485 Free PMC article.
-
Cortical Amyloid Burden Differences Across Empirically-Derived Mild Cognitive Impairment Subtypes and Interaction with APOE ɛ4 Genotype.J Alzheimers Dis. 2016 Mar 29;52(3):849-61. doi: 10.3233/JAD-150900. J Alzheimers Dis. 2016. PMID: 27031472 Free PMC article.
-
Using positron emission tomography and florbetapir F18 to image cortical amyloid in patients with mild cognitive impairment or dementia due to Alzheimer disease.Arch Neurol. 2011 Nov;68(11):1404-11. doi: 10.1001/archneurol.2011.150. Epub 2011 Jul 11. Arch Neurol. 2011. PMID: 21747008
-
Amyloid and APOE Status of Screened Subjects in the Elenbecestat MissionAD Phase 3 Program.J Prev Alzheimers Dis. 2021;8(2):218-223. doi: 10.14283/jpad.2021.4. J Prev Alzheimers Dis. 2021. PMID: 33569570
-
Apolipoprotein E genotype and in vivo amyloid burden in middle-aged Hispanics.Neurology. 2020 Oct 13;95(15):e2086-e2094. doi: 10.1212/WNL.0000000000010707. Epub 2020 Aug 26. Neurology. 2020. PMID: 32847955 Free PMC article.
Cited by
-
Different aspects of failing to recover from proactive semantic interference predicts rate of progression from amnestic mild cognitive impairment to dementia.Front Aging Neurosci. 2024 Jan 31;16:1336008. doi: 10.3389/fnagi.2024.1336008. eCollection 2024. Front Aging Neurosci. 2024. PMID: 38357533 Free PMC article.
-
APOE genotype, hippocampus, and cognitive markers of Alzheimer's disease in American Indians: Data from the Strong Heart Study.Alzheimers Dement. 2022 Dec;18(12):2518-2526. doi: 10.1002/alz.12573. Epub 2022 Feb 10. Alzheimers Dement. 2022. PMID: 35142437 Free PMC article.
-
Clinical utility of plasma Aβ42/40 ratio by LC-MS/MS in Alzheimer's disease assessment.Front Neurol. 2024 Mar 25;15:1364658. doi: 10.3389/fneur.2024.1364658. eCollection 2024. Front Neurol. 2024. PMID: 38595851 Free PMC article.
-
Utility of Plasma Neurofilament Light in the 1Florida Alzheimer's Disease Research Center (ADRC).J Alzheimers Dis. 2021;79(1):59-70. doi: 10.3233/JAD-200901. J Alzheimers Dis. 2021. PMID: 33216030 Free PMC article.
-
Introducing a gatekeeping system for amyloid status assessment in mild cognitive impairment.Eur J Nucl Med Mol Imaging. 2022 Nov;49(13):4478-4489. doi: 10.1007/s00259-022-05879-6. Epub 2022 Jul 14. Eur J Nucl Med Mol Imaging. 2022. PMID: 35831715 Free PMC article.
References
-
- Acevedo A., Krueger K.R., Navarro E., Ortiz F., Manly J.J., Padilla-Vélez M.M., Weintraub S., López O.L., Mungas D. The Spanish translation and adaptation of the uniform data set of the National Institute on Aging Alzheimer's Disease Centers. Alzheimer Dis. Assoc. Disord. 2009;23(2):102. - PMC - PubMed
-
- Alzheimer's Association 2018 Alzheimer's disease facts and figures. Alzheimers Dement. 2018;14(3):367–429.
-
- Arango-Lasprilla J.C., Rivera D., Garza M.T., Saracho C.P., Rodriguez W., Rodríguez-Agudelo Y., Aguayo A., Schebela S., Luna M., Longoni M., Martínez C. Hopkins verbal learning test–revised: normative data for the Latin American Spanish speaking adult population. NeuroRehabilitation. 2015;37(4):699–718. - PubMed
-
- Beekly D.L., Ramos E.M., van Belle G. The National Alzheimer's Coordinating Center (NACC) database: an Alzheimer disease database. Alzheimer Dis. Assoc. Disord. 2004;18(4):270–277. - PubMed
Publication types
MeSH terms
Substances
Grants and funding
LinkOut - more resources
Full Text Sources
Other Literature Sources
Medical
Research Materials
Miscellaneous
