. 2019 Apr 15;11(4):541.
doi: 10.3390/cancers11040541.

Low CD8⁺ T Cell Infiltration and High PD-L1 Expression Are Associated with Level of CD44⁺/CD133⁺ Cancer Stem Cells and Predict an Unfavorable Prognosis in Pancreatic Cancer

Affiliations

Low CD8⁺ T Cell Infiltration and High PD-L1 Expression Are Associated with Level of CD44⁺/CD133⁺ Cancer Stem Cells and Predict an Unfavorable Prognosis in Pancreatic Cancer

Ya-Chin Hou et al. Cancers (Basel). .

Abstract

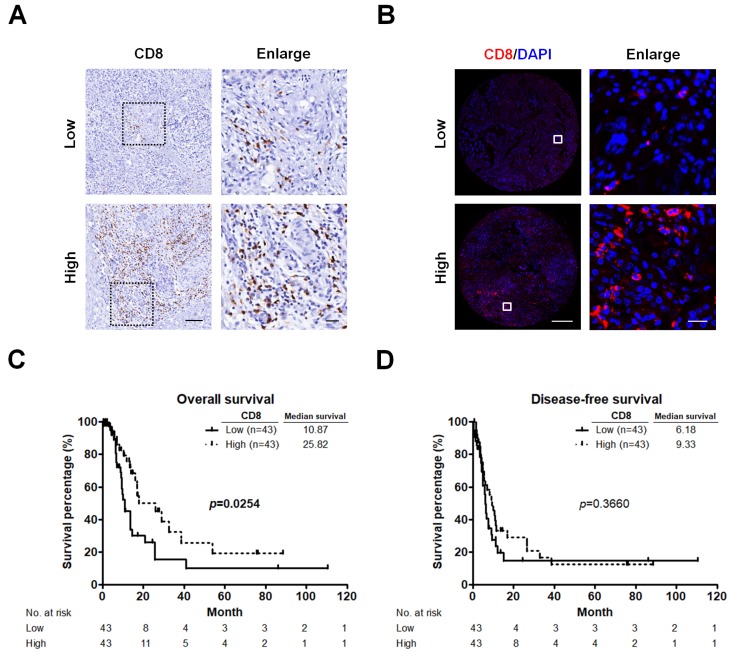
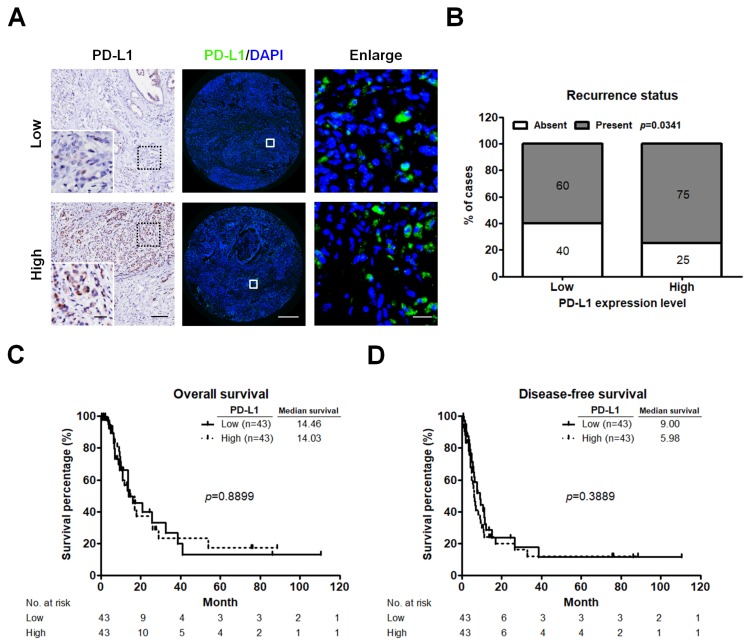
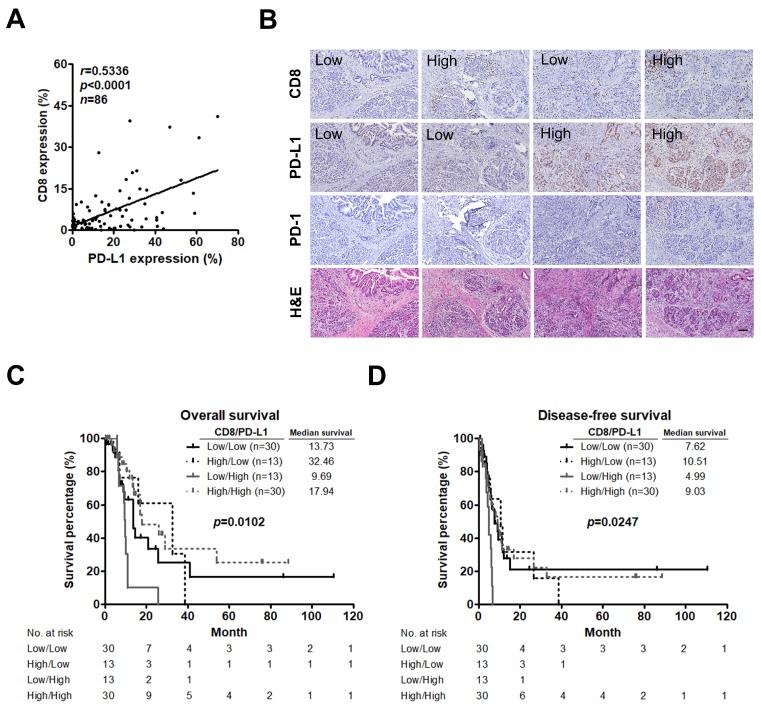
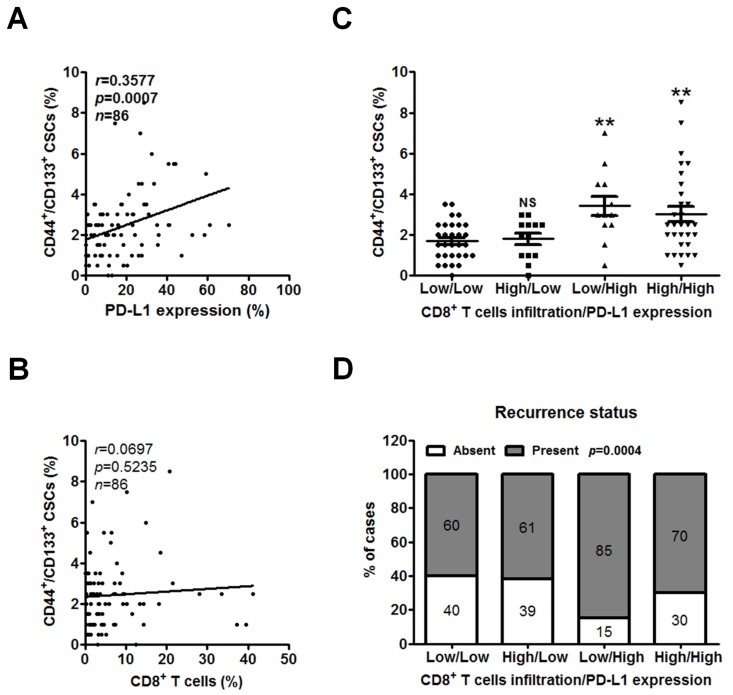
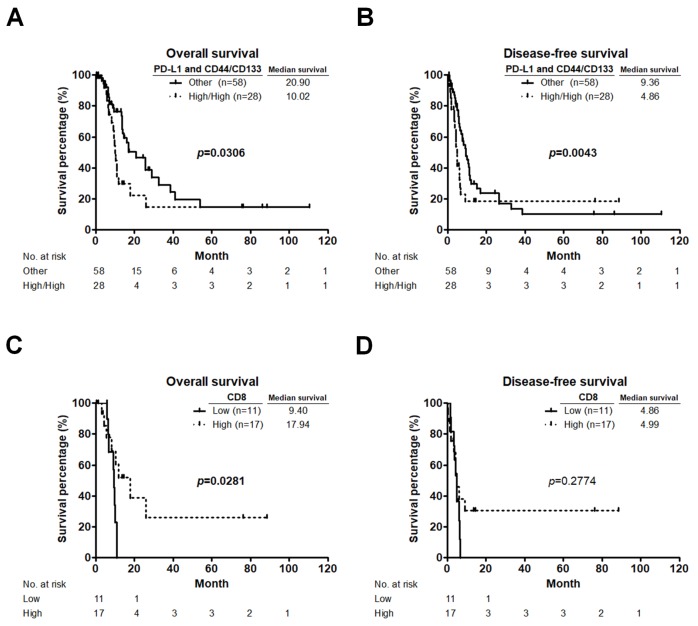
Cancer immunotherapy targeting immune checkpoints has exhibited promising clinical outcomes in many cancers, but it offers only limited benefits for pancreatic cancer (PC). Cancer stem cells (CSCs), a minor subpopulation of cancer cells, play important roles in tumor initiation, progression, and drug resistance. Accumulating evidence suggests that CSCs employ immunosuppressive effects to evade immune system recognition. However, the clinical implications of the associations among CD8⁺ T cells infiltration, programmed death receptor ligand-1 (PD-L1) expression, and CSCs existence are poorly understood in PC. Immunostaining and quantitative analysis were performed to assess CD8⁺ T cells infiltration, PD-L1 expression, and their relationship with CD44⁺/CD133⁺ CSCs and disease progression in PC. CD8⁺ T cells infiltration was associated with better survival while PD-L1 expression was correlated with PC recurrence. Both the low CD8⁺ T cells infiltration/high PD-L1 expression group and the high CD8⁺ T cells infiltration/high PD-L1 expression group show high levels of CD44⁺/CD133⁺ CSCs, but patients with low CD8⁺ T cells infiltration/high PD-L1 expression had worse survival and higher recurrence risk than those with high CD8⁺ T cells infiltration/high PD-L1 expression. Moreover, high infiltration of CD8⁺ T cells could reduce unfavorable prognostic effect of high co-expression of PD-L1 and CD44/CD133. Our study highlights an interaction among CD8⁺ T cells infiltration, PD-L1 expression, and CD44⁺/CD133⁺ CSCs existence, which contributes to PC progression and immune evasion.

Keywords: CD133; CD44; CD8; PD-L1; T cells; cancer stem cells; immunotherapy; pancreatic cancer.


Conflict of interest statement

The authors declare no conflict of interest.

Figures

Figure 1
Figure 1
CD8+ T cells significantly correlate with survival. (A) Representative pictures for low and high CD8 immunostaining (brown) in PC tumors. Original magnification, 20×; scale bars, 100 μm. Enlarged images on the right panel are shown for the areas outlined by black squares. Scale bars show 25 μm in length. (B) Representative images showing TMA cores from two different PC tumors after IF analysis of CD8 (red) and nuclear (4′,6-diamidino-2-phenylindole, DAPI; bule) staining. Original magnification, 20×; scale bars, 400 μm. Enlarged images on the right panel are shown for the areas outlined by white squares. Scale bars show 20 μm in length. (C,D) Kaplan-Meier survival curves showing comparison of OS (C) and DFS (D) between low and high infiltration of CD8+ T cells. p values determined using the log-rank test. OS, overall survival; DFS, disease-free survival.
Figure 2
Figure 2
PD-L1 expression associates with patients’ recurrence status. (A) IHC and IF images displaying low and high level of PD-L1 staining in PC tumors. IHC staining (left panel) of PD-L1 is shown as brown colored sections. Original magnification, 20×; scale bars, 100 μm. Enlarged images on the left lower panel are shown for the areas outlined by black squares. Scale bars show 25 μm in length. IF staining (middle panel) of PD-L1 in TMA cores from two different PC tumors. Green indicates PD-L1 staining. The nuclei were stained by 4′,6-diamidino-2-phenylindole (DAPI, bule). Enlarged images on the right panel are shown for the areas outlined by white squares in middle panel. Scale bars show 20 μm in length. (B) Relative distribution analysis of PC patients’ recurrence status within low (n = 43) or high PD-L1 expression group (n = 43). Absent, patients without recurrent PC; present, patients with recurrent PC. p values calculated using Chi-square test. (C,D) Survival analysis of PC patients stratified by PD-L1 expression level using the Kaplan-Meier estimator to determine the OS (C) and DFS (D). p values determined using the log-rank test. OS, overall survival; DFS, disease-free survival.
Figure 3
Figure 3
Low CD8+ T cell infiltration and high PD-L1 expression significantly stratifies patient survival. (A) Correlation analysis between percent CD8+ T cells and PD-L1 expression per patient. Pearson correlation coefficient (r) and significance level (p value) is shown for correlation. (B) IHC staining of CD8+ T cells infiltration (upper panel), PD-L1 expression (second panel), PD-1 expression (third panel), and H&E staining (lower panel) in the same tumor tissues. Original magnification, 20×; scale bars, 100 μm. (C,D) Kaplan-Meier curves for OS (C) and DFS (D) of patients stratified based on CD8+ T cells infiltration and PD-L1 expression. P values determined using the log-rank test. OS, overall survival; DFS, disease-free survival.
Figure 4
Figure 4
Low CD8+ T cell infiltration and high PD-L1 expression are associated with CSCs and related to the recurrence of PC. (A,B) The PC TMAs were double IF stained for CSC markers CD44 and CD133 and further assessed by quantitative analysis. Correlation of percent CD44+/CD133+ CSCs with PD-L1 expression (A) or percent CD8+ T cells (B) per patient was analyzed by Pearson’s correlation. (C,D) Classification of tumors based on CD8+ T cells infiltration and PD-L1 expression into 4 groups including low CD8+ T cells infiltration/low PD-L1 expression (n = 30), high CD8+ T cells infiltration/low PD-L1 expression (n = 13), low CD8+ T cells infiltration/high PD-L1 expression (n = 13), and high CD8+ T cells infiltration/high PD-L1 expression (n = 30). (C) Dot plots showing the percentage of CD44+/CD133+ CSCs in each group. All values are the mean ± s.e.m. NS, not significant; **, p < 0.01 compared with low CD8+ T cells infiltration/low PD-L1 expression group, as determined using one-way ANOVA. (D) Relative distribution analysis of PC patients’ recurrence status within each group. Absent, patients without recurrent PC; present, patients with recurrent PC. p values calculated using Chi-square test. CSCs, cancer stem cells.
Figure 5
Figure 5
CD8+ T cells infiltration affects the prognostic value of co-expression of PD-L1 and CD44/CD133 in PC patients. (A,B) OS (A) and DFS (B) curves for patients with high co-expression of PD-L1 and CD44/CD133 compared to those with either low co-expression of PD-L1 and CD44/CD133, low PD-L1 expression and high CD44/CD133 expression, or high PD-L1 expression and low CD44/CD133 expression (other group). p values determined using the Gehan-Breslow-Wilcoxon test. (C,D) OS (C) and DFS (D) curves for patients with low and high CD8+ T cells infiltration based on high co-expression of PD-L1 and CD44/CD133. p values determined using the log-rank test. OS, overall survival; DFS, disease-free survival.

References

    1. Oberstein P.E., Olive K.P. Pancreatic cancer: Why is it so hard to treat? Therap. Adv. Gastroenterol. 2013;6:321–337. doi: 10.1177/1756283X13478680. - DOI - PMC - PubMed
    1. Bray F., Ferlay J., Soerjomataram I., Siegel R.L., Torre L.A., Jemal A. Global cancer statistics 2018: GLOBOCAN estimates of incidence and mortality worldwide for 36 cancers in 185 countries. CA Cancer J. Clin. 2018;68:394–424. doi: 10.3322/caac.21492. - DOI - PubMed
    1. Rahib L., Smith B.D., Aizenberg R., Rosenzweig A.B., Fleshman J.M., Matrisian L.M. Projecting cancer incidence and deaths to 2030: The unexpected burden of thyroid, liver, and pancreas cancers in the United States. Cancer Res. 2014;74:2913–2921. doi: 10.1158/0008-5472.CAN-14-0155. - DOI - PubMed
    1. Ferlay J., Partensky C., Bray F. More deaths from pancreatic cancer than breast cancer in the EU by 2017. Acta Oncol. 2016;55:1158–1160. doi: 10.1080/0284186X.2016.1197419. - DOI - PubMed
    1. Vincent A., Herman J., Schulick R., Hruban R.H., Goggins M. Pancreatic cancer. Lancet. 2011;378:607–620. doi: 10.1016/S0140-6736(10)62307-0. - DOI - PMC - PubMed