

Metabopolis: scalable network layout for biological pathway diagrams in urban map style
- PMID: 30991966
- PMCID: PMC6466808
- DOI: 10.1186/s12859-019-2779-4
Metabopolis: scalable network layout for biological pathway diagrams in urban map style
Abstract
Background: Biological pathways represent chains of molecular interactions in biological systems that jointly form complex dynamic networks. The network structure changes from the significance of biological experiments and layout algorithms often sacrifice low-level details to maintain high-level information, which complicates the entire image to large biochemical systems such as human metabolic pathways.
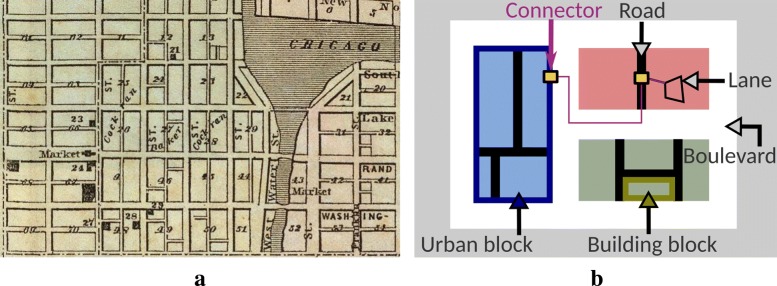
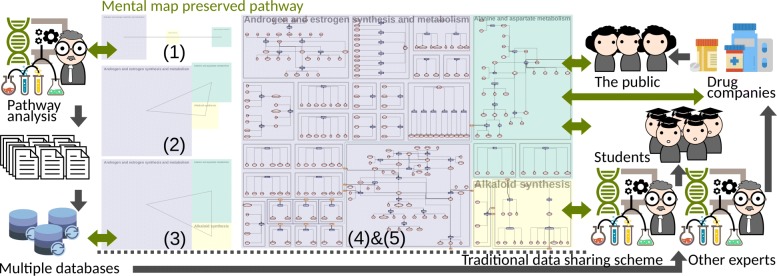
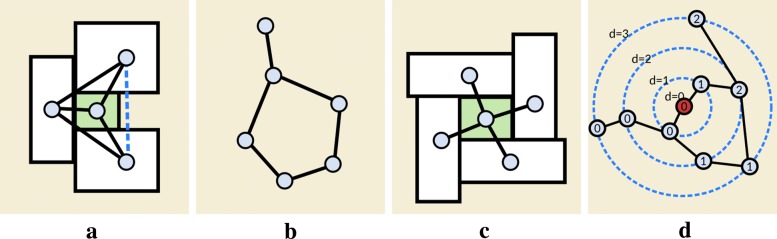
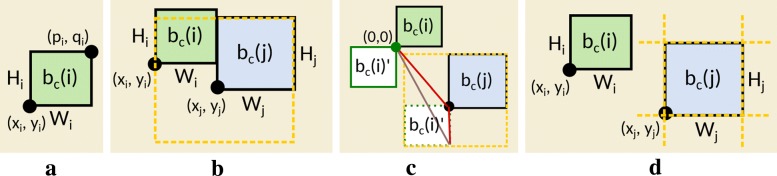
Results: Our work is inspired by concepts from urban planning since we create a visual hierarchy of biological pathways, which is analogous to city blocks and grid-like road networks in an urban area. We automatize the manual drawing process of biologists by first partitioning the map domain into multiple sub-blocks, and then building the corresponding pathways by routing edges schematically, to maintain the global and local context simultaneously. Our system incorporates constrained floor-planning and network-flow algorithms to optimize the layout of sub-blocks and to distribute the edge density along the map domain. We have developed the approach in close collaboration with domain experts and present their feedback on the pathway diagrams based on selected use cases.
Conclusions: We present a new approach for computing biological pathway maps that untangles visual clutter by decomposing large networks into semantic sub-networks and bundling long edges to create space for presenting relationships systematically.
Keywords: Biological pathways; Edge routing; Floor planning; Graph drawing; Map metaphor; Orthogonal layout.
Conflict of interest statement
Ethics approval and consent to participate
Not applicable.
Consent for publication
Not applicable.
Competing interests
The authors declare that they have no competing interests.
Publisher’s Note
Springer Nature remains neutral with regard to jurisdictional claims in published maps and institutional affiliations.
Figures


Similar articles
-
A generic algorithm for layout of biological networks.BMC Bioinformatics. 2009 Nov 12;10:375. doi: 10.1186/1471-2105-10-375. BMC Bioinformatics. 2009. PMID: 19909528 Free PMC article.
-
A new grid- and modularity-based layout algorithm for complex biological networks.PLoS One. 2019 Aug 29;14(8):e0221620. doi: 10.1371/journal.pone.0221620. eCollection 2019. PLoS One. 2019. PMID: 31465473 Free PMC article.
-
Fast grid layout algorithm for biological networks with sweep calculation.Bioinformatics. 2008 Jun 15;24(12):1433-41. doi: 10.1093/bioinformatics/btn196. Epub 2008 Apr 18. Bioinformatics. 2008. PMID: 18424458
-
Graph theoretic modeling of large-scale semantic networks.J Biomed Inform. 2006 Aug;39(4):451-64. doi: 10.1016/j.jbi.2005.10.007. Epub 2005 Dec 15. J Biomed Inform. 2006. PMID: 16442849 Review.
-
Biological Network Inference and analysis using SEBINI and CABIN.Methods Mol Biol. 2009;541:551-76. doi: 10.1007/978-1-59745-243-4_24. Methods Mol Biol. 2009. PMID: 19381531 Review.
Cited by
-
Software tools, databases and resources in metabolomics: updates from 2018 to 2019.Metabolomics. 2020 Mar 7;16(3):36. doi: 10.1007/s11306-020-01657-3. Metabolomics. 2020. PMID: 32146531 Review.
-
Effective data visualization strategies in untargeted metabolomics.Nat Prod Rep. 2025 Jun 18;42(6):982-1019. doi: 10.1039/d4np00039k. Nat Prod Rep. 2025. PMID: 39620439 Free PMC article. Review.
-
Towards a hybrid user interface for the visual exploration of large biomolecular networks using virtual reality.J Integr Bioinform. 2022 Oct 11;19(4):20220034. doi: 10.1515/jib-2022-0034. eCollection 2022 Dec 1. J Integr Bioinform. 2022. PMID: 36215728 Free PMC article.
References
MeSH terms
Grants and funding
LinkOut - more resources
Full Text Sources
Molecular Biology Databases
