

The impact of Medicare part D on income-related inequality in pharmaceutical expenditure
- PMID: 30992000
- PMCID: PMC6469203
- DOI: 10.1186/s12939-019-0955-9
The impact of Medicare part D on income-related inequality in pharmaceutical expenditure
Abstract
Background: Income-related inequality measures such as the concentration index are often used to describe the unequal distribution of health, health care access, or expenditure in a single measure. This study demonstrates the use of such measures to evaluate the distributional impact of changes in health insurance coverage. We use the example of Medicare Part D in the United States, which increased access to prescription medications for Medicare beneficiaries from 2006.
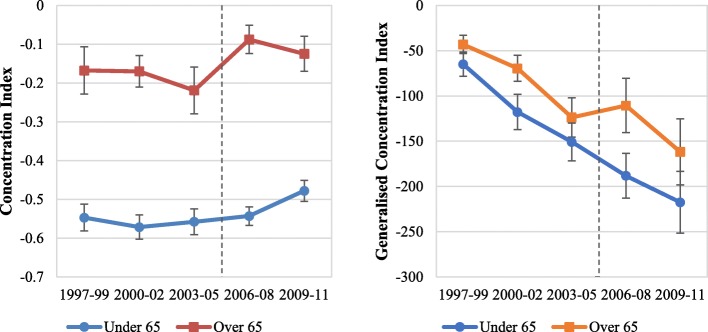
Methods: Using pooled cross-sectional samples from the Medical Expenditure Panel Survey for 1997-2011, we estimated income-related inequality in drug expenditures over time using the concentration and generalised concentration indices. A difference-in-differences analysis investigated the change in inequality in drug expenditures, as measured using the concentration index and generalised concentration index, between the elderly (over 65 years) and near-elderly (54-63 years) pre- and post-implementation of Medicare Part D.
Results: Medicare Part D increased public drug expenditure while out-of-pocket and private spending fell. Public drug expenditures favoured the poor during all study periods, but the degree of pro-poorness declined in the years immediately following the implementation of Part D, with the poor gaining less than the rich in both relative and absolute terms. Part D also appeared to result in a fall in the pro-richness of private insurance drug expenditure in absolute terms but have minimal distributional impact on out-of-pocket expenditure. These effects appeared to be short lived, with a return to the prevailing trends in both concentration and generalised concentration indices several years following the start of Part D.
Conclusions: The implementation of Medicare Part D significantly reduced the degree of pro-poorness in public drug expenditure. The poor gained less of the increased public drug expenditure than the rich in both relative and absolute terms. This study demonstrates how income-related inequality measures can be used to estimate the impact of health system changes on inequalities in health expenditure and provides a guide for future evaluations.
Keywords: Concentration index; Health insurance, prescription drugs; Inequality; Medicare part D.
Conflict of interest statement
Authors’ information
The findings and conclusions expressed in this paper are entirely those of the authors and should not be attributed to the institutions to which the authors are affiliated.
Ethics approval and consent to participate
This analysis used de-identified secondary data from the Medical Expenditures Panel Survey (MEPS), as such did not require additional ethics approval.
Consent for publication
Not applicable
Competing interests
The authors declare that they have no competing interests.
Publisher’s Note
Springer Nature remains neutral with regard to jurisdictional claims in published maps and institutional affiliations.
Figures


References
-
- Devaux M, M.d. Looper. Income-Related Inequalities in Health Service Utilisation in 19 OECD Countries, 2008–2009, in OECD health Working Papers. 2012, OECD Publishing.
-
- Van Doorslaer E, Masseria C. Income-related inequality in the use of medical care in 21 OECD countries. Paris: OECD; 2004.
-
- Leu RE, Schellhorn M. The evolution of income-related inequalities in health care utilization in switzerland over time, in IZA Discussion Paper Series. 2004, Institute for the Study of Labor.
Publication types
MeSH terms
Substances
Grants and funding
LinkOut - more resources
Full Text Sources
Medical
