. 2019 Apr 16;38(1):166.
doi: 10.1186/s13046-019-1139-6.

Exosomal transfer of long non-coding RNA SBF2-AS1 enhances chemoresistance to temozolomide in glioblastoma

Affiliations

Exosomal transfer of long non-coding RNA SBF2-AS1 enhances chemoresistance to temozolomide in glioblastoma

Zhuoran Zhang et al. J Exp Clin Cancer Res. .

Abstract

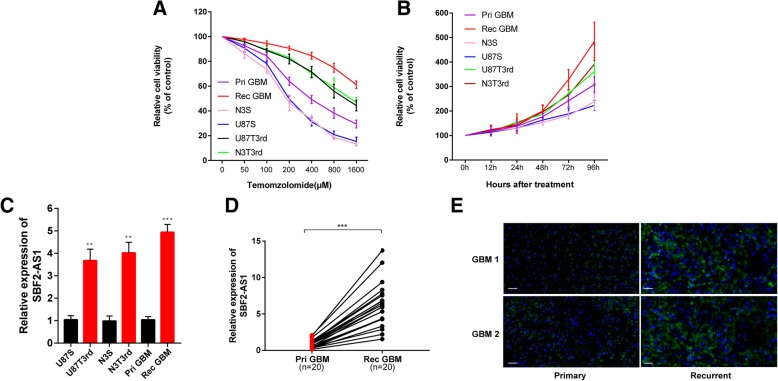
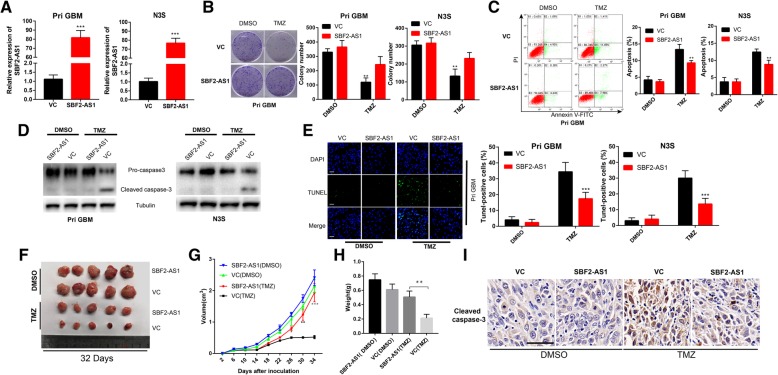
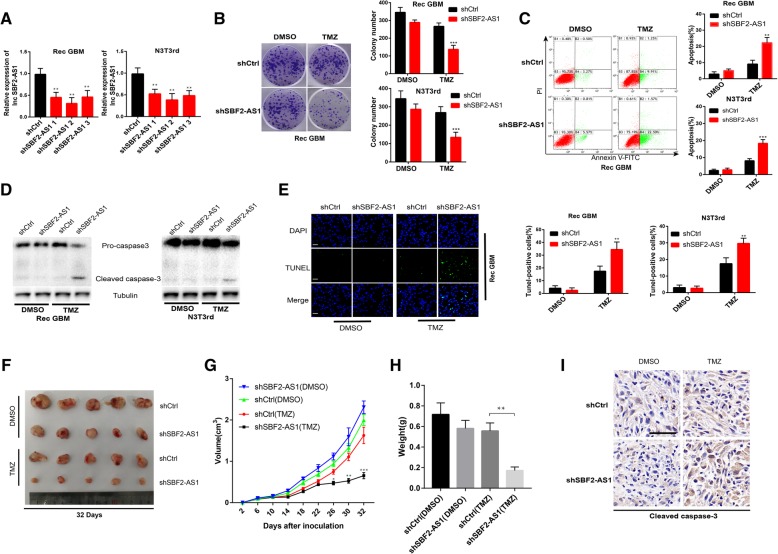
Background: Acquired drug resistance is a constraining factor in clinical treatment of glioblastoma (GBM). However, the mechanisms of chemoresponsive tumors acquire therapeutic resistance remain poorly understood. Here, we aim to investigate whether temozolomide (TMZ) resistance of chemoresponsive GBM was enhanced by long non-coding RNA SBF2 antisense RNA 1 (lncRNA SBF2-AS1) enriched exosomes.

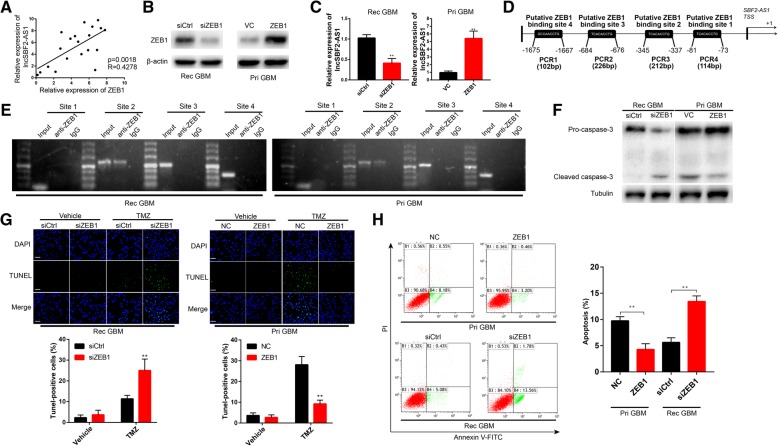
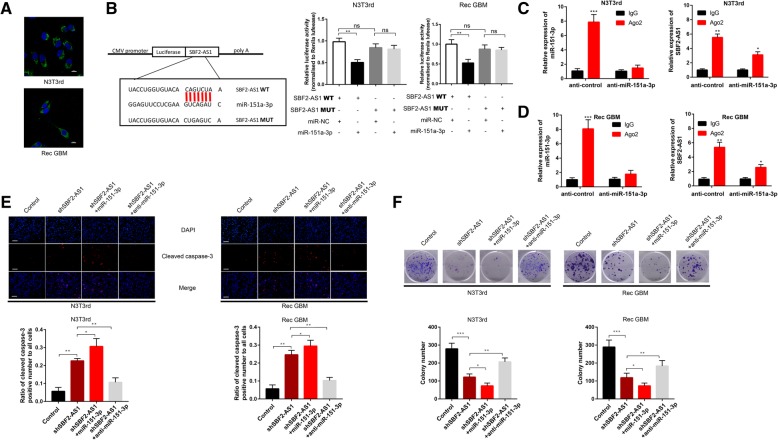
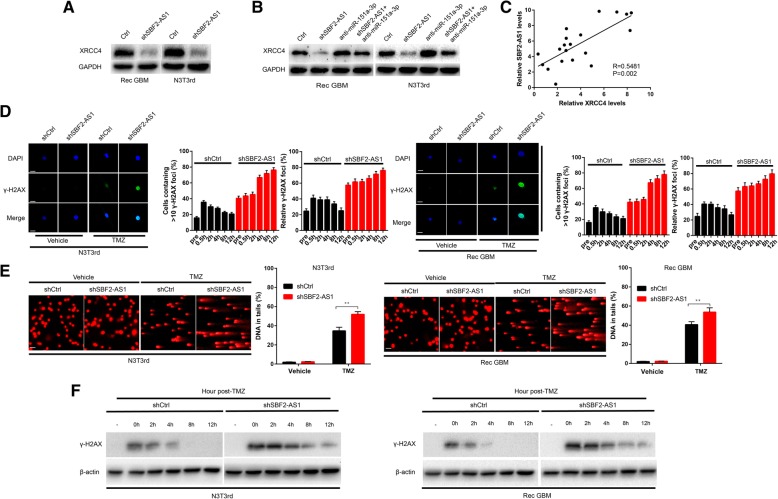
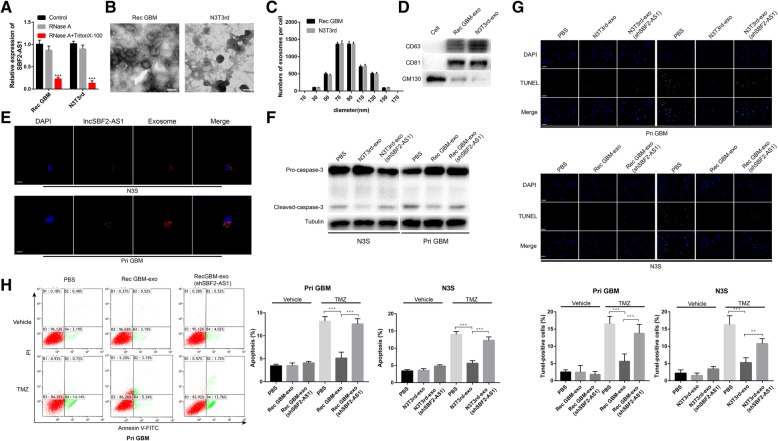
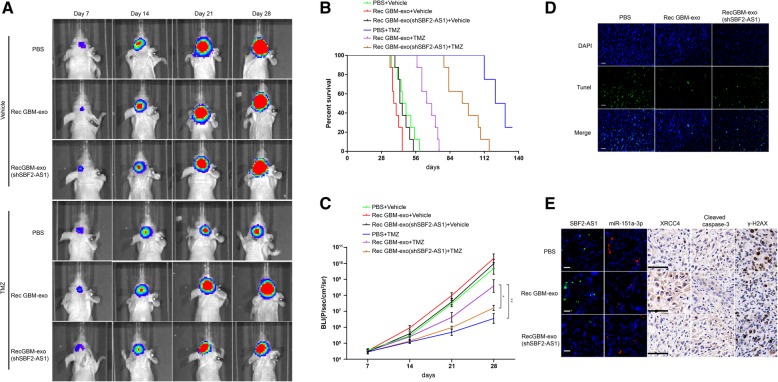
Method: LncSBF2-AS1 level in TMZ-resistance or TMZ-sensitive GBM tissues and cells were analyzed by qRT-PCR and FISH assays. A series of in vitro assay and xenograft tumor models were performed to observe the effect of lncSBF2-AS1 on TMZ-resistance in GBM. CHIP assay were used to investigate the correlation of SBF2-AS1 and transcription factor zinc finger E-box binding homeobox 1 (ZEB1). Dual-luciferase reporter, RNA immunoprecipitation (RIP), immunofluorescence and western blotting were performed to verify the relation between lncSBF2-AS1, miR-151a-3p and XRCC4. Comet assay and immunoblotting were performed to expound the effect of lncSBF2-AS1 on DNA double-stand break (DSB) repair. A series of in vitro assay and intracranial xenografts tumor model were used to determined the function of exosomal lncSBF2-AS1.

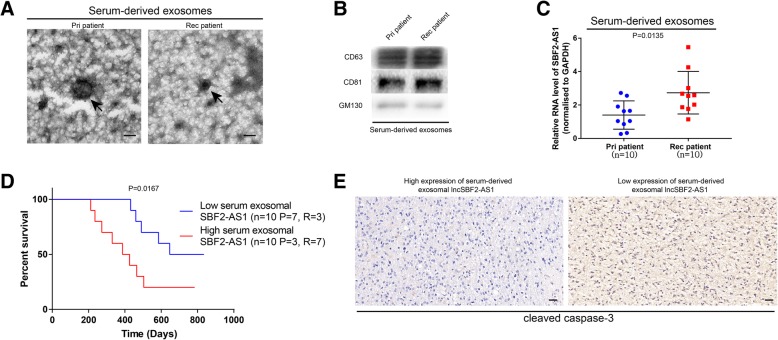
Result: It was found that SBF2-AS1 was upregulated in TMZ-resistant GBM cells and tissues, and overexpression of SBF2-AS1 led to the promotion of TMZ resistance, whereas its inhibition sensitized resistant GBM cells to TMZ. Transcription factor ZEB1 was found to directly bind to the SBF2-AS1 promoter region to regulate SBF2-AS1 level and affected TMZ resistance in GBM cells. SBF2-AS1 functions as a ceRNA for miR-151a-3p, leading to the disinhibition of its endogenous target, X-ray repair cross complementing 4 (XRCC4), which enhances DSB repair in GBM cells. Exosomes selected from temozolomide-resistant GBM cells had high levels of SBF2-AS1 and spread TMZ resistance to chemoresponsive GBM cells. Clinically, high levels of lncSBF2-AS1 in serum exosomes were associated with poor response to TMZ treatment in GBM patients.

Conclusion: We can conclude that GBM cells remodel the tumor microenvironment to promote tumor chemotherapy-resistance by secreting the oncogenic lncSBF2-AS1-enriched exosomes. Thus, exosomal lncSBF2-AS1 in human serum may serve as a possible diagnostic marker for therapy-refractory GBM.

Keywords: Exosomes; Glioblastoma; LncRNA-SBF2-AS1; Temozolomide-resistance.


Conflict of interest statement

Ethics approval and consent to participate

The study was approved by the Ethics Committee of Nanjing Medical University and written informed consent was obtained from all patients.

Consent for publication

We have obtained consents to publish this paper from all the participants.

Competing interests

The authors declare that they have no competing interest.

Publisher’s Note

Springer Nature remains neutral with regard to jurisdictional claims in published maps and institutional affiliations.

Figures

Fig. 1
Fig. 1
LncSBF2-AS1 is upregulated in GBM cell lines and tissues after TMZ treatment. a Cell proliferation of 6 GBM cells was evaluated in response to TMZ at different doses. CCk8 assay was performed after 48 h TMZ treatment. Pri GBM (IC50 = 423.33 μM), N3S (IC50 = 187.73 μM), U87S (IC50 = 197.64 μM), N3T3rd (IC50 = 1321.92 μM), U87T3rd (1143.09 μM). Data are presented as mean ± SEM. b Cell proliferation was eveluated in 6 GBM cells in 200 μM TMZ treatments using CCK8 assay. Data are presented as mean ± SEM. c Expression of LncSBF2-AS1 analyzed by qRT-PCR in TMZ resistant cells and TMZ sensitive cells. The data represents the mean ± SEM from three independent experiments. **P < 0.01, ***P < 0.001 (d) Analysis of LncSBF2-AS1 expression by qRT-PCR in 20 primary GBM tissues and 20 recurrent GBM tissues. Data represents means of three independent experiments ± SEM. ***P < 0.001 (e) FISH analysis of LncSBF2-AS1 expression in recurrent tumor tissues compared to primary tumor tissues. Scale bar, 50 μm
Fig. 2
Fig. 2
LncSBF2-AS1 overexpression confers TMZ resistance. a LncSBF2-AS1 transfected Pri GBM and N3S cells and elevated SBF2-AS1 expression. The data represents the mean ± SEM from three independent experiments. ***P < 0.001. b Colony formation ability of SBF2-AS1 overexpressing TMZ-sensitive cells or vector control cells in the absence or presence of TMZ. Data represents mean of three independent experiments ± SEM. ***P < 0.001. c Flow cytometry was used to measure the apoptosis of TMZ-sensitive SBF2-AS1 overexpression cells or vector control cells after exposure to 200 μM TMZ for 48 h. Data represents means of three independent experiments ± SEM. ***P < 0.001. d Western blot analysis of cleaved caspase-3 expression of TMZ-sensitive cells overexpressing SBF2-AS1 or vector control cells in the absence or presence of TMZ. Tubulin was used as the loading control. e TUNEL analysis of TMZ-sensitive cells overexpressing SBF2-AS1 or vector control cells in the absence or presence of TMZ for 48 h. Data represents means of three independent experiments ± SEM. ***P < 0.001. Scale bar, 50 μm. f Representative images of Pri GBM cells overexpressing SBF2-AS1 or vector control cells-derived subcutaneous tumors on 42nd day in the absence or presence of TMZ. g Growth curve of tumor xenografts originated from SBF2-AS1-overexpressing Pri GBM cells or vector control cells in the absence or presence of TMZ. Data represents means of three independent experiments ± SEM.*P < 0.05, **P < 0.01, ***P < 0.001. h Weight of tumor xenografts originated from SBF2-AS1-overexpressing Pri GBM cells or vector control cells in the absence or presence of TMZ. Data represents means of three independent experiments ± SEM. **P < 0.01. i IHC analysis of cleaved caspase-3 in SBF2-AS1-overexpressing Pri GBM cells or vector control cells-derived subcutaneous tumors in the absence or presence of TMZ. Scale bar, 50 μm
Fig. 3
Fig. 3
Inhibiting endogenous lncSBF2-AS1 in recurrent GBM cells promotes TMZ-induced cell apoptosis (a) SBF2-AS1 knockdown lentivirus transfected Rec GBM and N3T3rd cells showing reduced SBF2-AS1 expression. Data represents means of three independent experiments ± SEM. ***P < 0.001. b Colony formation ability of SBF2-AS1 knockdown cells or vector control cells in the absence or presence of TMZ. Data represents means of three independent experiments ± SEM. ***P < 0.001. c Flow cytometry was used to measure the apoptosis of SBF2-AS1 knockdown cells or vector control cells after exposure to 200 μM TMZ for 48 h. Data represents means of three independent experiments ± SEM. ***P < 0.001. d Western blot test of cleaved caspase-3 expression of SBF2-AS1 knockdown cells or vector control cells in the absence or presence of TMZ. Tubulin was used as the loading control. e TUNEL analysis of SBF2-AS1 knockdown cells or vector control cells in the absence or presence of TMZ for 48 h. Data represents means of three independent experiments ± SEM. ***P < 0.001. Scale bar, 50 μm. f Representative images of Rec GBM SBF2-AS1-knockdown or shctrl cells-derived subcutaneous tumors on 34th day in the absence or presence of TMZ. g Growth curve of tumor xenografts originated from Rec GBM SBF2-AS1-knockdown or shctrl cells in the absence or presence of TMZ. Data represents means of three independent experiments ± SEM. *P < 0.05, ***P < 0.001. h Tumor weight of tumor xenografts originated from Rec GBM SBF2-AS1-knockdown or shctrl cells in the absence or presence of TMZ. Data represents means of three independent experiments ± SEM. **P < 0.01. i IHC analysis of cleaved caspase-3 in Rec GBM SBF2-AS1-knockdown or shctrl cells-derived subcutaneous tumors in the absence or presence of TMZ. Scale bar, 50 μm
Fig. 4
Fig. 4
Endogenous ZEB1 regulated SBF2-AS1 at transcriptional level. a Each individual ZEB1 and SBF2-AS1 expression was analyzed by linear regression analysis. b ZEB1 expression in recurrent ZEB1-knockdown Rec GBM cells and ZEB1-overexpressed Pri GBM cells were analyzed by Western blot assay. β-actin was used as the loading control. c SBF2-AS1 expression in Rec GBM cells and Pri GBM cells were analyzed by qRT-PCR. Data represents means of three independent experiments ± SEM. **P < 0.01. d Schematic diagram showing the human SBF2-AS1 promoter region. e CHIP assay was performed to explore the relative enrichment of ZEB1 on promoter region of lncSBF2-AS1. This figure shows the results. f Western blot analysis of cleaved caspase-3 expression of ZEB1-overexpressed Pri GBM cells or ZEB1-knockdown GBM cells in the absence or presence of TMZ. Tubulin was used as the loading control. g TUNEL analysis of ZEB1-overexpressed Pri GBM cells or ZEB1-knockdown GBM cells in the absence or presence of TMZ for 48 h. Data represents means of three independent experiments ± SEM. **P < 0.01. Scale bar, 50 μm. h Flow cytometry was used to measure the apoptosis of ZEB1-overexpressed Pri GBM cells or ZEB1-knockdown GBM cells after exposure to 200 μM TMZ for 48 h. Data represents means of three independent experiments ± SEM. ***P < 0.001
Fig. 5
Fig. 5
Regulatory relationship between lncSBF2-AS1 and miR-151a-3p (a) FISH analysis of the location of lncSBF2-AS1 in the cytoplasm (green) and nucleus (blue) of N3T3rd and Rec GBM cells. b Left: Schematic representation of the miR-151a-3p binding sites in lncRNA SBF2-AS1 and the site mutagenesis. Right: The luciferase reporter plasmid carrying wild type (WT) or mutant (MUT) lncSBF2-AS1 was co-transfected into N3T3rd and Rec GBM cells with miR-151a-3p in parallel with an empty vector. Relative luciferase activity in N3T3rd and Rec GBM cells were determined. Data represents means of three independent experiments ± SEM. **P < 0.01. c and d. RIP assay was established with normal mouse IgG or anti-Ago2 in N3T3rd or Rec GBM cells. Relative expression of SBF2-AS1 and miR-151a-3p were determined by qRT-PCR. Data represents means of three independent experiments ± SEM. **P < 0.01, ***P < 0.001. e. Immunofluorescent staining of cleaved caspase-3 in N3T3rd and Rec GBM cells transfected with SBF2-AS1 plasmid, miR-151a-3p mimics + SBF2-AS1 plasmid or miR-151a-3p inhibitor + SBF2-AS1 plasmid after 200 μM TMZ treatment for 48 h. Data represents means of three independent experiments ± SEM. **P < 0.01. Scale bar, 50 μm. f Colony formation ability of N3T3rd and Rec GBM cells transfected with SBF2-AS1 plasmid, miR-151a-3p mimics + SBF2-AS1 plasmid or miR-151a-3p inhibitor + SBF2-AS1 plasmid after 200 μM TMZ treatment for 48 h. Data represents means of three independent experiments ± SEM. *P < 0.05, **P < 0.01. Flow cytometry of N3T3rd and Rec GBM cells transfected with SBF2-AS1 plasmid, miR-151a-3p mimics + SBF2-AS1 plasmid or miR-151a-3p inhibitor + SBF2-AS1 plasmid after 200 μM TMZ treatment for 48 h. Data represents means of three independent experiments ± SEM. *P < 0.05, **P < 0.01
Fig. 6
Fig. 6
XRCC4 is indirectly regulated by lncSBF2-AS1, and SBF2-AS1 depletion induces a delay in DNA damage repair. a XRCC4 protein level in N3T3rd and Rec GBM cells following knockdown of lncSBF2-AS1. GAPDH was used as the loading control. b XRCC4 protein level in N3T3rd and Rec GBM cells following knockdown of lncSBF2-AS1 and/or inhibition of miR-151a-3p. GAPDH was used as the loading control. c Association analysis of the relationship between lncSBF2-AS1 and XRCC4 expression levels in 20 recurrent GBM tissues. d Immunofluorescence staining of γ-H2AX foci in shSBF2-AS1 or shctrl Rec GBM and N3T3rd cells 8 h after TMZ removal. Data represents means of three independent experiments ± SEM. **P < 0.01. Scale bar, 10 μm. e Comet assay of Rec GBM and N3T3rd cells transduced with shSBF2-AS1 or shctrl at the indicated time after TMZ withdrawal. Scale bar, 50 μm. f Western blot analysis of γ-H2AX expression in Rec GBM and N3T3rd cells transfected with shSBF2-AS1 or shctrl at different time points after TMZ treatment. β-actin was used as the loading control
Fig. 7
Fig. 7
Exosomal transfer of lncSBF2-AS1 from chemoresistant cells to chemoresponsive cells and spread of TMZ resistance (a) The expression level of lncSBF2-AS1 in the culture medium of Rec GBM and N3T3rd cells treated with RNase (2 μg/ml) alone or combined with 0.1% Triton X-100 for 20 min. b Representative transmission electron microscopy (TEM) of exosomes secreted by TMZ-resistant cells. Scale bar, 100 nm. c The size distributions of exosomes derived from TMZ-resistant cells was analyzed by nanoparticle tracking assay. d Western blot analysis for exosomal marker CD63, CD81, and GM130 of exosomes derived from TMZ-resistant cells. Equal amount of these exosomes (500 ng) were used for Western blot analysis. e Exosomes were isolated from culture medium from Rec GBM and N3T3rd co-transfected with FAM-labelled SBF2-AS1 (green) and exosomal marker CD63 (red) and added to Pri GBM or N3S cell cultures. Confocal microscope was used to detect fluorescence signal in Pri GBM or N3S cells. Scale bar, 10 μm. f Western blot analysis of cleaved caspase-3 expression of exosome-treated chemoresponsive cells or untreated GBM cells in the presence of TMZ. Tubulin was used as the loading control. g TUNEL analysis of chemoresponsive GBM cells treated with TMZ-resistant exosomes in the presence of TMZ for 48 h. Data represents means of three independent experiments ± SEM. **P < 0.01, ***P < 0.001. Scale bar, 50 μm (h) Flow cytometry was used to measure the apoptosis of chemoresponsive GBM cells in the absence or presence of exosomes after exposure to 200 μM TMZ for 48 h. Data represents means of three independent experiments ± SEM. ***P < 0.001 (Rec GBM-exo: exosomes isolated from recurrent GBM cells; N3T3rd-exo: exosomes isolated from N3T3rd cells; Rec GBM-exo (shSBF2-AS1): exosomes isolated from shSBF2-AS1 recurrent GBM cells; N3T3rd-exo (shSBF2-AS1): exosomes isolated from shSBF2-AS1 N3T3rd cells)
Fig. 8
Fig. 8
Exosomal transfer of lncSBF2-AS1 enhances chemoresistance to TMZ in vivo. a Representative bioluminescence images of intracranial xenografts derived from Pri GBM, which were pre-incubated with PBS or 50 μg/ml Rec GBM-exo or Rec GBM-exo (shSBF2-AS1) for 2 days. b Survival curves of nude mice derived from Pri GBM cells indicated above in the absence or presence of TMZ. c Bioluminescence was measured in tumors from six groups. Data represents means of three independent experiments ± SEM. *P < 0.05, **P < 0.01. d TUNEL staining of intracranial xenografts derived from Pri GBM cells indicated above in response to TMZ. Scale bar, 50 μm (e) The expression of lncSBF2-AS1, miR-151a-3p, XRCC4, γ-H2AX, and cleaved caspase-3 were analyzed by FISH or IHC analysis on intracranial xenografts derived from Pri GBM cells indicated above in response to TMZ. Scale bar, 50 μm (left, FISH) and 50 μm (right, IHC)
Fig. 9
Fig. 9
Expression of serum exosomal lncSBF2-AS1 is associated with TMZ resistance in GBM patients. a Representative transmission electron microscopy (TEM) of serum-derived exosomes from recurrent GBM patients and primary GBM patients. Scale bar, 100 nm. b Western blot assay for exosomal markers CD63, CD81 and GM130 of serum-derived exosomes from recurrent GBM patients and primary GBM patients. c qRT-PCR analysis of lncSBF2-AS1 expression in serum-derived exosomes from recurrent GBM patients and primary GBM patients. Data represents means of three independent experiments ± SEM. d Survival curves of 20 GBM patients who received TMZ treatment, with low (n = 10) and high (n = 10) serum exosomal lncSBF2-AS1 levels. The number of primary patients (P) and recurrent patients (R) per survival group were indicated. e Immunohistochemical staining of cleaved caspase-3 in GBM samples with high exosomal lncSBF2-AS1 levels or low exosomal lncSBF2-AS1 levels. Scale bar, 50 μm

Similar articles

Cited by

References

    1. Stupp R, Hegi M, Mason W, van den Bent M, Taphoorn M, Janzer R, et al. Effects of radiotherapy with concomitant and adjuvant temozolomide versus radiotherapy alone on survival in glioblastoma in a randomised phase III study: 5-year analysis of the EORTC-NCIC trial. Lancet Oncol. 2009;10(5):459–466. doi: 10.1016/S1470-2045(09)70025-7. - DOI - PubMed
    1. Cocucci E, Meldolesi J. Ectosomes and exosomes: shedding the confusion between extracellular vesicles. Trends Cell Biol. 2015;25(6):364–372. doi: 10.1016/j.tcb.2015.01.004. - DOI - PubMed
    1. D'Asti E, Garnier D, Lee T, Montermini L, Meehan B, Rak J. Oncogenic extracellular vesicles in brain tumor progression. Front Physiol. 2012;3:294. - PMC - PubMed
    1. Katsuda T, Kosaka N, Ochiya T. The roles of extracellular vesicles in cancer biology: toward the development of novel cancer biomarkers. Proteomics. 2014;14(4–5):412–425. doi: 10.1002/pmic.201300389. - DOI - PubMed
    1. Vader P, Breakefield X, Wood M. Extracellular vesicles: emerging targets for cancer therapy. Trends Mol Med. 2014;20(7):385–393. doi: 10.1016/j.molmed.2014.03.002. - DOI - PMC - PubMed

MeSH terms