. 2019 Apr 16;12(1):23.
doi: 10.1186/s13072-019-0267-8.

Tat inhibition by didehydro-Cortistatin A promotes heterochromatin formation at the HIV-1 long terminal repeat

Affiliations

Tat inhibition by didehydro-Cortistatin A promotes heterochromatin formation at the HIV-1 long terminal repeat

Chuan Li et al. Epigenetics Chromatin. .

Abstract

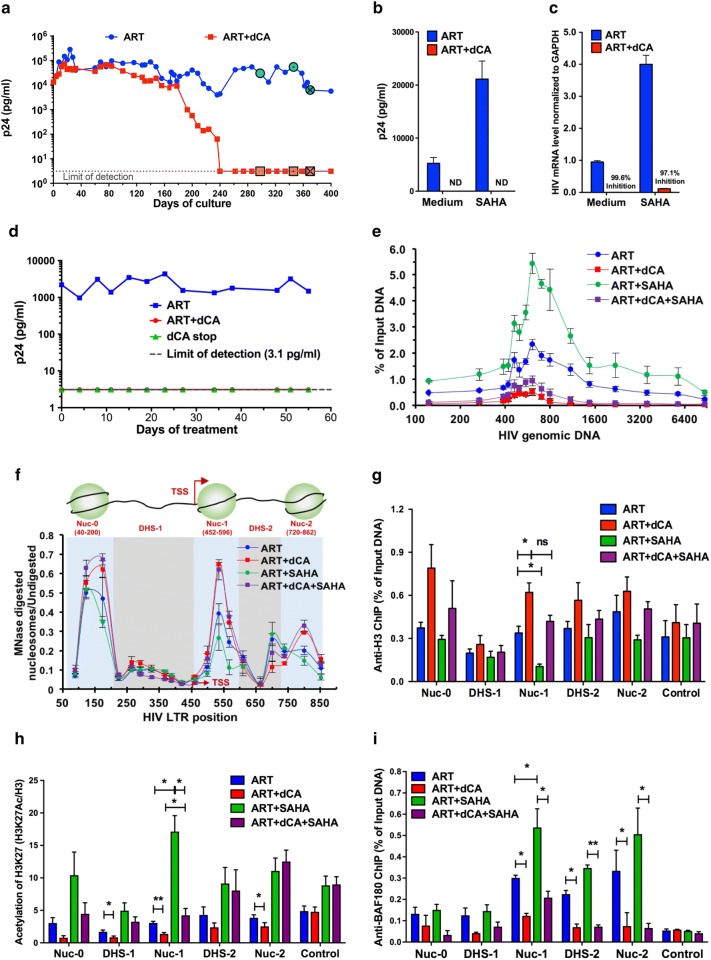
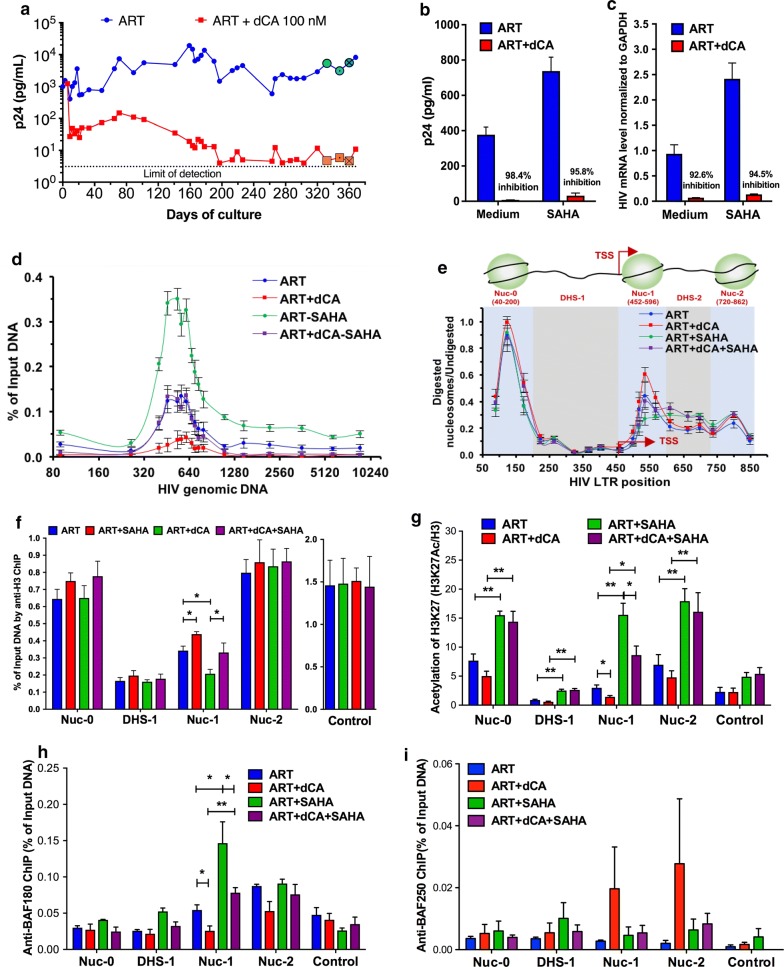
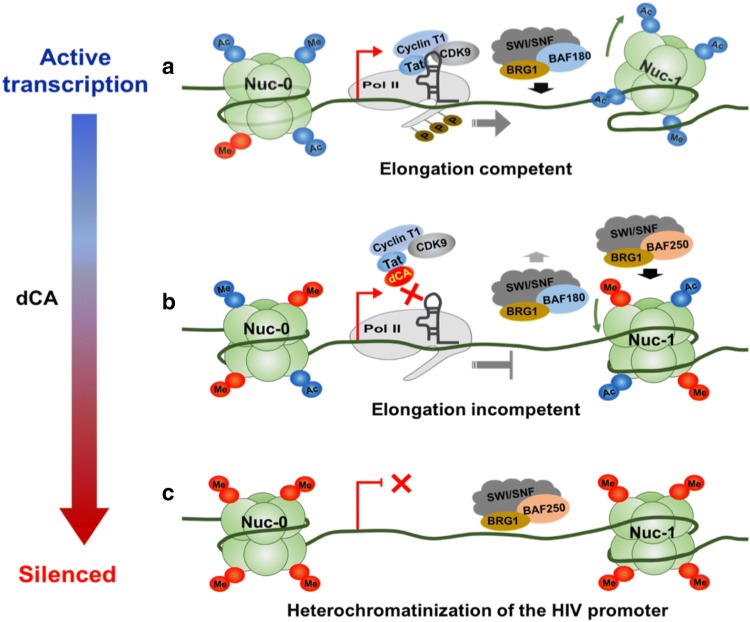
Background: Transcription from the integrated HIV-1 promoter is directly governed by its chromatin environment, and the nucleosome-1 downstream from the transcription start site directly impedes transcription from the HIV-1 promoter. The HIV-1 Tat protein regulates the passage from viral latency to active transcription by binding to the viral mRNA hairpin (TAR) and recruiting transcriptional factors to promote transcriptional elongation. The Tat inhibitor didehydro-Cortistatin A (dCA) inhibits transcription and overtime, the lack of low-grade transcriptional events, triggers epigenetic changes at the latent loci that "lock" HIV transcription in a latent state.

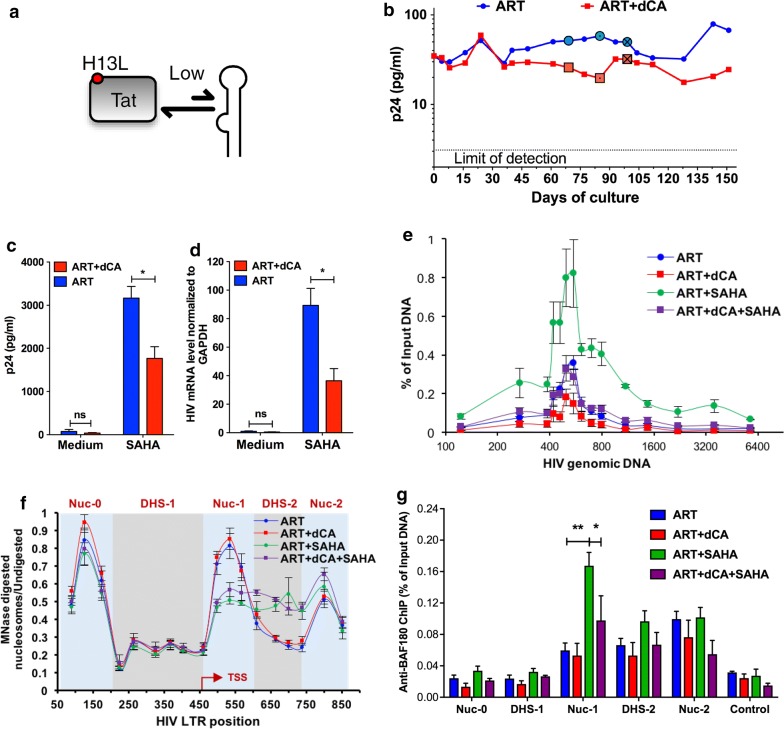
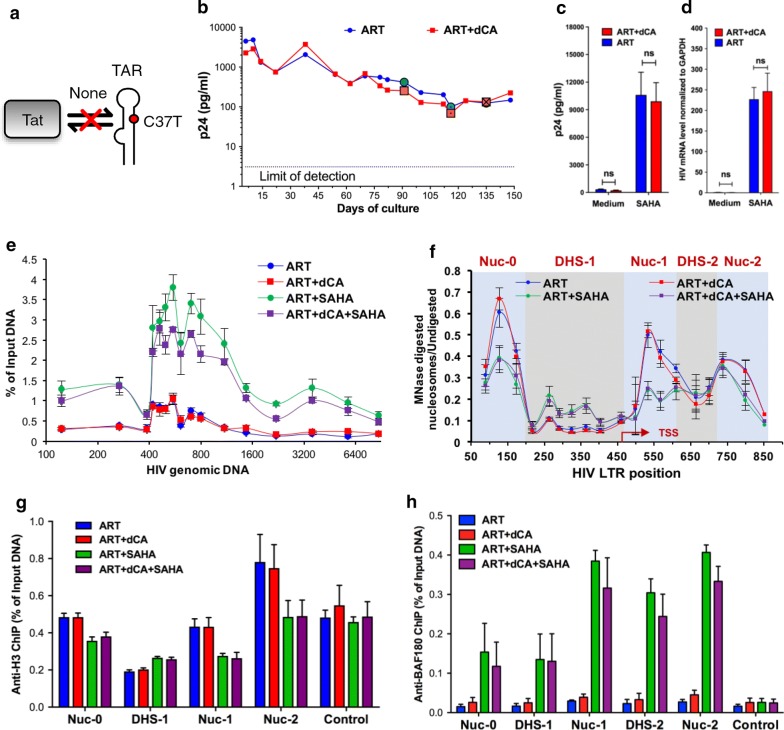
Results: Here we investigated those epigenetic changes using multiple cell line models of HIV-1 latency and active transcription. We demonstrated that dCA treatment does not alter the classic nucleosome positioning at the HIV-1 promoter, but promotes tighter nucleosome/DNA association correlating with increased deacetylated H3 occupancy at nucleosome-1. Recruitment of the SWI/SNF chromatin remodeling complex PBAF, necessary for Tat-mediated transactivation, is also inhibited, while recruitment of the repressive BAF complex is enhanced. These results were supported by loss of RNA polymerase II recruitment on the HIV genome, even during strong stimulation with latency-reversing agents. No epigenetic changes were detected in cell line models of latency with Tat-TAR incompetent proviruses confirming the specificity of dCA for Tat.

Conclusions: We characterized the dCA-mediated epigenetic signature on the HIV genome, which translates into potent blocking effects on HIV expression, further strengthening the potential of Tat inhibitors in "block-and-lock" functional cure approaches.


Conflict of interest statement

The authors declare they have no competing interests.

Figures

Fig. 1
Fig. 1
dCA promotes a repressive chromatin environment at the HIV promoter in HeLa-CD4 chronically infected cells. a dCA reduces viral transcription overtime in NL4-3 chronically infected HeLa-CD4 cells. Cells were split on average every 3 days in the presence of ART with or without 10 nM dCA. Capsid production in the supernatant was quantified via p24 ELISA. Data are representative of three independent experiments. b SAHA treatment activated viral production in chronically infected HeLa-CD4 cells. After day 280 of culture, cells (highlighted with “⦿/☒” in panel A) treated with ART and ART + dCA were stimulated with 2.5 µM SAHA for 24 h. Capsid production in the supernatant was quantified by a p24 ELISA. Data are average of 3 independent experiments, error bars represent standard deviation (SD) of 3 independent experiments (ND, not detected). c SAHA treatment increased viral mRNA levels in chronically infected HeLa-CD4 cells. Cell samples from panel B were also used for RNA extraction, and cDNAs from extracted total RNA were quantified by RT-PCR using primers to the Nef region. Results were normalized as the number of viral mRNA copies per GAPDH mRNA. Viral mRNA generated in the ART control was set to 100%, error bars represent SD of 3 independent experiments. d Viral production in HeLa-CD4 cell line upon treatment interruption. Treatment of dCA was stopped on day 360 and the cells were further maintained in ART for another 55 days. Capsid production was quantified via p24 ELISA. Data are representative of three independent experiments. e Distribution of RNAP II on HIV genome DNA. ChIP assay to RNAP II was performed using cells samples from panels B-C. Results are represented as the percentage of input and subtracted the background of the isotype IgG control. Data are average of 3 independent experiments, and error bars represent SD of 3 experiments for each primer set. f Chromatin structure of the HIV LTR upon dCA treatment was determined by MNase protective assays. The amount of the MNase digested PCR product was normalized to that of the undigested product using the ∆C(t) method (y-axis), which is plotted against the midpoint of the corresponding PCR amplicon (x-axis). The X-axis represents base pairs units with 0 as the start of HIV LTR. Error bars represent the SD of 3 independent experiments. g H3 occupancy on HIV promoter DNA determined by ChIP to H3. Results are presented as percent immunoprecipitated DNA over input, after background subtraction of the isotype IgG control. The ORF of GAPDH was used as control. Data are average of 3 independent experiments and error bars represent the SD of 3 experiments for each primer set. h The level of H3 lysine 27 acetylation (H3K27Ac) on HIV promoter DNA determined by H3K27Ac ChIP. The results are presented as acetylation of H3K27 over total Histone H3 level, after subtraction of the isotype IgG control background. The promoter of RPL-10 was used as the control. Data are average of 3 independent experiments and error bars represent the SD of 3 experiments for each primer set. i The recruitment of PBAF complex on HIV promoter DNA determined by ChIP to BAF180. Results are presented as percent immunoprecipitated DNA over input, after isotype IgG control background subtraction. The promoter of GAPDH was used as the control. Data are average of 3 independent experiments and error bars represent SD of 3 experiments for each primer set. Statistical significance was determined using unpaired t-test (ns, no significance, *P < 0.05, **P < 0.01)
Fig. 2
Fig. 2
dCA induces a repressive chromatin environment on the HIV promoter in latently infected OM-10.1 cells. a Viral production in HIV latently infected OM-10.1 cell treated with ART with or without 100 nM dCA. Cells were split and treated on average every 3 days and capsid production in the supernatant was quantified by p24 ELISA. Data are representative of three independent experiments. b SAHA induced viral production in OM-10.1 cells. After 300 days treatment with ART and ART + dCA, cells (highlighted with “⦿/☒” in panel A) were stimulated with 2.5 µM SAHA for 24 h. Capsid production was quantified via a p24 ELISA. Data are average of 3 independent experiments, and the error bars represent SD of 3 independent. c SAHA induced viral mRNA level in OM-10.1 cell. Cellular sample from panel B also used for RNA extraction, and cDNAs from extracted total RNA were quantified by RT-PCR using primers to the Nef region. Results were normalized as the number of viral mRNA copies per GAPDH mRNA. Viral mRNA generated in the ART control was set to 100%, and the error bars represent the SD of 3 independent experiments. d Distribution of RNAP II on HIV genome DNA. ChIP assay to RNAP II was performed using cells samples from panels B-C. Results are represented as the percentage of input and subtracted the background of the isotype IgG control. Data are average of 3 independent experiments and error bars represent SD of 3 experiments for each primer set. e The chromatin structure of the HIV LTR in latent OM-10.1 cell from sample in panel B and C. f Histone H3 occupancy on HIV promoter DNA determined by ChIP. Results are represented as the percentage of input and subtracted the background of the isotype IgG control. The ORF of GAPDH was used as control. Data are average of 3 independent experiments, and error bars represent the SD of 3 experiments for each primer set. g The level of H3 lysine 27 acetylation (H3K27Ac) on HIV promoter DNA determined by H3K27Ac ChIP. The results are presented as acetylation of H3K27 over total Histone H3 level, after subtraction of the isotype IgG control background. The promoter of RPL-10 was used as the control. Data are average of 3 independent experiments, and error bars represent the SD of 3 experiments for each primer set. h The recruitment of PBAF complex on HIV promoter DNA determined by ChIP to BAF180. Results are presented as percent immunoprecipitated DNA over input, after isotype IgG control background subtraction. Data are average of 3 independent experiments, and error bars represent the SD of 3 experiments for each primer set. The promoter of GAPDH was used as the control. i Recruitment of BAF250 to the HIV promoter by ChIP. Results are presented as percent immunoprecipitated DNA over input, after isotype IgG control background subtraction. Data are average of 3 independent experiments, and error bars represent the SD of 3 experiments for each primer set. The promoter of GAPDH was used as the control. Statistical significance was determined using the unpaired t-test (*P < 0.05, **P < 0.01)
Fig. 3
Fig. 3
dCA partially inhibits HIV expression in U1 cells. a Schematic diagram of the Tat-TAR feedback loop present in provirus in U1 cells. Tat’s H13L mutation weakens interaction with P-TEFb. b The viral production in U1 cell treated with dCA. Cells were split and treated on average every 3 days in the presence of ART with or without dCA (10 nM). Capsid production was quantified by p24 ELISA. Data are representative of three independent experiments. c The viral production in U1 cell stimulated by SAHA. After 48 days of treatment, cells (highlighted with “⦿/☒” in panel A) were stimulated with 2.5 µM SAHA for 24 h. Capsid production was quantified by p24 ELISA. Data are average of 3 independent experiments and the error bars represent the SD of 3 independent experiments. d The viral mRNA levels in U1 cell stimulated by SAHA. Samples from panel B were used for RNA extraction, and cDNAs from extracted total RNA were quantified by RT-PCR using primers to the Vpr region. Results were normalized as the number of viral mRNA copies per GAPDH mRNA. Viral mRNA generated in the ART control was set to 100%, and the error bars represent the SD of 3 independent experiments. e Distribution of RNAP II on the HIV genome in U1 cells. ChIP assay to RNAPII was performed using cell samples from panels C-D. Results are represented as the percentage of input and subtracted the background of the isotype IgG control. Data are average of 3 independent experiments, and error bars represent the SD of 3 experiments for each primer set. f MNase protective assays using sample in panels B-C. Error bars represent the SD of 3 independent experiments. g The recruitment of PBAF complex on HIV promoter DNA in as determined by ChIP to BAF180. Results are presented as percent immunoprecipitated DNA over input after isotype IgG control background subtraction. Data are average of 3 independent experiments, and error bars represent the SD of 3 experiments for each primer set. The promoter of GAPDH was used as the control. Statistical significance was determined using unpaired t-test (ns, no significance, *P < 0.05)
Fig. 4
Fig. 4
dCA does not inhibit HIV expression in ACH-2 cells. a Schematic representation of the Tat-TAR feedback loop present in provirus in ACH-2 cells. b The viral production in ACH-2 cell treated with dCA. Cells were split and treated on average every 3 days in the presence of ART with or without 10 nM dCA. Data are representative of three independent experiments. c The viral production in ACH-2 cell treated stimulated by SAHA. After 60 days, cells (highlighted with “⦿/☒” in panel A) were stimulated with 2.5 µM SAHA for 24 h. Capsid production was quantified by p24 ELISA. Data are average of 3 independent experiments and the error bars represent the SD of 3 independent experiments. d The viral mRNA level in ACH-2 cell treated with SAHA. Samples from panel B were used for RNA extraction, and cDNAs from extracted total RNA were quantified by RT-PCR using primers to the Nef region. Results were normalized as the number of viral mRNA copies per GAPDH mRNA. Viral mRNA generated in the ART control was set to 100%, and the error bars represent the SD of 3 independent experiments. e Distribution of RNAP II on the HIV genome in ACH-2 cell. ChIP assay was performed using cells samples from panels B-C. Results are presented as percent immunoprecipitated DNA over input, after isotype IgG control background subtraction. Data are average of 3 independent experiments, and error bars represent the SD of 3 experiments for each primer set. f The chromatin structure of the HIV LTR in U1 cells (samples from panel B-C) investigated by MNase protective assays. Error bars represent the SD of 3 independent experiments. g The recruitment of PBAF complex on HIV promoter DNA in as determined by ChIP to BAF180. Results are presented as percent immunoprecipitated DNA over input, after isotype IgG control background subtraction. h H3 occupancy on HIV promoter DNA determined by ChIP to H3. Results are presented as percent immunoprecipitated DNA over input, after isotype IgG control background subtraction. The ORF of GAPDH was used as the control. Data are average of 3 independent experiments and error bars represent the SD of 3 experiments for each primer set. Statistical significance was determined using unpaired t-test (ns, no significance, *P < 0.05)
Fig. 5
Fig. 5
Progressive epigenetic silencing of HIV expression by the TT at inhibitor dCA. a During active transcription, Tat recruit P-TEFb to TAR to boost the transition from transcription initiation to elongation. Nuc-1 downstream are characterized with activating epigenetic marks and poised for productive transcription by the recruitment of SWI/SNF chromatin remodeling complex (BAF180). b dCA binds to Tat and blocks the recruitment of P-TEFb to TAR, to inhibit the transition of transcription initiation to elongation. The repressive SWI/SNF chromatin remodeling complex (BAF250) accumulates on the HIV promoter, resulting in increased Nuc-1 occupancy and increased repressive epigenetic marks. c Overtime the treatment with dCA promotes the establishment of a closed chromatin state with limited RNA polymerase II (RNAP II) recruitment to the promoter. dCA-mediated silencing is refractory to reactivation by various LRAs

Similar articles

Cited by

References

    1. Sogaard OS, et al. The depsipeptide romidepsin reverses HIV-1 latency in vivo. PLoS Pathog. 2015;11(9):e1005142. doi: 10.1371/journal.ppat.1005142. - DOI - PMC - PubMed
    1. Chun TW, et al. Persistence of HIV in gut-associated lymphoid tissue despite long-term antiretroviral therapy. J Infect Dis. 2008;197(5):714–720. doi: 10.1086/527324. - DOI - PubMed
    1. Gunthard HF, et al. Residual human immunodeficiency virus (HIV) type 1 RNA and DNA in lymph nodes and HIV RNA in genital secretions and in cerebrospinal fluid after suppression of viremia for 2 years. J Infect Dis. 2001;183(9):1318–1327. doi: 10.1086/319864. - DOI - PubMed
    1. Pomerantz RJ, Trono D, Feinberg MB, Baltimore D. Cells nonproductively infected with HIV-1 exhibit an aberrant pattern of viral RNA expression: a molecular model for latency. Cell. 1990;61(7):1271–1276. doi: 10.1016/0092-8674(90)90691-7. - DOI - PubMed
    1. Huang LM, Jeang KT. Increased spacing between Sp1 and TATAA renders human immunodeficiency virus type 1 replication defective: implication for Tat function. J Virol. 1993;67(12):6937–6944. - PMC - PubMed

Publication types

MeSH terms

Substances

LinkOut - more resources