. 2019 May 2;132(9):jcs226217.
doi: 10.1242/jcs.226217.

Shigella MreB promotes polar IcsA positioning for actin tail formation

Affiliations

Shigella MreB promotes polar IcsA positioning for actin tail formation

Sina Krokowski et al. J Cell Sci. .

Abstract

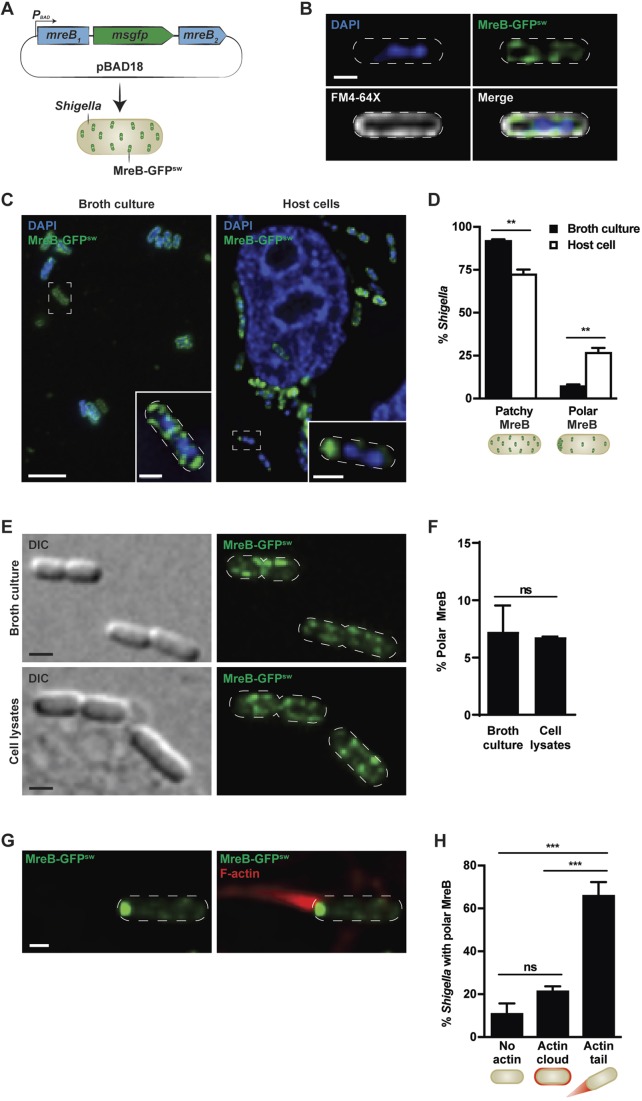
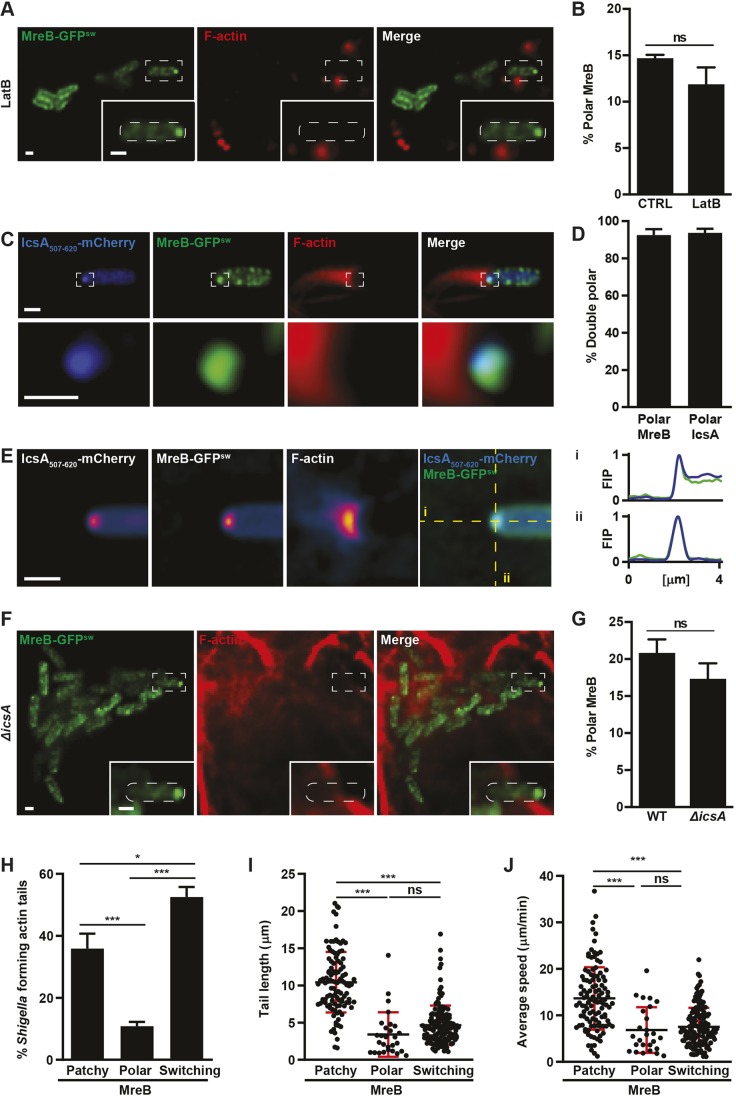
Pathogenic Shigella bacteria are a paradigm to address key issues of cell and infection biology. Polar localisation of the Shigella autotransporter protein IcsA is essential for actin tail formation, which is necessary for the bacterium to travel from cell-to-cell; yet how proteins are targeted to the bacterial cell pole is poorly understood. The bacterial actin homologue MreB has been extensively studied in broth culture using model organisms including Escherichia coli, Bacillus subtilis and Caulobacter crescentus, but has never been visualised in rod-shaped pathogenic bacteria during infection of host cells. Here, using single-cell analysis of intracellular Shigella, we discover that MreB accumulates at the cell pole of bacteria forming actin tails, where it colocalises with IcsA. Pharmacological inhibition of host cell actin polymerisation and genetic deletion of IcsA is used to show, respectively, that localisation of MreB to the cell poles precedes actin tail formation and polar localisation of IcsA. Finally, by exploiting the MreB inhibitors A22 and MP265, we demonstrate that MreB polymerisation can support actin tail formation. We conclude that Shigella MreB promotes polar IcsA positioning for actin tail formation, and suggest that understanding the bacterial cytoskeleton during host-pathogen interactions can inspire development of new therapeutic regimes for infection control.This article has an associated First Person interview with the first author of the paper.

Keywords: Actin; IcsA; MreB; Septin; Shigella.


Conflict of interest statement

Competing interestsThe authors declare no competing or financial interests.

Figures

Fig. 1.
Fig. 1.
Shigella forming actin tails remodel MreB. (A) Diagram illustrating the plasmid-encoded arabinose-controlled MreB-monomeric superfolder green fluorescent protein (msGFP) sandwich fusion in S. flexneri. (B) Localisation of MreB-GFPsw in S. flexneri in broth culture with respect to membrane (FM4-64X) and DNA (DAPI) staining. Scale bar: 1 µm. (C) S. flexneri MreB-GFPsw grown for 3 h in broth culture or at 3 h 40 min post infection. Scale bar: 5 µm (main image), 1 µm (inset). (D) Graph representing the mean±s.e.m. percentage of S. flexneri exhibiting patchy MreB-GFPsw or accumulation of MreB-GFPsw at the bacterial cell pole. Values are from 1107 bacteria for ‘broth culture’ and 1846 bacteria for ‘host cell’ from three independent experiments performed as in C. **P<0.01 (Student's t-test). (E) Representative images of S. flexneri MreB-GFPsw grown for 2 h in broth or host cell lysates. DIC, differential interference contrast images. Scale bar: 1 µm. (F) Graph representing the mean±s.e.m. percentage of S. flexneri exhibiting polar MreB-GFPsw accumulation. Values are from 996 bacteria for ‘broth culture’ and 933 bacteria for ‘cell lysates’ from three independent experiments performed as in E. ns, not significant, P>0.05 (Student's t-test). (G) Representative images of S. flexneri MreB-GFPsw polymerising an actin tail. HeLa cells were infected with S. flexneri MreB-GFPsw for 2 h 40 min and labelled for F-actin. Scale bar: 1 µm. (H) Graph representing mean±s.e.m. percentage of polar S. flexneri MreB-GFPsw that do not polymerise actin, polymerise an actin cloud or polymerise an actin tail. Values are from 1346 bacteria from three independent experiments performed as in E., ns, not significant, P>0.05; ***P<0.001 (one-way ANOVA). The white dashed lines in B, the inset in C, and in E and G indicate the bacterial cell edge.
Fig. 2.
Fig. 2.
MreB and IcsA colocalise at the same bacterial cell pole. (A) HeLa cells were infected with S. flexneri MreB-GFPsw for 1 h 40 min, treated with LatB for 60 min and labelled for F-actin. Scale bars: 1 µm. (B) Graph representing the mean±s.e.m. percentage of S. flexneri exhibiting polar MreB-GFPsw localisation in untreated (CTRL) or LatB-treated conditions. Values are from 2284 bacteria for CTRL and 1463 bacteria for LatB from three independent experiments performed as in A. ns, not significant, P>0.05 (Student's t-test). (C) Representative Airyscan image of HeLa cells infected for 2 h 40 min with S. flexneri MreB-GFPsw IcsA507-620-mCherry and labelled for F-actin. Scale bar: 1 µm. (D) Graph representing the mean±s.e.m. percentage of bacteria with polar MreB-GFPsw that also have polar IcsA507-620-mCherry and vice versa. Values are from n=1541 bacteria from three independent experiments performed as in C. (E) Airyscan-SPA of bacteria exhibiting polar MreB accumulation, and resulting models for IcsA507-620-mCherry and F-actin from n=70 bacteria. Scale bar: 1 µm. Fluorescence intensity profiles (FIP) along the long (i) and short (ii) axis of the cell are shown to the right. Yellow dashed lines indicate where the FIPs were taken. (F) Representative image of HeLa cells infected with S. flexneri ΔicsA MreB-GFPsw for 2 h 40 min. Scale bars: 1 µm. (G) Graph representing the mean±s.e.m. percentage of wild-type (WT) or ΔicsA S. flexneri exhibiting polar MreB-GFPsw localisation. Values are from 1622 bacteria for WT and 1634 bacteria for ΔicsA from four independent experiments performed as in F. ns, not significant, P>0.05 (Student's t-test). (H) Graph representing mean±s.e.m. percentage of S. flexneri forming actin tails exhibiting patchy or polar MreB-GFPsw localisation or switching between patchy and polar MreB-GFPsw localisation during the imaging period. Values are from 275 bacteria from five independent experiments performed as in H. *P<0.05, ***P<0.001 (Student's t-test). (I,J) Graph representing mean±s.d. actin tail length or average speed of actin-polymerising bacteria exhibiting patchy, polar or switching MreB-GFPsw. Each dot represents a single bacterium from five independent experiments performed as in H. ns, not significant, P>0.05; ***P<0.001 (Student's t-test). The white dashed lines in the insets indicate the bacterial cell edge.
Fig. 3.
Fig. 3.
MreB polarisation promotes Shigella actin tail formation. (A) Airyscan image of HeLa cells infected for 40 min with S. flexneri MreB-GFPsw IcsA507-620-mCherry, treated for 2 h with A22 and labelled for F-actin. Scale bar: 5 µm (main images), 1 µm (insets). (B) S. flexneri MreB-GFPsw polymerising actin in untreated (CTRL) and A22-treated conditions. HeLa cells were infected for 40 min, kept untreated or treated with A22 for 2 h and labelled for F-actin. Scale bars: 1 µm. (C) Graph representing the mean±s.e.m. percentage of S. flexneri polymerising an actin cloud or actin tail in untreated and A22-treated conditions. Values are from 1408 bacteria for CTRL and 654 bacteria for A22 from three independent experiments performed as in B. *P<0.05 (Student's t-test). (D) HeLa cells were infected with S. flexneri for 40 min, and kept untreated (CTRL) or treated with MP265 for 2 h. They were then labelled for F-actin using Alexa Fluor 555–phalloidin and immunolabelled for Shigella. Scale bars: 1 µm. (E) Graph representing the mean±s.e.m. percentage of S. flexneri polymerising an actin cloud or actin tail in CTRL and MP265-treated conditions. Values are from 1677 bacteria for CTRL and 1614 bacteria for MP265 from four independent experiments performed as in D. **P<0.01 (Student's t-test). (F) HeLa cells treated with control (CTRL) or SEPT7 siRNA, infected with S. flexneri for 40 min and kept untreated (CTRL) or treated with A22 for 2 h. Scale bars: 5 µm. (G) Graph representing the mean±s.e.m. percentage of S. flexneri polymerising actin tails in HeLa cells treated with control (CTRL) siRNA or SEPT7 siRNA and kept untreated (CTRL) or treated with A22. Values are from 932 bacteria for CTRL siRNA and CTRL, 852 bacteria for CTRL siRNA and A22, 941 bacteria for SEPT7 siRNA and CTRL and 1002 bacteria for SEPT7 siRNA and A22 from three independent experiments performed as in F. ns, not significant, P>0.05; *P<0.05 (Student's t-test). (H–J) Time-lapse images (H) and quantifications (I,J) of HeLa cells transfected with LifeAct-mCherry and infected with S. flexneri GFP at 2 h 40 min post infection imaged every 10 s in untreated (CTRL) and A22-treated conditions. Images are cropped from Movies 1 and 2. The white dotted line indicates the bacterial trajectory. Scale bars: 1 µm. Each dot represents the linearity (I) or average speed (J) of a bacterium polymerising actin.

References

    1. Bernardini M. L., Mounier J., d'Hauteville H., Coquis-Rondon M. and Sansonetti P. J. (1989). Identification of icsA, a plasmid locus of Shigella flexneri that governs bacterial intra- and intercellular spread through interaction with F-actin. Proc. Natl. Acad. Sci. USA 86, 3867-3871. 10.1073/pnas.86.10.3867 - DOI - PMC - PubMed
    1. Beyer H. M., Gonschorek P., Samodelov S. L., Meier M., Weber W. and Zurbriggen M. D. (2015). AQUA cloning: a versatile and simple enzyme-free cloning approach. PLoS ONE 10, e0137652 10.1371/journal.pone.0137652 - DOI - PMC - PubMed
    1. Brandon L. D., Goehring N., Janakiraman A., Yan A. W., Wu T., Beckwith J. and Goldberg M. B. (2003). IcsA, a polarly localized autotransporter with an atypical signal peptide, uses the Sec apparatus for secretion, although the Sec apparatus is circumferentially distributed. Mol. Microbiol. 50, 45-60. 10.1046/j.1365-2958.2003.03674.x - DOI - PubMed
    1. Cabeen M. T. and Jacobs-Wagner C. (2010). The bacterial cytoskeleton. Annu. Rev. Genet. 44, 365-392. 10.1146/annurev-genet-102108-134845 - DOI - PubMed
    1. Charles M., Perez M., Kobil J. H. and Goldberg M. B. (2001). Polar targeting of Shigella virulence factor IcsA in Enterobacteriacae and Vibrio. Proc. Natl. Acad. Sci. USA 98, 9871-9876. 10.1073/pnas.171310498 - DOI - PMC - PubMed

Publication types