. 2019 Apr 16;10(2):e00321-19.
doi: 10.1128/mBio.00321-19.

Identification of the Bacterial Biosynthetic Gene Clusters of the Oral Microbiome Illuminates the Unexplored Social Language of Bacteria during Health and Disease

Affiliations

Identification of the Bacterial Biosynthetic Gene Clusters of the Oral Microbiome Illuminates the Unexplored Social Language of Bacteria during Health and Disease

Gajender Aleti et al. mBio. .

Abstract

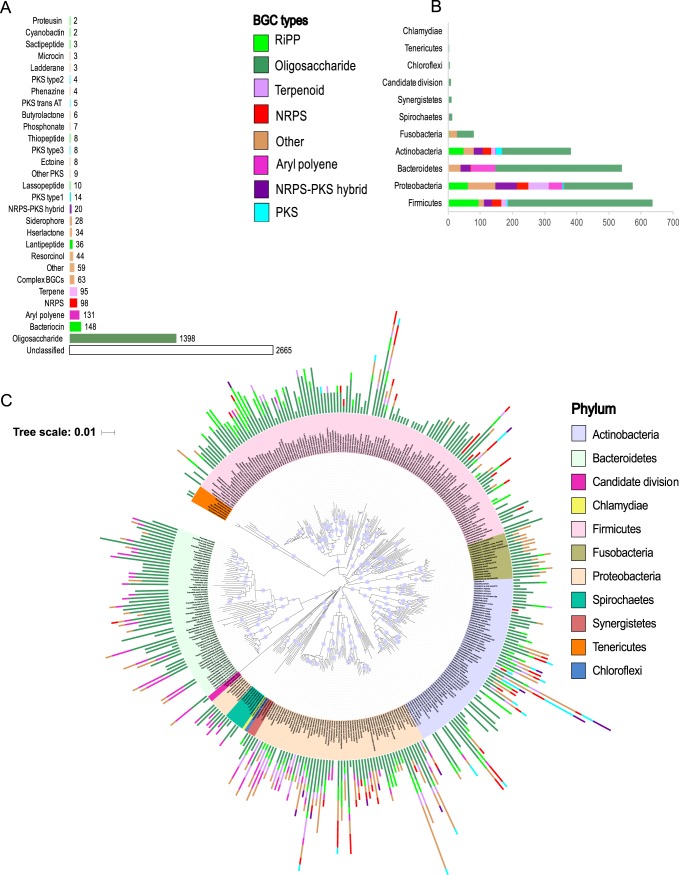
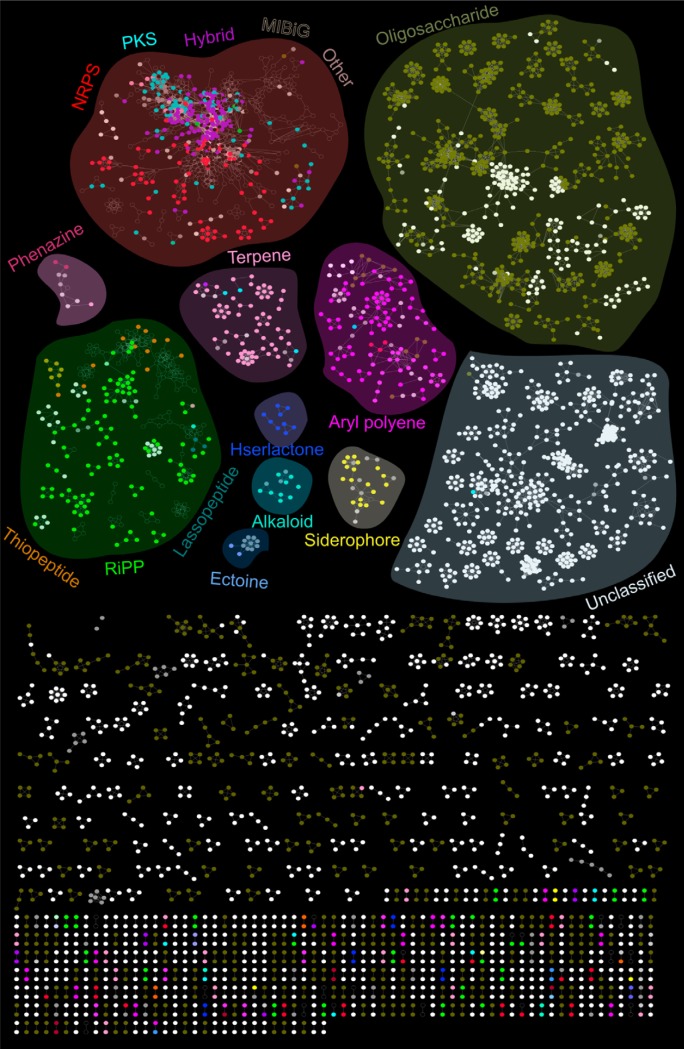
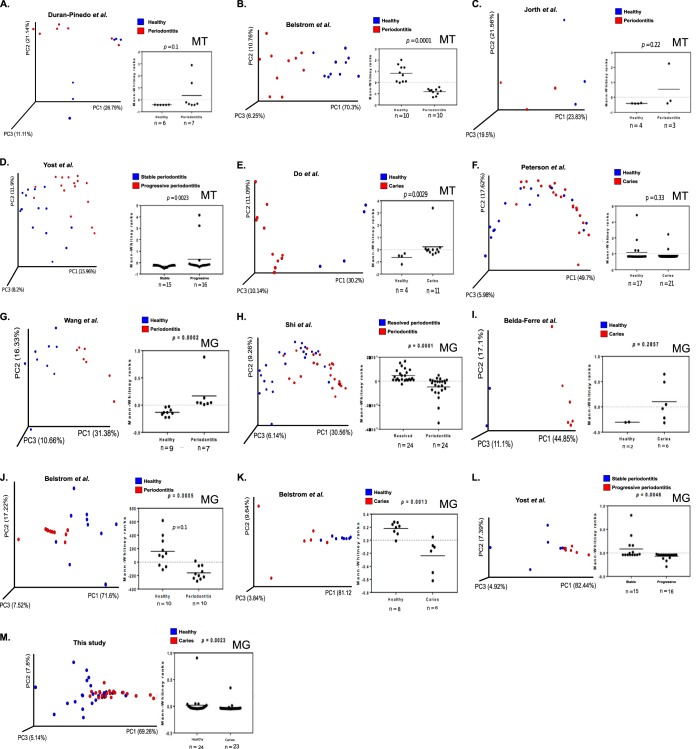
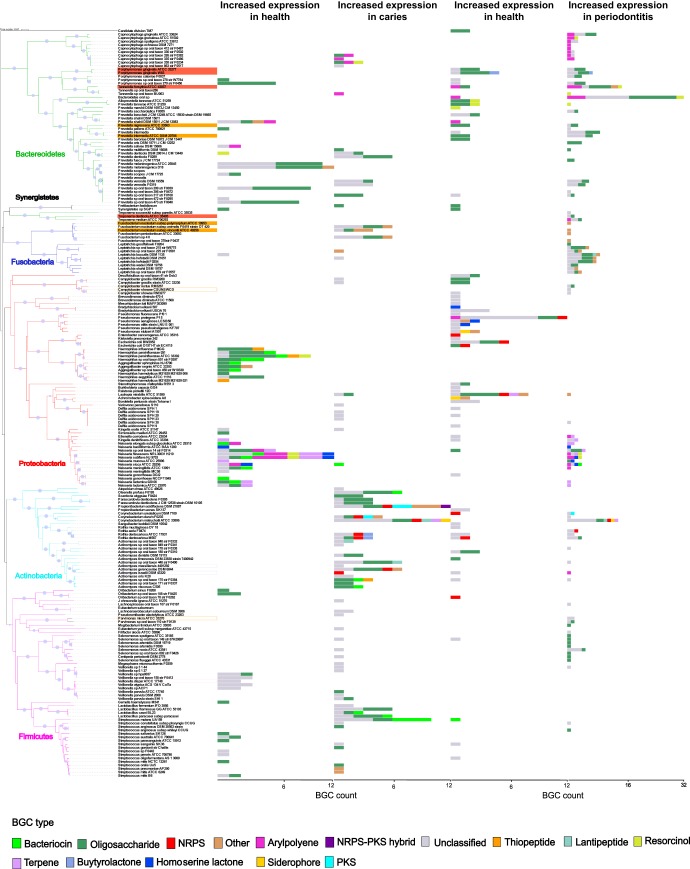
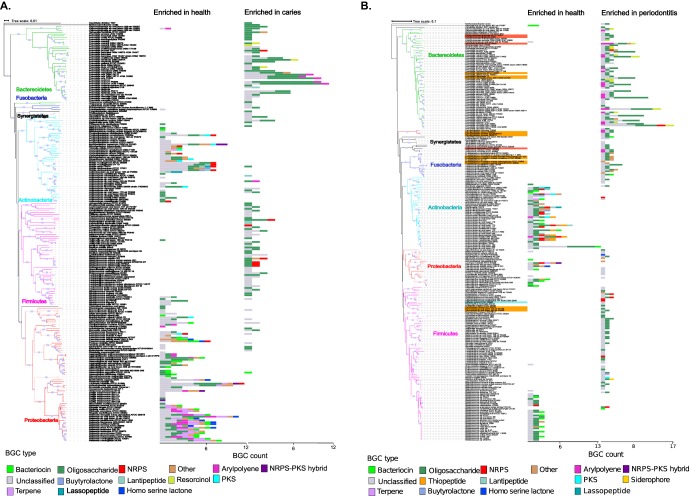
Small molecules are the primary communication media of the microbial world. Recent bioinformatic studies, exploring the biosynthetic gene clusters (BGCs) which produce many small molecules, have highlighted the incredible biochemical potential of the signaling molecules encoded by the human microbiome. Thus far, most research efforts have focused on understanding the social language of the gut microbiome, leaving crucial signaling molecules produced by oral bacteria and their connection to health versus disease in need of investigation. In this study, a total of 4,915 BGCs were identified across 461 genomes representing a broad taxonomic diversity of oral bacteria. Sequence similarity networking provided a putative product class for more than 100 unclassified novel BGCs. The newly identified BGCs were cross-referenced against 254 metagenomes and metatranscriptomes derived from individuals either with good oral health or with dental caries or periodontitis. This analysis revealed 2,473 BGCs, which were differentially represented across the oral microbiomes associated with health versus disease. Coabundance network analysis identified numerous inverse correlations between BGCs and specific oral taxa. These correlations were present in healthy individuals but greatly reduced in individuals with dental caries, which may suggest a defect in colonization resistance. Finally, corroborating mass spectrometry identified several compounds with homology to products of the predicted BGC classes. Together, these findings greatly expand the number of known biosynthetic pathways present in the oral microbiome and provide an atlas for experimental characterization of these abundant, yet poorly understood, molecules and socio-chemical relationships, which impact the development of caries and periodontitis, two of the world's most common chronic diseases.IMPORTANCE The healthy oral microbiome is symbiotic with the human host, importantly providing colonization resistance against potential pathogens. Dental caries and periodontitis are two of the world's most common and costly chronic infectious diseases and are caused by a localized dysbiosis of the oral microbiome. Bacterially produced small molecules, often encoded by BGCs, are the primary communication media of bacterial communities and play a crucial, yet largely unknown, role in the transition from health to dysbiosis. This study provides a comprehensive mapping of the BGC repertoire of the human oral microbiome and identifies major differences in health compared to disease. Furthermore, BGC representation and expression is linked to the abundance of particular oral bacterial taxa in health versus dental caries and periodontitis. Overall, this study provides a significant insight into the chemical communication network of the healthy oral microbiome and how it devolves in the case of two prominent diseases.

Keywords: biosynthetic gene clusters; caries; genome mining; oral microbiome; periodontitis; small molecules.


Figures

FIG 1
FIG 1
The oral microbiome contains a massive diversity of BGCs encoded by a multitude of taxa. (A) Bar graph illustrating the most common BGC subtypes identified in this study. Bars are colored according to higher level BGC class. (B) Bar graph illustrating the distribution of eight major classes of BGCs by phyla. (C) Phylogenetic tree based on 16S rRNA gene sequences showing the distribution of BGCs encoded by oral bacteria. Nodes with bootstrap values higher than 80% are displayed in the tree. The numbers of BGC types identified within each genome are shown in the bar graph and colored by BGC type. Leaf labels are colored by phyla. antiSMASH often identifies BGCs that encompass multiple gene clusters of different types fused into a single large gene cluster. Sixty-three (∼3%) of such unresolved BGCs were encountered and categorized as the “complex” BGC type (for convenience, we combined these BGCs with BGC types “Other” for subsequent analysis).
FIG 2
FIG 2
Similarity networking identified putative product classes for novel BGCs. Similarity networks between the BGCs identified in the oral cavity and the experimentally characterized reference BGCs obtained from the MIBiG repository are depicted. Subnetworks representing major BGC classes, as determined by antiSMASH and BiG-SCAPE, are highlighted with different background colors to visualize BGCs as constellations within the biosynthetic landscape. Nodes (small circles) represent amino acid sequences of BGC domains and are colored by BGC class. Unfilled nodes represent reference BGCs from the MIBiG repository. Edges drawn between the nodes correspond to pairwise distances, computed by BiG-SCAPE as the weighted combination of the Jaccard, adjacency, and domain sequence similarity indices. For increased simplicity, only subclusters of unclassified and oligosaccharide BGCs with a minimum number of eight nodes are organized into given highlighted constellation.
FIG 3
FIG 3
Principal coordinate analysis (PCoA) of BGC profiles representing oral bacterial communities in health and disease. (A) Metatranscriptomics (MT) of BGC profiles from healthy individuals versus individuals with periodontitis from Duran-Pinedo et al. (17). (B) Metatranscriptomics of healthy versus periodontitis BGC profiles from Belstrom et al. (18). (C) Metatranscriptomics of stable versus progressive periodontitis profiles from Jorth et al. (19). (D) Metatranscriptomics of healthy versus caries profiles from Yost et al. (20). (E) Metatranscriptomics of healthy versus caries profiles from Do et al. (21). (F) Metatranscriptomics of healthy versus caries profiles from Peterson et al. (22). (G) Metagenomics (MG) of BGC profiles from healthy individuals versus individuals with periodontitis from Wang et al. (23). (H) Metagenomics of resolved versus periodontitis profiles from Shi et al. (24). (I) Metagenomics of healthy versus caries profiles from Belda-Ferre et al. (25). (J) Metagenomics of healthy versus periodontitis profiles from Belstrom et al. (18). (K) Metagenomics of healthy versus caries profiles from Belstrom et al. (18). (L) Metagenomics of stable versus progressive periodontitis profiles from Yost et al. (20). (M) Metagenomics of healthy versus caries in the current study. PCoA analyses are based on differentially represented BGCs calculated by using the DESeq2 package with false discovery rate (FDR) correction of <0.05. Manhattan distances between samples were visualized using the first three principal coordinates, and significance was tested by applying Mann-Whitney ranks on the most variance captured by the first principal coordinate.
FIG 4
FIG 4
BGCs are differentially expressed in oral health and disease. Bar graphs illustrating phylogenetic distribution of biosynthetic pathways in oral health- and disease-associated oral microorganisms. Taxa with significant changes in BGC expression based on the analyzed metatranscriptomic data sets are shown in the phylogenetic tree on the left. Bacterial genomes associated with periodontal disease and that belong to the red and orange complexes are labeled in orange and red. Bar graphs at the leaf tips display number of BGCs either up- or downexpressed and colored according to the BGC type. It should be noted that the x-axis scales are different in the left and right panels. Significant differences in the expression of BGCs were determined based on negative binomial distribution model using DESeq2 with FDR correction (P value < 0.05).
FIG 5
FIG 5
Overview of differentially represented biosynthetic pathways in oral bacterial genomes in oral health and disease states based on metagenomic data sets. Bacterial genomes associated with periodontal disease and that belong to the red and orange complexes are labeled in orange and red. (A) 740 differentially abundant BGCs in the salivary and supragingival microbiome in healthy individuals and individuals with caries, representing 69 subjects (healthy individuals [n = 34]; individuals with caries [n = 35]). (B) 1,065 differentially abundant BGCs in metagenomes obtained from saliva and subgingival plaque samples from individuals with periodontitis and healthy controls, representing 49 subjects (oral health [n = 25]; periodontitis [n = 24]). Taxonomic units with significant changes in BGC representation are shown in the phylogenetic tree. Bar graphs at the leaf tips are colored according to the BGC type and display numbers of BGCs expressed higher or lower. Noted that the x-axis scales are different for the left and right panels.
FIG 6
FIG 6
Analysis of small molecules shows clear differences between saliva samples derived from healthy children compared to children with caries. (A) Principal coordinate analysis (PCoA) of parent masses (m/z) derived from LC-MS/MS analysis of saliva. Manhattan distances between samples were visualized, and significance was tested by applying Mann-Whitney ranks on the principal coordinates (P < 0.0001). (B) PCoA based on DMFT (decayed, missed, or filled teeth) scores (P > 0.05). (C) PCoA based on primary and mixed dentition (primary and permanent teeth) (P > 0.05). (D) PCoA based on race (P > 0.05). (E) PCoA based on age (P > 0.05). (F) Fifteen key metabolites responsible for the PCoA separation identified by a random forest importance model.

References

    1. Human Microbiome Project Consortium. 2012. Structure, function and diversity of the healthy human microbiome. Nature 486:207–214. doi:10.1038/nature11234. - DOI - PMC - PubMed
    1. Donia MS, Cimermancic P, Schulze CJ, Wieland Brown LC, Martin J, Mitreva M, Clardy J, Linington RG, Fischbach MA. 2014. A systematic analysis of biosynthetic gene clusters in the human microbiome reveals a common family of antibiotics. Cell 158:1402–1414. doi:10.1016/j.cell.2014.08.032. - DOI - PMC - PubMed
    1. Donia MS, Fischbach MA. 2015. Small molecules from the human microbiota. Science 349:1254766. doi:10.1126/science.1254766. - DOI - PMC - PubMed
    1. Cimermancic P, Medema MH, Claesen J, Kurita K, Wieland Brown LC, Mavrommatis K, Pati A, Godfrey PA, Koehrsen M, Clardy J, Birren BW, Takano E, Sali A, Linington RG, Fischbach MA. 2014. Insights into secondary metabolism from a global analysis of prokaryotic biosynthetic gene clusters. Cell 158:412–421. doi:10.1016/j.cell.2014.06.034. - DOI - PMC - PubMed
    1. Zipperer A, Konnerth MC, Laux C, Berscheid A, Janek D, Weidenmaier C, Burian M, Schilling NA, Slavetinsky C, Marschal M, Willmann M, Kalbacher H, Schittek B, Brotz-Oesterhelt H, Grond S, Peschel A, Krismer B. 2016. Human commensals producing a novel antibiotic impair pathogen colonization. Nature 535:511–516. doi:10.1038/nature18634. - DOI - PubMed

Publication types

LinkOut - more resources