. 2019 Apr 16;10(1):1780.
doi: 10.1038/s41467-019-09607-x.

The role of platelets in mediating a response to human influenza infection

Affiliations

The role of platelets in mediating a response to human influenza infection

Milka Koupenova et al. Nat Commun. .

Abstract

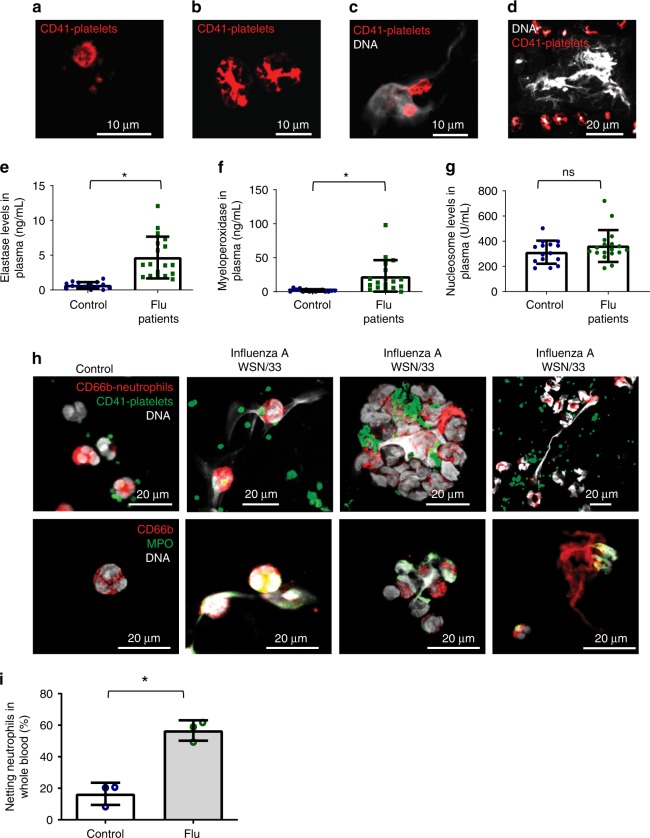
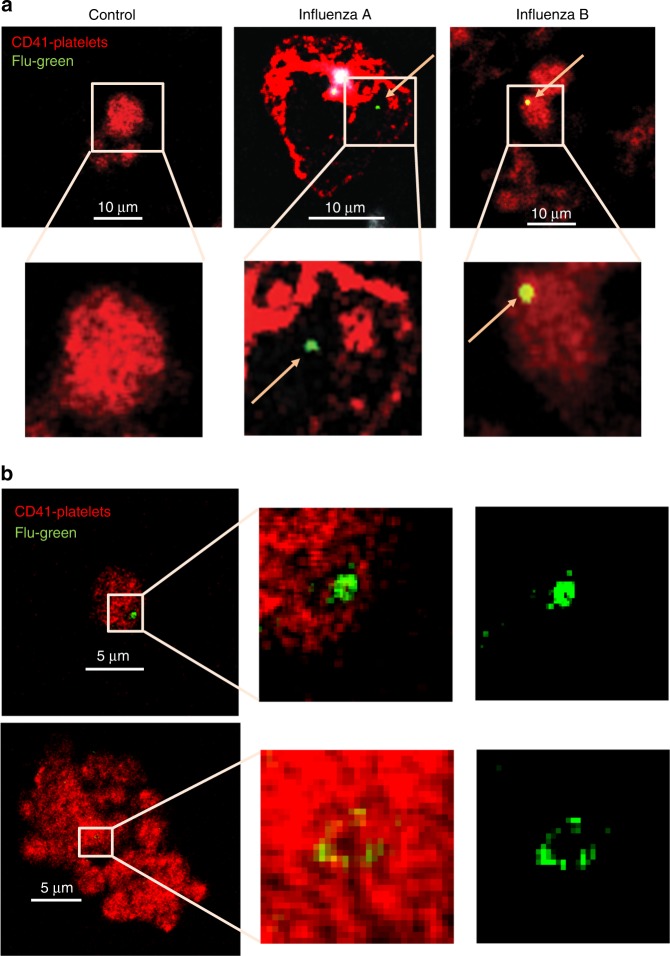
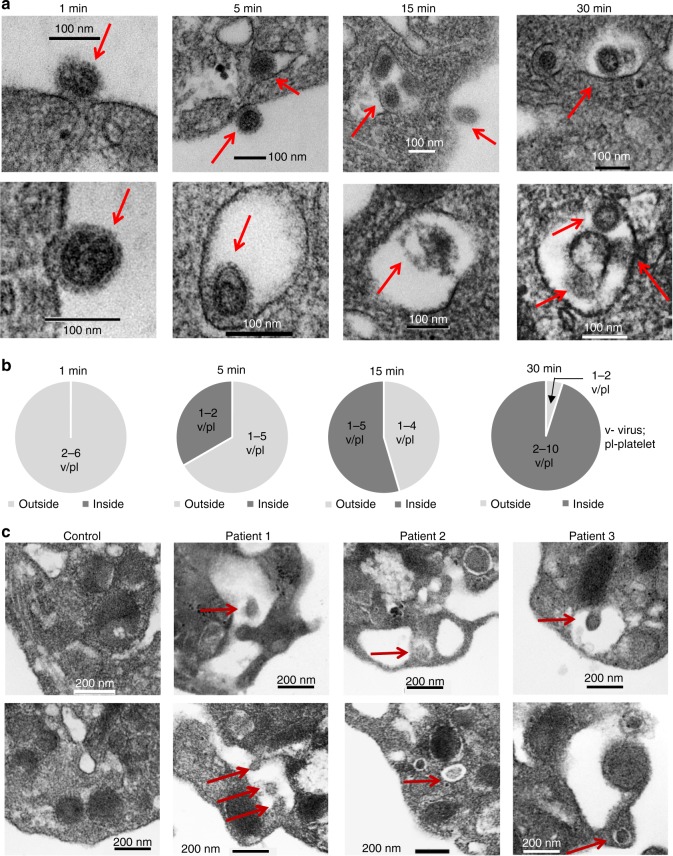
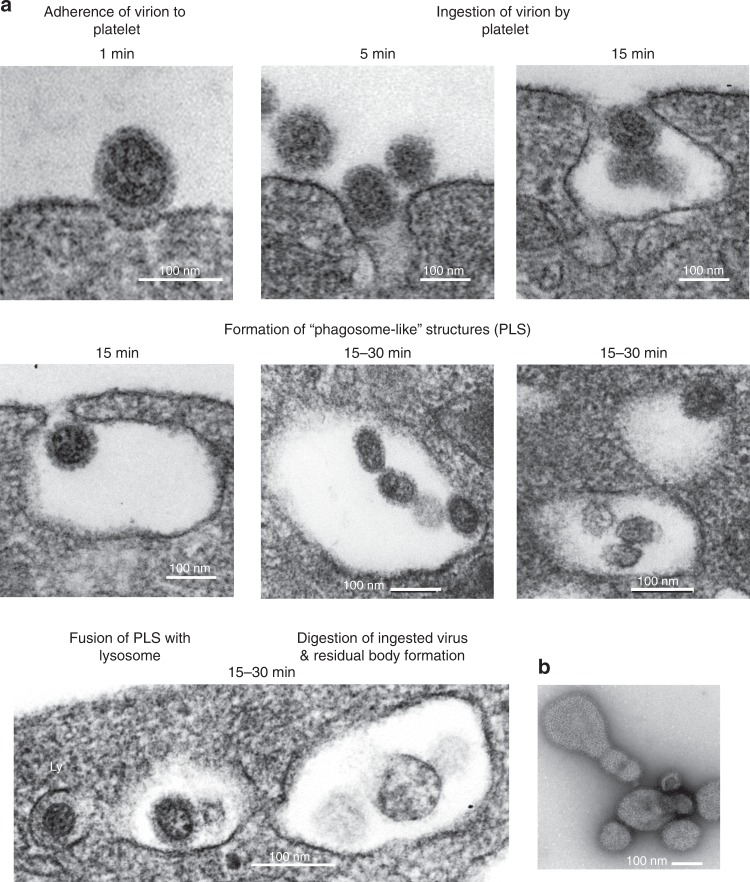
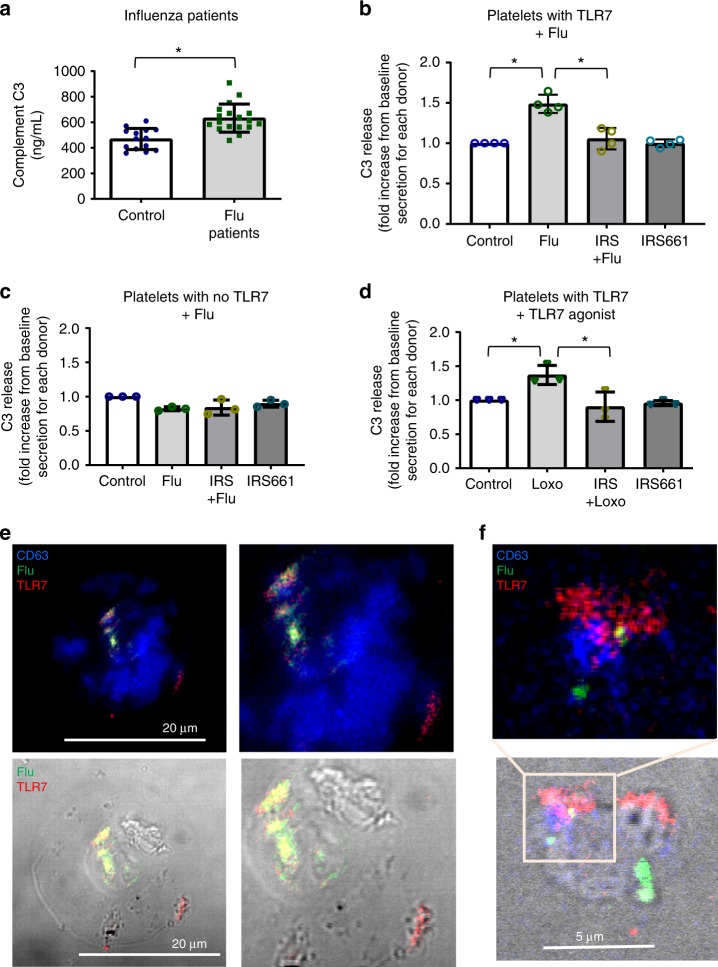
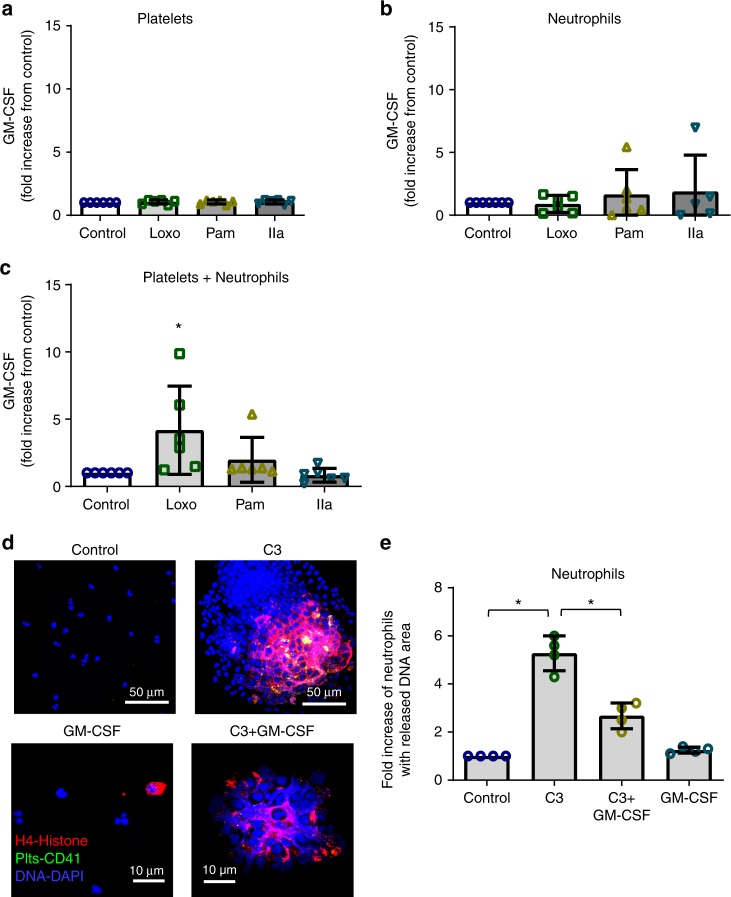
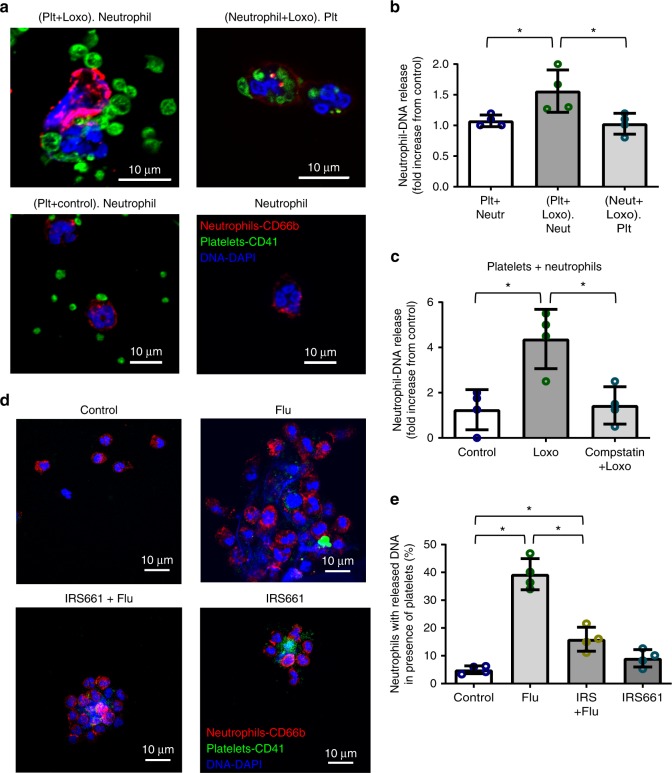
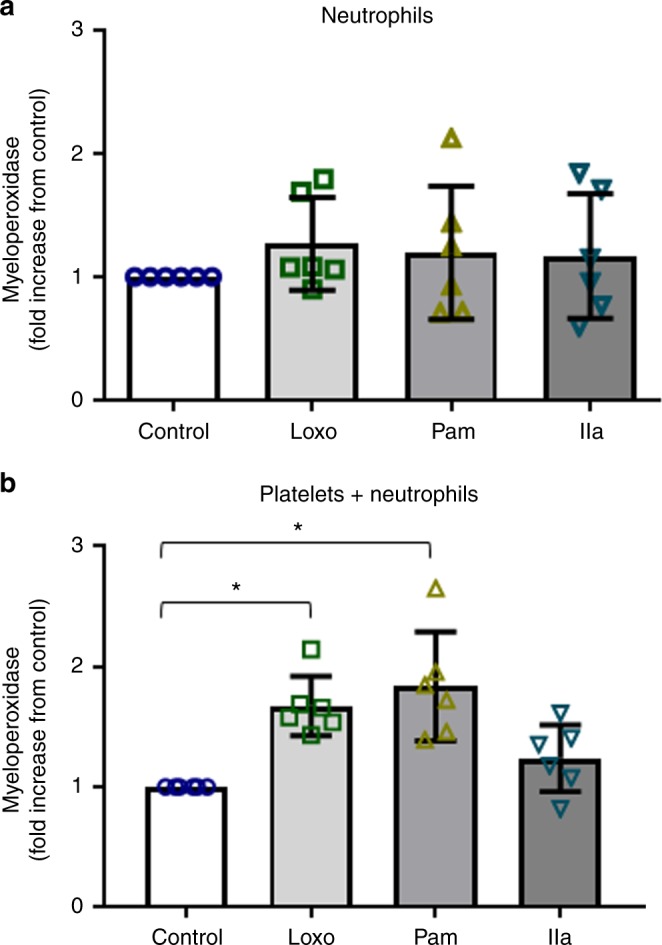
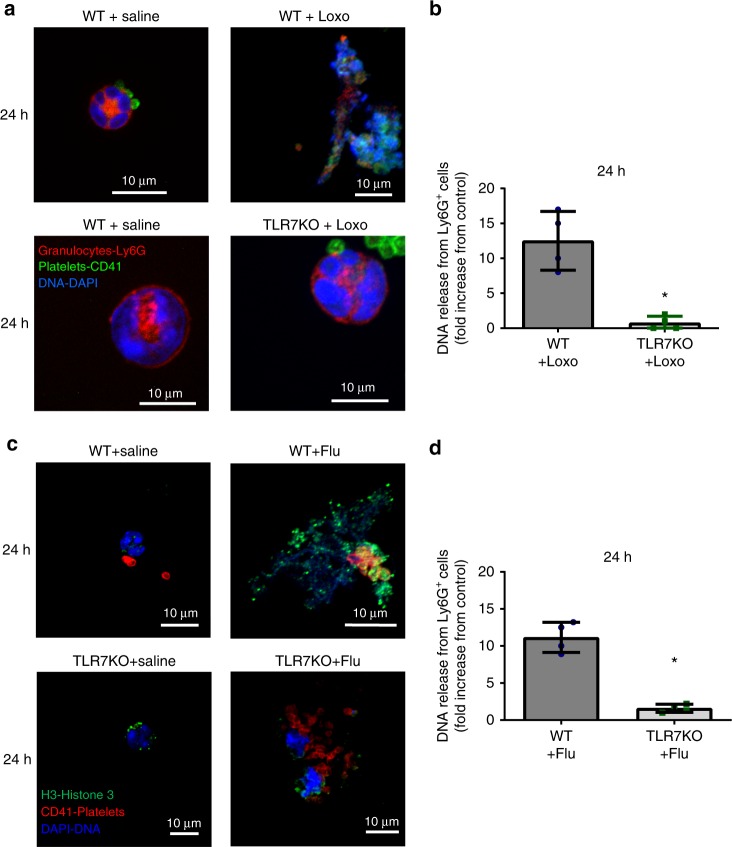
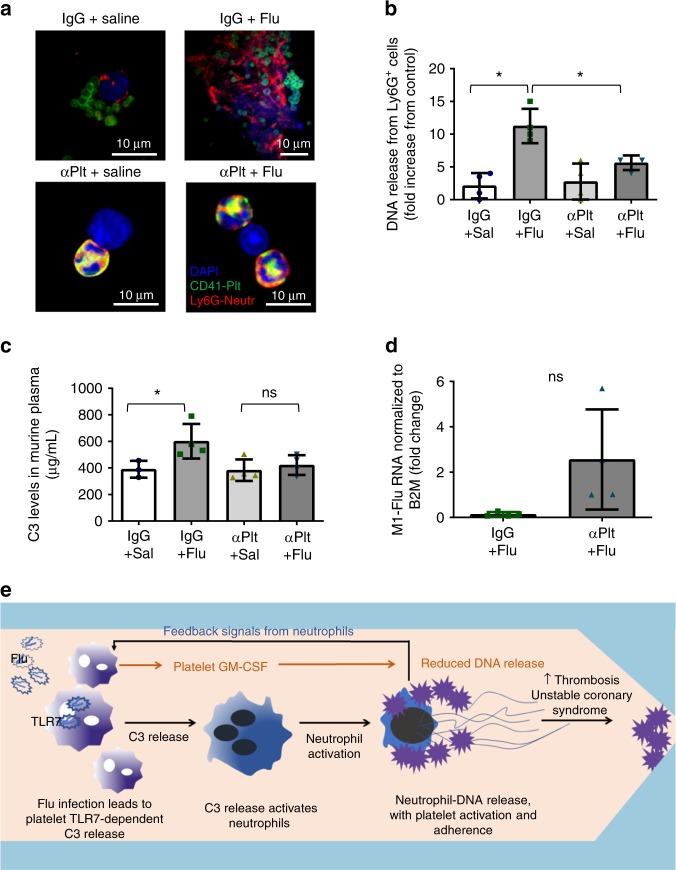
Influenza infection increases the incidence of myocardial infarction but the reason is unknown. Platelets mediate vascular occlusion through thrombotic functions but are also recognized to have immunomodulatory activity. To determine if platelet processes are activated during influenza infection, we collected blood from 18 patients with acute influenza infection. Microscopy reveals activated platelets, many containing viral particles and extracellular-DNA associated with platelets. To understand the mechanism, we isolate human platelets and treat them with influenza A virus. Viral-engulfment leads to C3 release from platelets as a function of TLR7 and C3 leads to neutrophil-DNA release and aggregation. TLR7 specificity is confirmed in murine models lacking the receptor, and platelet depletion models support platelet-mediated C3 and neutrophil-DNA release post-influenza infection. These findings demonstrate that the initial intrinsic defense against influenza is mediated by platelet-neutrophil cross-communication that tightly regulates host immune and complement responses but can also lead to thrombotic vascular occlusion.


Conflict of interest statement

The authors declare no competing interests.

Figures

Fig. 1
Fig. 1
Characterization of human blood from influenza-infected patients. ad Blood from influenza-infected patients was fixed after intravenous collection and stained as described in Methods. In all cases DNA was assessed by DAPI. a Many platelets appeared similar to those observed in control blood from healthy donors with a size of 2–5 µm. b Some platelets from influenza-infected patients had undergone spreading with a distinctive distribution of CD41. c Platelets and platelet microparticles associated with DNA (arrow). d Spread platelets were found surrounding released DNA with distinct DNA content in their center. Of note, blood from influenza-infected patients and controls in (ad) was not permeabilized. Since formaldehyde can cause certain levels of permeabilization as a function of cross-linking positive staining in control samples for H4 and MPO do not necessarily indicate activation. eg Levels of proteins related to DNA release in the plasma of influenza-infected patients assessed by ELISA. Source data are provided as a Source Data file. e neutrophil elastase, f myeloperoxidase (MPO), and g histone nucleosome core. The graphs represent the average ± SD of healthy donors (n = 15) and influenza-infected patients (n = 18); significance for (eg) was assessed by Mann–Whitney U test, star symbol (*) indicates p < 0.0001. h, i To synchronize time of influenza presence as a function of infection and quantify the released DNA, we treated blood from human donors for 30 min with sucrose-purified infectious influenza (WSN/33) at constant rotation and 37 °C. Influenza was used at 1 pfu to 100 platelets. h Representative images of blood from 3 donors with influenza and one (out of 3) healthy control and i their quantitation. Of note, in certain cases the DNA is not entirely covered with platelets, suggesting differences in kinetics of interaction and/or a physiological relationship that needs further in vivo characterization. Data in graph is represented as average ± SD of n = 3 different donors; significance was assessed by unpaired t-test (two-tailed value) and star symbol (*) indicates p = 0.0019, df = 4
Fig. 2
Fig. 2
Influenza particles are found in platelets by confocal microscopy. 50 μL of intravenous blood drawn from a influenza positive patients or healthy donors. Blood was fixed (RBCs were lysed) and samples were later stained with antibodies for the nuclear protein for influenza A (green) or influenza B (green, yellow = green and red combined), for platelets stained with CD41-APC (red), and DNA from neutrophils (white). Arrows point toward the influenza (green) staining. Representative images are shown from n = 10 different patients. Confocal microscopy of b platelets isolated from healthy donors and incubated with WSN/33, at 1 pfu to 100 platelets, for 30 min, at 1000 rpm, 37 °C. Platelets were fixed, permeabilized, and stained with the same antibodies as in (a). Representative images of n = 4 (2F, 2M) are shown
Fig. 3
Fig. 3
Transmission electron microscopy of influenza particles in platelets. a Transmission electron microscopy (TEM) of isolated human platelets incubated with WSN/33 influenza (1 pfu to 10 platelets) at different time points but under the same conditions as in (b). Platelets were fixed for 10 min immediately after incubation and processed for electron microscopy. b Quantitation of the time course of internalization of influenza by isolated platelets in (c). The graphs represent the analysis of n = 10 platelets per time point. c TEM of platelets isolated from uninfected (control) and influenza-infected patients. Representative images are shown from three different influenza patients. In all cases, red arrows point toward the viral particle
Fig. 4
Fig. 4
Stages of phagocytosis in platelets’ internalization of influenza. Phagocytic morphological features of influenza internalization by platelets was assessed by TEM. a Representative images of different stages of phagosome-like structures assessed by morphological features captured in platelets from healthy human donors incubated with WSN/33 influenza (1 pfu to 10 platelets) at different time points. Five distinct stages can be observed in human platelets. b TEM of the negative stain of influenza virus (only)
Fig. 5
Fig. 5
Influenza mediates C3 release from platelets through TLR7. a C3 in plasma from healthy donors (n = 14) and influenza-infected patients (n = 18). The graphs represent the average ± SD; significance was assessed by Mann–Whitney U test, *p < 0.0001. b C3 release from human platelets that express TLR7 (assessed by qPCR) had been isolated from healthy donors and mixed with influenza strain WSN/33 at a proportion of 1 pfu to 100 platelets (n = 4, 3F, 1M); p < 0.0001, F = 27.49, df = 3. c C3 release from human platelets that do not express TLR7 (assessed by qPCR) treated as in (b). Graph is representative of n = 3 different blood draws; p = 0.2813, F = 1.833, df = 3. d C3 release from human platelets from the same donors as in (b) treated with the TLR7 agonist loxoribine 1 mM in the presence or absence of TLR7 inhibitor IRS661; p = 0.0086, F = 7.989, df = 3. bd Data in graphs are represented as average ± SD; significance was assessed using ANOVA followed by Bonferroni multiple comparison test and star symbol (*) indicates p < 0.05. Source data for (ad) are provided as a Source Data file. e Confocal images of permeabilized isolated platelets from influenza-infected patient stained for flu-FITC; TLR7-APC; lysosomal marker CD63-BV421. f Confocal images of isolated healthy human platelets incubated with WSN/33 for 30 min (1 pfu to 10 platelets) and stained as in (e). e, f Representative images of platelets from n = 4 (2M, 2F) different donors are shown
Fig. 6
Fig. 6
Role of platelet GM-CSF and C3 in neutrophil-DNA release. ac Isolated human platelets and neutrophils were incubated together or by themselves for 30 min (at constant rotation and 37 °C) in the presence of TLR agonists [TLR7 (Loxo)—1 mM; TLR2 (Pam3CSK4, PAM)—10 μg/μL] or thrombin (IIa)—0.05 U/mL. GM-CSF release from a platelets (p = 0.8903, F = 0.2071, df = 3), b neutrophils (p = 0.7255, F = 0.4422, df = 3), and c platelets and neutrophils incubated together was measured by ELISA (p = 0.0200, F = 4.116, df = 3). The graphs represent the average fold change for each individual of n = 6 (3F; 3M) ± SD. d Confocal images of isolated human neutrophils treated with C3 (30 ng/mL) and neutrophils treated with C3 in the presence of GM-CSF (25 ng/mL). Neutrophils were treated in HEPES-modified Tyrode’s buffer (0.04 × 105 neutrophils/μL) for 30 min at 37 °C, and constant rotation (aggregometer). At the end, cells were fixed and stained [CD41-FITC-platelets (green); H4-AF637-histone (red); DAPI-DNA (blue)]. Neutrophil-DNA aggregates were visualized by confocal microscopy. Images are representatives of n = 4 different donors. C3-treated neutrophils from healthy donors release their DNA and form large aggregates. e Quantitation of (d). The graph (n = 4, 2F, 2M) is represented as average (p < 0.0001, F = 71.42, df = 3) ± SD. Significance in (ac, e) was assessed using ANOVA followed by Bonferroni multiple comparison test and star symbol (*) indicates p < 0.05. Source data are provided as a Source Data file
Fig. 7
Fig. 7
Platelet-TLR7 solely mediates neutrophil-DNA release through C3. Platelets and neutrophils were isolated from human blood. Each population was pretreated for 15 min with a TLR7 agonist (1 mM Loxoribine, Loxo) and then incubated with the other population for 30 min. All experiments were carried out at an approximately physiological ratio of 50 platelets:1 neutrophil. a Confocal microscopy of the incubated cells. Cells were stained with (CD41-FITC-platelets; CD66b-APC-neutrophils; DAPI-DNA) and visualized with a confocal microscope. b Quantitation of the confocal images in (a), p = 0.017, F = 6.624; df = 2. c DNA release from neutrophils in the presence of platelets pretreated with a C3 inhibitor, compstatin (0.088 mg/mL) for 10 min and then stimulated with Loxo for 30 min (p = 0.0033, F = 11.51, df = 2). d Assessment of neutrophil-DNA release by confocal images of isolated platelets and neutrophils treated with influenza WSN/33 in the presence or absence of the TLR7 inhibitor IRS661. e Quantitation of the confocal images in (d), p < 0.0001; F = 61.07, df = 3. In all cases data in the graphs are represented as the average ± SD. Statistical significance was measured by ANOVA followed by a Bonferroni follow-up test of n = 4 (2F and 2M, with the exception of (e), where we used 3F and 1M), star symbol (*) indicates p < 0.05. Source data for all graphs are provided as a Source Data file
Fig. 8
Fig. 8
Platelet-TLR7mediates release of MPO from neutrophils. Isolated human platelets and neutrophils were incubated together or by themselves for 30 min, at 37 °C and constant rotation, in the presence of TLR agonists [TLR7 (Loxo)—1 mM; TLR2 (Pam)—10 μg/mL] or thrombin (IIa)—0.05 U/mL. Myeloperoxidase (MPO) release from neutrophils was measured in the a absence (p = 0.7206, F = 0.4493, df = 3) and b presence of platelets by ELISA (p = 0.0002, F = 10.4, df = 3). The graphs represent the average fold change for each individual of n = 6 (3F; 3M) ± SD. Source data are provided as a Source Data file. Significance was measured by ANOVA followed by Bonferroni follow-up test; in all cases star symbol (*) indicates p < 0.05
Fig. 9
Fig. 9
TLR7 stimulation in vivo leads to DNA release from Ly6G positive cells. WT and TLR7 KO mice were injected intraperitoneally with a TLR7 agonist, or were intranasally infected with influenza (PR8 strain, 40,000 pfu in 30 µL). Blood was collected by cardiac puncture at 24 h and immediately fixed (red blood cells were lysed at the same time); Ly6G is predominantly expressed by murine neutrophils. a Representative images of DNA release from Ly6G-positive cells (at 24 h post-Loxo stimulation) resolved by confocal microscopy. b Quantitation of DNA release from Ly6G-positive cells in blood of mice (n = 4/group) at 24 h after agonist stimulation (p = 0.016, df = 6). c Representative images of DNA release (at 24 h post influenza infection) resolved by confocal microscopy. Pictures showing Ly6G-highly positive origin of the released DNA are included in Supplementary Fig. 11. d Quantitation of the DNA release from Ly6G-positive cells in blood of mice (n = 4/group) at 24 h post-infection (p < 0.001, df = 6). In all cases, the bar represents 10 μm and values in the bar graphs represent the average ± SD; star symbol (*) indicates p < 0.05. Significance was assessed by unpaired t-test (two-tail value). Source data are provided as a Source Data file
Fig. 10
Fig. 10
Platelets contribute to C3 and Ly6G-DNA release in vivo. Platelets were eliminated from male mice with antiplatelet antibody CD42 (αPlt) and compared to control IgG. At 24 h post elimination, mice were infected with the PR8 strain of influenza (as in Fig. 8). a Confocal microscopy of blood showing DNA release in murine blood 3–4 days post-infection. Images are representative of n = 4 mice/group. b Quantitation of the confocal images in (a). Graph is a representative of 4 mice/group (p = 0.0003, F = 14.26, df = 3). c C3 levels in murine plasma at the same time as in (a). The graph represents the average levels ± SD, n = 4 mice/group, with the exception of IgG+sal, where n = 3 mice were used (p = 0.0415, F = 4.733, df = 3). Significance was measured by ANOVA followed by Bonferroni follow-up test; in all cases star symbol (*) indicates p < 0.05. d Gene expression levels of influenza RNA in isolated murine platelets 12 days post-infection (n = 4 of IgG+flu; n = 4 of αPlt+flu). The graph represents average expression ± SD; significance was calculated by two-tailed unpaired t-test, p = 0.0715, df = 6. Of note, Mann–Whitney non-parametric t-test gave p = 0.0286. Source data are provided as a Source Data file. Abbreviations: IgG—control antibody; αPlt—antiplatelet CD42b antibody; Sal—phosphate buffered saline: e Proposed mechanism of platelet-mediated neutrophil-DNA release during influenza infection. During influenza infection, virions cross into the circulation and become engulfed by platelets. Influenza virions lead to the release of complement C3 from platelets in a platelet-TLR7-dependent manner. C3 in turn activates neutrophils to release their DNA and leads to the formation of platelet–neutrophil aggregates that can circulate freely in blood. Aggregates of this nature can increase the risk for thrombosis and potentially lead to unstable coronary syndrome when there is vessel stenosis or inflamed endothelium

References

    1. Center for Disease Control. CDC WONDER. Underlying Cause of Death 1999–2016. https://wonder.cdc.gov/ucd-icd10.html (1999–2016).
    1. Kwong JC, et al. Acute myocardial infarction after laboratory-confirmed influenza infection. N. Engl. J. Med. 2018;378:345–353. doi: 10.1056/NEJMoa1702090. - DOI - PubMed
    1. Barnes M, et al. Acute myocardial infarction and influenza: a meta-analysis of case-control studies. Heart. 2015;101:1738–1747. doi: 10.1136/heartjnl-2015-307691. - DOI - PMC - PubMed
    1. Koupenova M, Ravid K. Biology of platelet purinergic receptors and implications for platelet heterogeneity. Front. Pharmacol. 2018;9:37. doi: 10.3389/fphar.2018.00037. - DOI - PMC - PubMed
    1. Koupenova M, Clancy L, Corkrey HA, Freedman JE. Circulating platelets as mediators of immunity, inflammation, and thrombosis. Circ. Res. 2018;122:337–351. doi: 10.1161/CIRCRESAHA.117.310795. - DOI - PMC - PubMed

Publication types

MeSH terms