. 2019 Apr 16;10(1):1787.
doi: 10.1038/s41467-019-09853-z.

Stem cell-associated heterogeneity in Glioblastoma results from intrinsic tumor plasticity shaped by the microenvironment

Affiliations

Stem cell-associated heterogeneity in Glioblastoma results from intrinsic tumor plasticity shaped by the microenvironment

Anne Dirkse et al. Nat Commun. .

Abstract

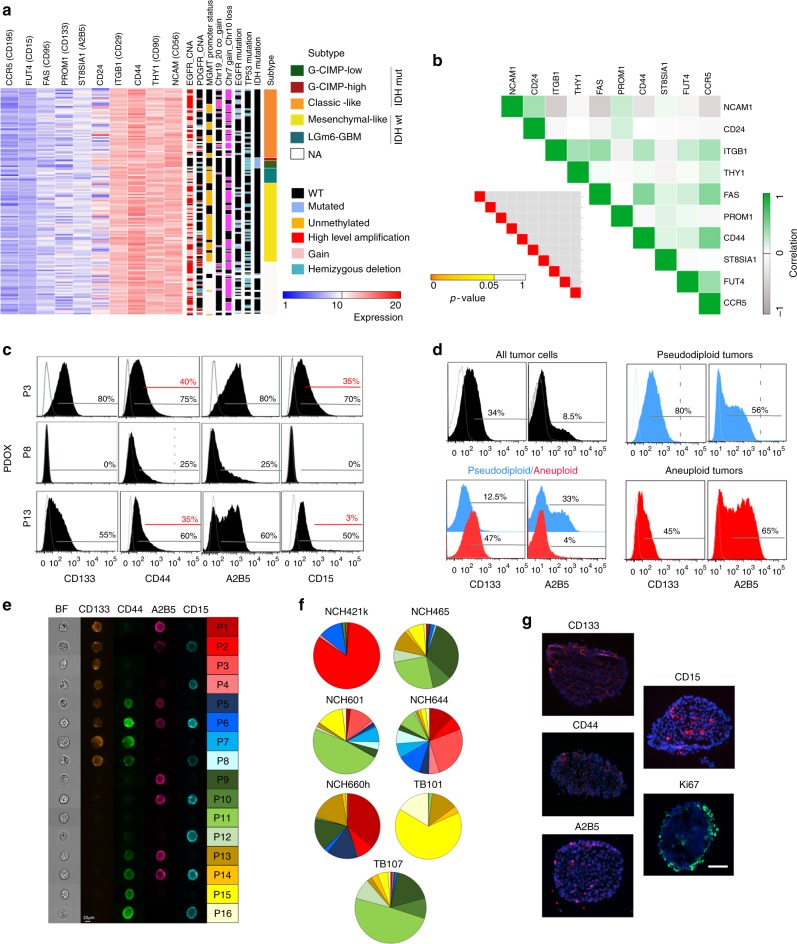
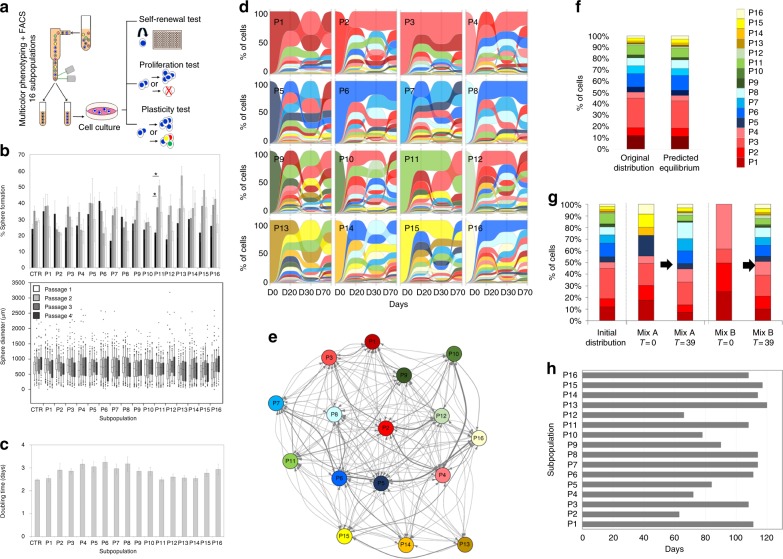
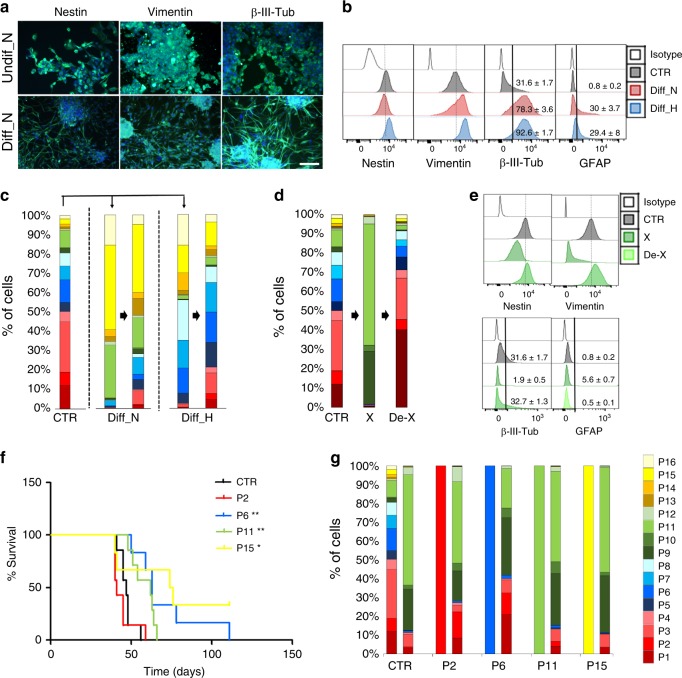
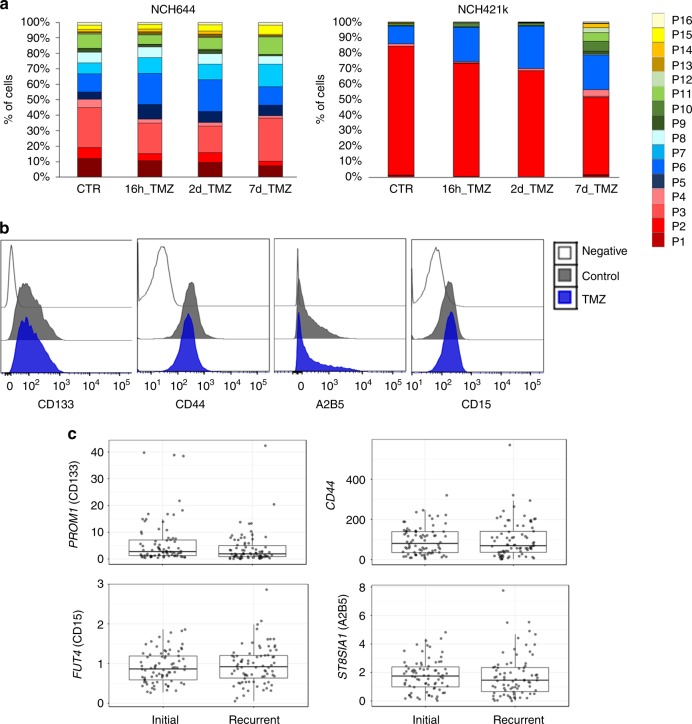
The identity and unique capacity of cancer stem cells (CSC) to drive tumor growth and resistance have been challenged in brain tumors. Here we report that cells expressing CSC-associated cell membrane markers in Glioblastoma (GBM) do not represent a clonal entity defined by distinct functional properties and transcriptomic profiles, but rather a plastic state that most cancer cells can adopt. We show that phenotypic heterogeneity arises from non-hierarchical, reversible state transitions, instructed by the microenvironment and is predictable by mathematical modeling. Although functional stem cell properties were similar in vitro, accelerated reconstitution of heterogeneity provides a growth advantage in vivo, suggesting that tumorigenic potential is linked to intrinsic plasticity rather than CSC multipotency. The capacity of any given cancer cell to reconstitute tumor heterogeneity cautions against therapies targeting CSC-associated membrane epitopes. Instead inherent cancer cell plasticity emerges as a novel relevant target for treatment.


Conflict of interest statement

The authors declare no competing interests.

Figures

Fig. 1
Fig. 1
CSC-associated heterogeneity in GBM. a Inter-patient heterogeneity at the gene expression level for a panel of CSC-associated markers. See also Supplementary Fig. 1. b Pearson analysis did not reveal any significant correlation. c Flow cytometric analysis of tumor cells in GBM PDOXs. Percentage of positive cells (black gate) is indicated vs. negative control and vs. high expressing cells (red gate). See Supplementary Fig. 2 for gating strategy and Supplementary Fig. 3 for more examples. d Marker expression profiles in the genetically heterogeneous PDOX T16 (all tumor (black), pseudodiploid (blue), and aneuploid (red) clones). Separately implanted pseudodiploid (blue) and aneuploid clones (red) adapted the CSC-associated profiles in the xenograft (right). e Multicolor phenotyping. Representative ImageStream data shown for NCH644. Right panel: color code for 16 subpopulations applied in all figures. f Distribution of subpopulations in seven patient-derived GBM cultures (mean %, error bars ommitted for visualization purpose). g Distribution of CSC-associated markers and Ki67 proliferating cells in 3D spheres (scale bar = 100 µm)
Fig. 2
Fig. 2
GBM subpopulations undergo state transitions in a non-hierarchical manner. a Experimental setup of FACS sorting and functional analysis performed on 16 subpopulations (NCH644). See Supplementary Fig. 2E for gating strategy. b Self-renewal test, including sphere formation (mean + /− SEM) and sphere diameter (Box limits indicate the 25th and 75th percentiles and center lines show the medians as determined by R software; whiskers represent the extreme low and high observed values, unless those are above 1.5 times interquartile range (IQR)—thereby whiskers are limited to 1.5 IQR. All outlying data points are represented by dots). Bulk cells were used as control (CTR). No statistical difference observed, except for P11 passages 1 vs. 2 and 1 vs. 3 (*p-value ≤ 0.05, Kruskal–Wallis test). c Proliferation test (mean doubling time + /− SEM). No statistical difference observed. d Multipotency test. Marker expression over time: FACS-sorting day 0 (D0) and re-phenotyping after 20 (D20), 30 (D30), and 70 (D70) days in culture. The order of subpopulations in alluvial plots is based on highest to lowest percentage at each time point. See an alternative representation in Supplementary Fig. 5A for column chart and Supplementary Data 2A for statistics (color code in Fig. 1e). e Markov modeling of state transitions between 16 subpopulations. Arrows represent predicted direct state transitions between subpopulations, thickness of lines corresponds to transition probabilities. See Supplementary Fig. 5C for transition matrix. f Proportions of subpopulations predicted in equilibrium state is similar to initial culture. g Validation of Markov modeling. FACS-sorted admixtures (time 0) were re-phenotyped at the predicted equilibrium time (39 days) showing the accuracy of the mathematical model. See Supplementary Data 1A for statistics. h Predicted time to reach equilibrium for each subpopulation
Fig. 3
Fig. 3
Adaptation of GBM subpopulations to hypoxia. a Distribution of subpopulations in hypoxia (H). Normoxia (N) is shown as control (CTR) and hypoxia (H) at 16 h, 48 h, 7 days, and 60 days. Data shown for NCH644, additional cultures in Supplementary Fig. 4C. See statistics in Supplementary Data 1B, color code in Fig. 1e. b Self-renewal test of 16 subpopulations in hypoxia, including sphere formation (mean + /− SEM) and sphere diameter (Box limits indicate the 25th and 75th percentiles and center lines show the medians as determined by R software; whiskers represent the extreme low and high observed values, unless those are above 1.5 times interquartile range (IQR)—thereby whiskers are limited to 1.5 IQR. All outlying data points are represented by dots). Bulk cells were used as control (CTR). Statistical differences within the same subpopulations are shown (*p-value ≤ 0.05, Kruskal–Wallis test, see Supplementary Data 4B for statistics). c Proliferation test in hypoxia (mean doubling time + /− SEM). Bulk cells were used as control (CTR). Statistical difference was only found between P7 and P13 (mixed linear model). d Distribution of 16 subpopulations at day 0 (left) and after 60 days in hypoxia (right) (see Supplementary Data 2B for statistics). e Markov modeling of state transitions in hypoxia. Arrows represent direct state transitions between subpopulations, thickness of lines corresponds to transition probabilities. See Supplementary Fig. 5E for transition matrix. f Predicted time needed to reach equilibrium for each subpopulation in hypoxia
Fig. 4
Fig. 4
Reversible phenotypic changes. a Examples of adherent GBM cells in stem cell (Undiff_N) or differentiation (Diff_N) conditions in normoxia. See Supplementary Fig. 6A for hypoxia (scale bar = 200 µm). b Flow cytometric analysis of intracellular markers in control 3D sphere cultures (CTR), differentiation (Diff) conditions. N normoxia, H hypoxia. Black lines discriminate between negative and positive cells (mean + /− SEM, n = 3). Dotted line indicates mode expression in control cells. See also Supplementary Fig. 6B, C. c Distribution of subpopulations under different environmental conditions, phenotyping performed after 14 days of change (left) and 14 days after reverting to control culture (right). See Supplementary Data 1D for statistics and Supplementary Fig. 6D for more examples. d Distribution of subpopulations in xenografted NCH644 tumors in vivo (X) and after regrowth in vitro (De-X). Normoxia cultures are shown as control (CTR). See Supplementary Data 1F for statistics and Supplementary Fig. 6E, F for more examples. e Flow cytometric analysis of intracellular markers. Black lines discriminate between negative and positive cells (mean + /− SEM, n = 3). Dotted line indicate mode expression in control cells. f Kaplan–Meier survival curves of xenotransplanted mice. Subpopulations P2, P6, P11, and P15 were implanted directly after FACS. FACS-sorted bulk cells were used as control (CTR) (*p-value ≤ 0.05; **p-value ≤ 0.01, long-rank test). g Distribution of subpopulations in xenografted tumors. For each subpopulation, day of implant and day of mouse sacrifice are presented. See Supplementary Data 1H for statistics
Fig. 5
Fig. 5
Distinct phenotypic states carry similar transcriptome. a Overall gene expression relationship between single cells of three GBM PDOXs and two GBM cultures. Patient-derived cells are color coded. b Expression of marker genes in NCH644 (expression gradient color coded). See Supplementary Fig. 7 for more examples. c Estimation of cell cycle state of individual cells on the basis of relative expression of G1/S and G2/M gene sets. d Gene expression relationship between subpopulations P2 and P6 and the original heterogeneous GBM cultures (Control = CTR). Each sample is color coded. See Supplementary Fig. 7C, D for further analysis
Fig. 6
Fig. 6
Phenotypic heterogeneity in GBM after treatment. a Distribution of subpopulations upon TMZ treatment. Cultures were treated with TMZ for 16 h, 2 days, and 7 days. See Supplementary Data 1I, J for statistics. b Phenotyping of tumor cells revealed no changes of marker expression upon TMZ treatment in vivo (PDOX T16). c Comparative gene expression analysis of genes coding for four cell membrane markers in paired primary and recurrent IDHwt GBM samples (n = 78) based on RNA-seq data from the RecuR cohort. Box limits indicate the 25th and 75th percentiles and center lines show the medians as determined by R software; whiskers represent the extreme low and high observed values, unless those are above 1.5 times interquartile range (IQR)—thereby whiskers are limited to 1.5 IQR. All outlying data points are represented by dots. No significant statistical differences were detected (two sided paired t-test)

References

    1. Prager BC, Xie Q, Bao S, Rich JN. Cancer stem cells: the architects of the tumor ecosystem. cell stem cell. 2019;24:41–53. doi: 10.1016/j.stem.2018.12.009. - DOI - PMC - PubMed
    1. Tirosh I, et al. Single-cell RNA-seq supports a developmental hierarchy in human oligodendroglioma. Nature. 2016;539:309–313. doi: 10.1038/nature20123. - DOI - PMC - PubMed
    1. Venteicher Andrew S., Tirosh Itay, Hebert Christine, Yizhak Keren, Neftel Cyril, Filbin Mariella G., Hovestadt Volker, Escalante Leah E., Shaw McKenzie L., Rodman Christopher, Gillespie Shawn M., Dionne Danielle, Luo Christina C., Ravichandran Hiranmayi, Mylvaganam Ravindra, Mount Christopher, Onozato Maristela L., Nahed Brian V., Wakimoto Hiroaki, Curry William T., Iafrate A. John, Rivera Miguel N., Frosch Matthew P., Golub Todd R., Brastianos Priscilla K., Getz Gad, Patel Anoop P., Monje Michelle, Cahill Daniel P., Rozenblatt-Rosen Orit, Louis David N., Bernstein Bradley E., Regev Aviv, Suvà Mario L. Decoupling genetics, lineages, and microenvironment in IDH-mutant gliomas by single-cell RNA-seq. Science. 2017;355(6332):eaai8478. doi: 10.1126/science.aai8478. - DOI - PMC - PubMed
    1. Patel AP, et al. Single-cell RNA-seq highlights intratumoral heterogeneity in primary glioblastoma. Science. 2014;344:1396–1401. doi: 10.1126/science.1254257. - DOI - PMC - PubMed
    1. Lan X, et al. Fate mapping of human glioblastoma reveals an invariant stem cell hierarchy. Nature. 2017;549:227–232. doi: 10.1038/nature23666. - DOI - PMC - PubMed

Publication types

MeSH terms

Substances