. 2019 Apr 16;10(1):1767.
doi: 10.1038/s41467-019-09764-z.

Microbial and metabolic succession on common building materials under high humidity conditions

Affiliations

Microbial and metabolic succession on common building materials under high humidity conditions

Simon Lax et al. Nat Commun. .

Abstract

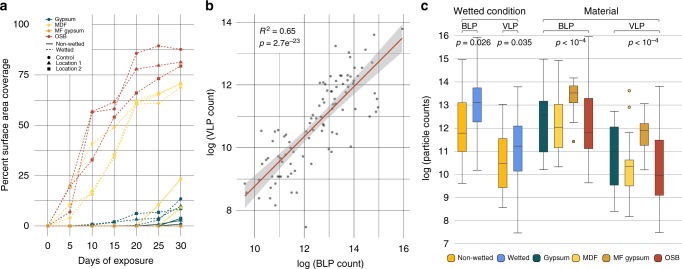
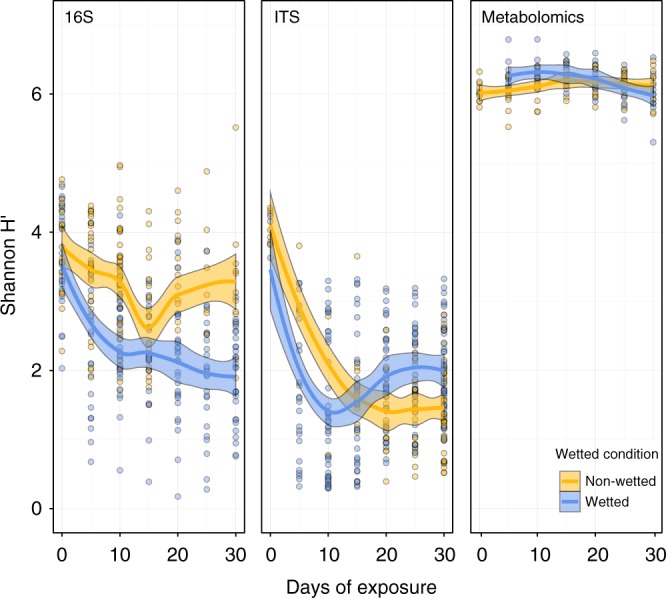
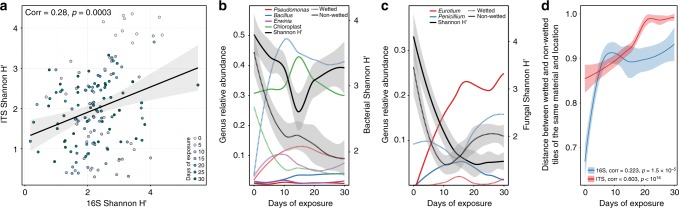
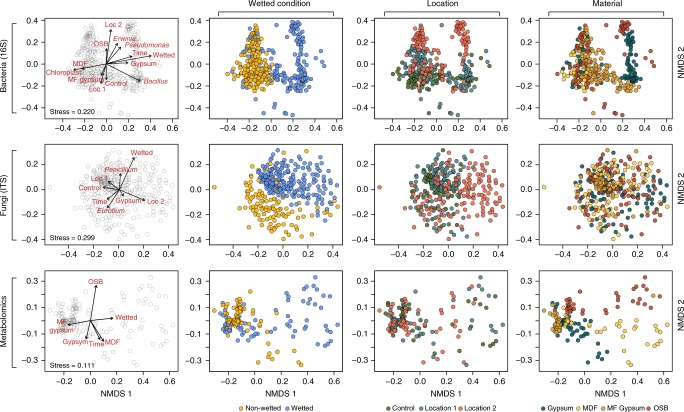
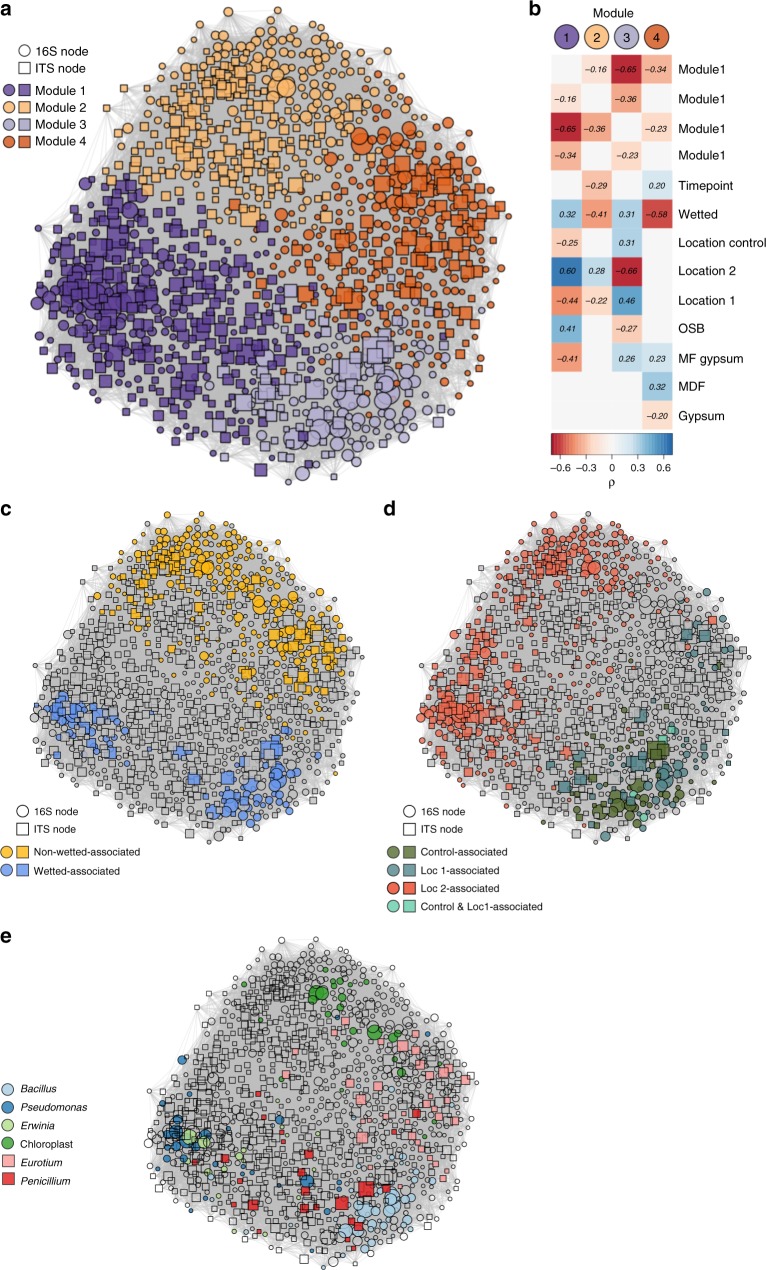
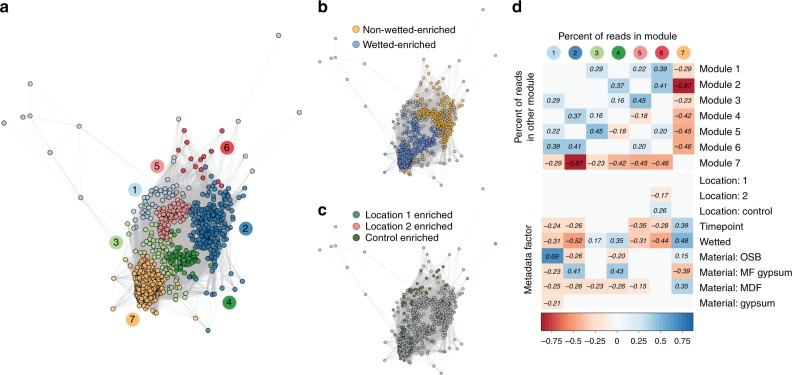
Despite considerable efforts to characterize the microbial ecology of the built environment, the metabolic mechanisms underpinning microbial colonization and successional dynamics remain unclear, particularly at high moisture conditions. Here, we applied bacterial/viral particle counting, qPCR, amplicon sequencing of the genes encoding 16S and ITS rRNA, and metabolomics to longitudinally characterize the ecological dynamics of four common building materials maintained at high humidity. We varied the natural inoculum provided to each material and wet half of the samples to simulate a potable water leak. Wetted materials had higher growth rates and lower alpha diversity compared to non-wetted materials, and wetting described the majority of the variance in bacterial, fungal, and metabolite structure. Inoculation location was weakly associated with bacterial and fungal beta diversity. Material type influenced bacterial and viral particle abundance and bacterial and metabolic (but not fungal) diversity. Metabolites indicative of microbial activity were identified, and they too differed by material.


Conflict of interest statement

The authors declare no competing interests.

Figures

Fig. 1
Fig. 1
Microbial growth rates vary across sample types. a Percent of surface area covered by visible microbial growth through time (n = 168, 4 materials, 3 locations, 2 wetting conditions, 7 time points). Color indicates coupon material, point shape indicates inoculating location, and line type indicates whether the coupon was wet before incubation. b Correlation in the counts of bacteria-like (BLP) and viral-like particles (VLP) across all coupons (n = 96 samples, 4 materials, 3 locations, 2 wetting conditions, 4 time points). c Boxplots of BLP and VLP counts by wetting condition and by material (n = 96 samples). Box boundaries correspond to the first and third quartiles and whiskers extend to the largest values no further than 1.5 times the distance between the first and third quartiles. Source data are provided as a Source Data file
Fig. 2
Fig. 2
Change in the Shannon Index of samples over time. Points represent individual samples and the trend lines are a smoothed moving-average of the mean and shaded regions indicate the standard error (n = 338, 330, and 144 samples for 16S, ITS, and Metabolomics, respectively)
Fig. 3
Fig. 3
Overview of community succession. a Fungal diversity and bacterial diversity are significantly correlated across communities (n = 153 samples). Points represent individual samples, colored by the time point at which the sample was taken. b Changes in the relative abundance of selected bacterial genera over the course of succession (n = 338 samples). Lines represent a smoothed moving-average of the mean. Genus is indicated by color and wetting condition is indicted by line style. Average community diversity (Shannon H′ at OTU level, as in Fig. 3) is indicated by black lines with standard error indicated by the gray-shaded region. Genus abundance is indicated on the left y-axis and Shannon H′ is indicated on the right y-axis. c Changes in the relative abundance of selected fungal genera over the course of succession (n = 330 samples). Formatting is as in b. d Wet vs. nonwetted replicates of coupons of the same material and inoculating location become increasingly dissimilar over the course of community succession (n = 338, 330 samples for 16S and ITS, respectively). The y-axis is the Bray−Curtis distance between replicates. Spearman correlation between community dissimilarity and time is indicated in the legend error
Fig. 4
Fig. 4
NMDS plots illustrate clustering of sample diversity by sample type. Each row comprises four identical NMDS plots (n = 338, 330, and 144 samples for 16S, ITS, and Metabolomics, respectively). The leftmost plot illustrates the ordination’s association with environmental variables and the remaining plots color sample points by various metadata factors. The stress on the NMDS plot is indicated in the rightmost plot in each row error. NMDS non-metric multi-dimensional scaling
Fig. 5
Fig. 5
Network of SparCC OTU correlations. a Edge-weighted, spring-embedded network ordination, with nodes colored by module membership. Node shape represents node type (16S or ITS) and node size is based on the log-transformed abundance of each node (n = 153 with both 16S and ITS, respectively). b Correlations between metadata factors (treated as dummy variables where true = 1 and false = 0) and the percent of reads in network modules. Nonsignificant correlations are not shown. c Taxa enriched in wet or nonwetted samples, as determined through a two-sided nonparametric t test with 105 permutations. d Taxa enriched in samples originating from an individual inoculating location, with statistical methods as in a. e Taxonomy of nodes in the genera included in Fig. 4
Fig. 6
Fig. 6
Metabolite co-occurrence network. a Network of significantly positive Spearman correlations between metabolites, with network module indicated by color (n = 144 samples). b Metabolites enriched in wet or nonwetted samples, as determined through a two-sided nonparametric t test with 105 permutations. c Metabolites enriched in samples originating from an individual inoculating location, with statistical methods as in b. d Correlations between metadata factors (treated as dummy variables where true = 1 and false = 0) and the percent of metabolites in network modules. Nonsignificant correlations are not shown

Similar articles

Cited by

References

    1. Lax S, et al. Bacterial colonization and succession in a newly opened hospital. Sci. Transl. Med. 2017;9:eaah6500. doi: 10.1126/scitranslmed.aah6500. - DOI - PMC - PubMed
    1. Adams RI, et al. Ten questions concerning the microbiomes of buildings. Build. Environ. 2016;109:224–234. doi: 10.1016/j.buildenv.2016.09.001. - DOI
    1. Chase J, et al. Geography and location are the primary drivers of office microbiome composition. MSystems. 2016;1:e00022-16. doi: 10.1128/mSystems.00022-16. - DOI - PMC - PubMed
    1. Stephens B. What have we learned about the microbiomes of indoor environments? MSystems. 2016;1:e00083-16. doi: 10.1128/mSystems.00083-16. - DOI - PMC - PubMed
    1. Lax S, et al. Longitudinal analysis of microbial interaction between humans and the indoor environment. Science. 2014;345:1048–1052. doi: 10.1126/science.1254529. - DOI - PMC - PubMed

Publication types

Substances