. 2019 Apr 16;10(1):1776.
doi: 10.1038/s41467-019-09718-5.

Polygenic prediction via Bayesian regression and continuous shrinkage priors

Affiliations

Polygenic prediction via Bayesian regression and continuous shrinkage priors

Tian Ge et al. Nat Commun. .

Abstract

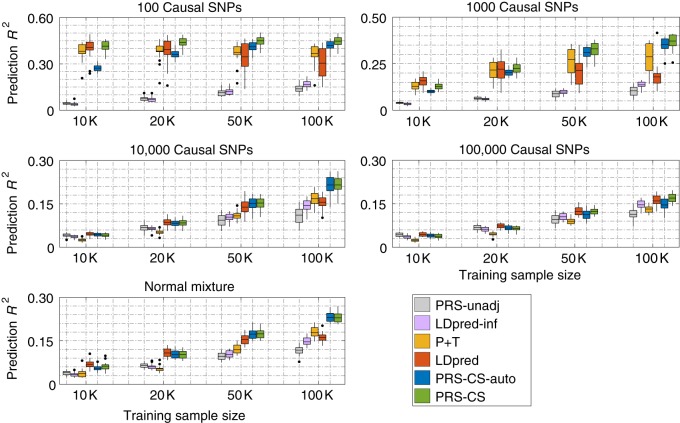
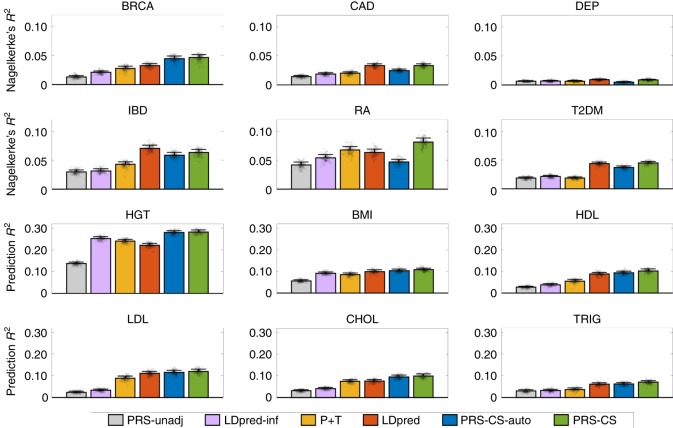
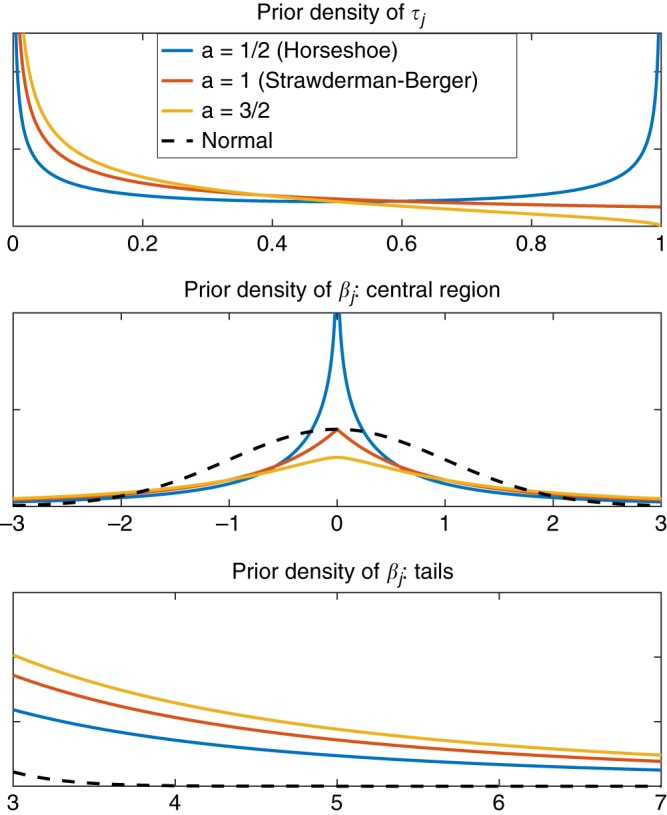
Polygenic risk scores (PRS) have shown promise in predicting human complex traits and diseases. Here, we present PRS-CS, a polygenic prediction method that infers posterior effect sizes of single nucleotide polymorphisms (SNPs) using genome-wide association summary statistics and an external linkage disequilibrium (LD) reference panel. PRS-CS utilizes a high-dimensional Bayesian regression framework, and is distinct from previous work by placing a continuous shrinkage (CS) prior on SNP effect sizes, which is robust to varying genetic architectures, provides substantial computational advantages, and enables multivariate modeling of local LD patterns. Simulation studies using data from the UK Biobank show that PRS-CS outperforms existing methods across a wide range of genetic architectures, especially when the training sample size is large. We apply PRS-CS to predict six common complex diseases and six quantitative traits in the Partners HealthCare Biobank, and further demonstrate the improvement of PRS-CS in prediction accuracy over alternative methods.


Conflict of interest statement

The authors declare no competing interests.

Figures

Fig. 1
Fig. 1
Predictive performance of six polygenic prediction methods in simulation studies using a point-normal model and a normal mixture model. Heritability was fixed at 0.5. The 1000 Genomes Project European sample was used as an external linkage disequilibrium (LD) reference panel. Tuning parameters (P-value threshold in P+T, fraction of causal markers in LDpred, and global shrinkage parameter in PRS-CS) were selected in a validation data set. Prediction accuracy was quantified by R2 between the observed and predicted traits in an independent testing set. The upper four panels correspond to the four genetic architectures (100, 1000, 10,000, and 100,000 causal variants) simulated using the point-normal model. The lower panel corresponds to the normal mixture model. Within each panel, results for four different training sample sizes (10,000, 20,000, 50,000, and 100,000) are shown. On each box, the central mark is the mean across 20 simulations, the edges of the box are the 25th and 75th percentiles, the whiskers extend to the most extreme data points that are not considered outliers, and the outliers are plotted individually
Fig. 2
Fig. 2
Prediction accuracy of six polygenic prediction methods in the Partners HealthCare Biobank. Posterior effect sizes of single nucleotide polymorphisms (SNPs) were trained with large-scale genome-wide association summary statistics, using the 1000 Genomes Project European sample as an external linkage disequilibrium (LD) reference panel. Polygenic scores were applied to predict six curated common complex diseases—breast cancer (BRCA), coronary artery disease (CAD), depression (DEP), inflammatory bowel disease (IBD), rheumatoid arthritis (RA), and type 2 diabetes mellitus (T2DM), and six quantitative traits—height (HGT), body mass index (BMI), high-density lipoproteins (HDL), low-density lipoproteins (LDL), cholesterol (CHOL), and triglycerides (TRIG). The Partners HealthCare Biobank sample for each disease and quantitative phenotype was repeatedly and randomly split into a validation set comprising 1/3 of the data and a testing set comprising 2/3 of the data. Tuning parameters (P-value threshold in P+T, fraction of causal SNPs in LDpred, and global shrinkage parameter in PRS-CS) were selected in the validation data set, and the predictive performance was assessed in the testing set. For disease (case–control) phenotypes and quantitive traits, prediction accuracy was measured by the Nagelkerke’s R2 and R2, respectively, averaged across 100 random splits. The error bar indicates the standard deviation of prediction accuracy across 100 random splits. Prediction accuracy for each random split is overlaid on the bar plot (black circles)
Fig. 3
Fig. 3
Densities of the priors. Upper panel: Density of the three-parameter beta prior on the shrinkage factor τj with ϕ = 1, b = 1/2, and three different a values. Middle panel: Central region of the marginal prior density on the effect size βj with ϕ = 1, b = 1/2, and three different a values, in comparison with the standard normal density. Lower panel: Tails of the marginal prior density on the effect size βj with ϕ = 1, b = 1/2, and three different a values, in comparison with the standard normal density

References

    1. Chatterjee N, Shi J, Garca-Closas M. Developing and evaluating polygenic risk prediction models for stratified disease prevention. Nat. Rev. Genet. 2016;17:392–406. doi: 10.1038/nrg.2016.27. - DOI - PMC - PubMed
    1. Khera A, et al. Genome-wide polygenic scores for common diseases identify individuals with risk equivalent to monogenic mutations. Nat. Genet. 2018;50:1219–1224. doi: 10.1038/s41588-018-0183-z. - DOI - PMC - PubMed
    1. International Schizophrenia Consortium. Common polygenic variation contributes to risk of schizophrenia and bipolar disorder. Nature. 2009;460:748–752. - PMC - PubMed
    1. Vilhjálmsson B, et al. Modeling linkage disequilibrium increases accuracy of polygenic risk scores. Am. J. Hum. Genet. 2015;97:576–592. doi: 10.1016/j.ajhg.2015.09.001. - DOI - PMC - PubMed
    1. Zhang Y, Qi G, Park J, Chatterjee N. Estimation of complex effect-size distributions using summary-level statistics from genome-wide association studies across 32 complex traits. Nat. Genet. 2018;50:1318–1326. doi: 10.1038/s41588-018-0193-x. - DOI - PubMed

Publication types

MeSH terms