. 2019 Apr 16;9(1):6156.
doi: 10.1038/s41598-019-42531-0.

Metformin acutely lowers blood glucose levels by inhibition of intestinal glucose transport

Affiliations

Metformin acutely lowers blood glucose levels by inhibition of intestinal glucose transport

Olga Horakova et al. Sci Rep. .

Abstract

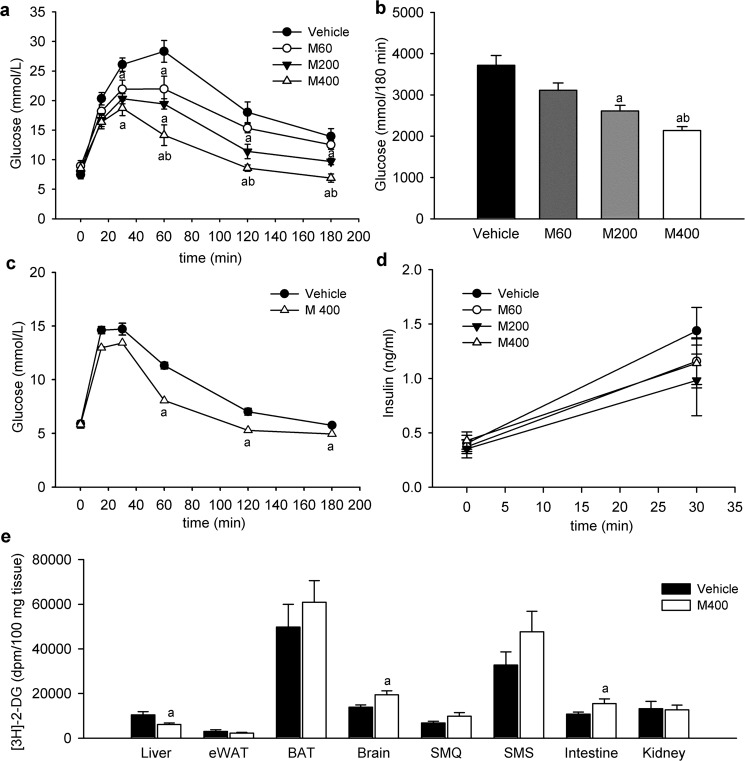
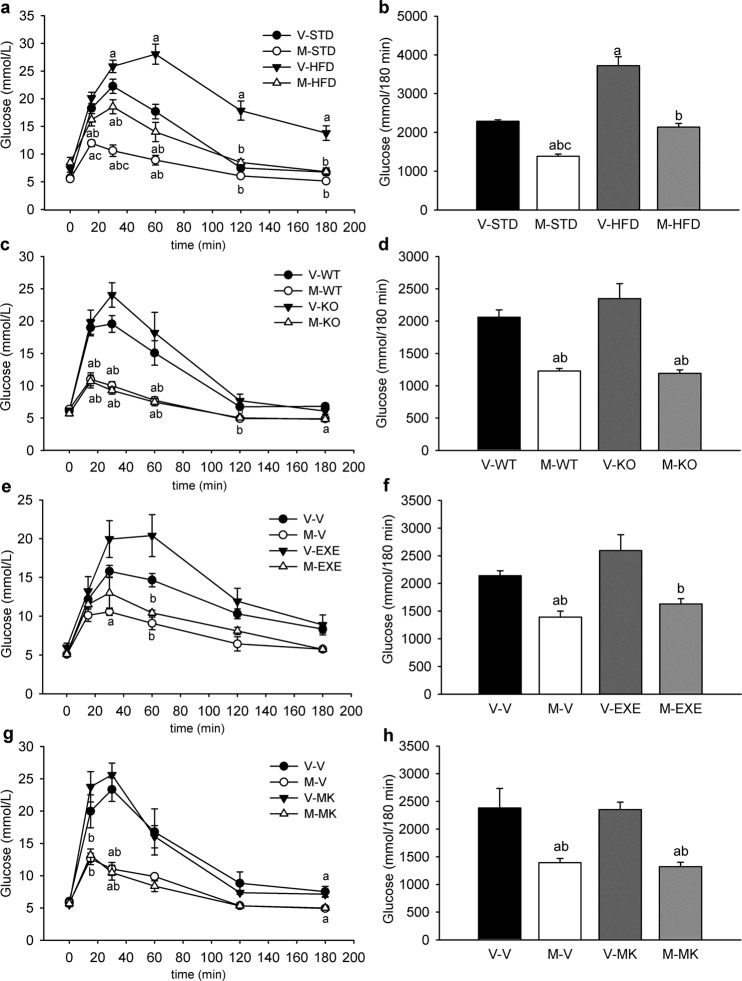
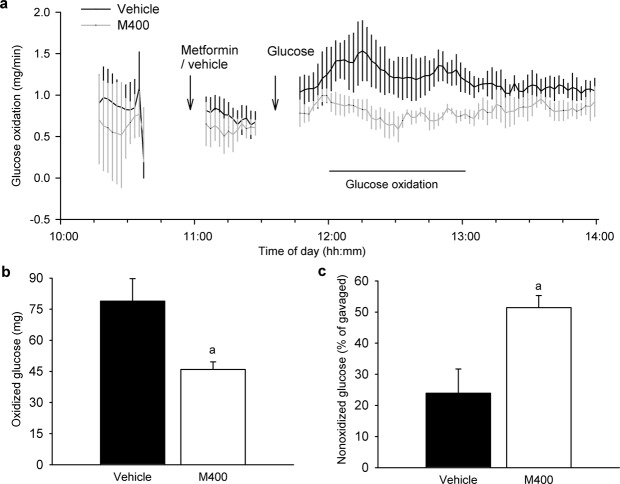
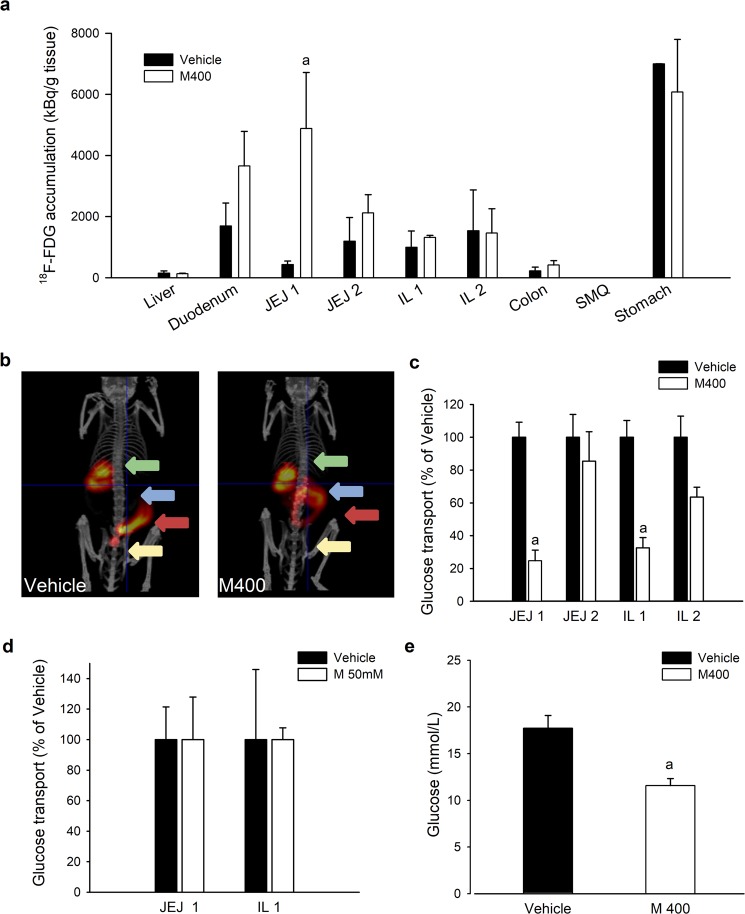
Metformin is currently the most prescribed drug for treatment of type 2 diabetes mellitus in humans. It has been well established that long-term treatment with metformin improves glucose tolerance in mice by inhibiting hepatic gluconeogenesis. Interestingly, a single dose of orally administered metformin acutely lowers blood glucose levels, however, little is known about the mechanism involved in this effect. Glucose tolerance, as assessed by the glucose tolerance test, was improved in response to prior oral metformin administration when compared to vehicle-treated mice, irrespective of whether the animals were fed either the standard or high-fat diet. Blood glucose-lowering effects of acutely administered metformin were also observed in mice lacking functional AMP-activated protein kinase, and were independent of glucagon-like-peptide-1 or N-methyl-D-aspartate receptors signaling. [18F]-FDG/PET revealed a slower intestinal transit of labeled glucose after metformin as compared to vehicle administration. Finally, metformin in a dose-dependent but indirect manner decreased glucose transport from the intestinal lumen into the blood, which was observed ex vivo as well as in vivo. Our results support the view that the inhibition of transepithelial glucose transport in the intestine is responsible for lowering blood glucose levels during an early response to oral administration of metformin.


Conflict of interest statement

The authors declare no competing interests.

Figures

Figure 1
Figure 1
Metformin improves glucose tolerance independently of changes in plasma insulin levels. Overnight fasted mice fed HFD for 8 weeks were first given either vehicle or metformin at a dose of 400 mg/kg body weight (M400), 200 mg/kg (M200), or 60 mg/kg (M60) by oral gavage, and 30 min later D-glucose was administered either orally at a dose of 3 mg/g body weight or intraperitoneally at a dose of 1 mg/g body weight to start OGTT and IPGTT, respectively. (a) Glycemic curves during OGTT, and (b) the corresponding AUC values (a–b; aP < 0.001 vs. vehicle; bP < 0.015 vs. M60; One-way ANOVA. (c) Glycemic curves during IPGTT (aP < 0.005 vs. vehicle; t-test). (d) Plasma insulin concentrations during OGTT (One-way ANOVA). (e) Tissue uptake of [3H]-2-DG administered by i.p. injections to metformin (M400) or vehicle-treated HFD mice, and assessed 60 min after the injection of [3H]-2-DG. eWAT, epididymal white adipose tissue; BAT, brown adipose tissue; SMQ, skeletal muscle (m. quadriceps); SMS, skeletal muscle (m. soleus). aP < 0.05 vs. vehicle; t-test. Data are means ± SEM (n = 6).
Figure 2
Figure 2
Metformin improves glucose tolerance independently of obesity, AMPK or GLP-1R and NMDAR signaling. Overnight fasted mice were given either vehicle (V) or metformin (M) at a dose of 400 mg/kg body weight by oral gavage, and 30 min later D-glucose was orally administered at a dose of 3 mg/g to start OGTT. (a) Glycemic curves during OGTT performed in STD- and HFD-fed mice treated with vehicle (V-STD and V-HFD mice) or metformin (M-STD and M-HFD mice), and (b) the corresponding AUC values. Data are means ± SEM (n = 6). aP < 0.001 vs. V-STD; bP < 0.001 vs. V-HFD; cP < 0.001 vs. M-HFD by One-way ANOVA. (c) Glycemic curves during OGTT performed in AMPKα2-KO (KO) or wild-type (WT) mice treated with vehicle (V-KO and V-WT mice) or metformin (M-KO and M-WT mice), and (d) the corresponding AUC values. Data are means ± SEM (n = 6). aP < 0.001 vs. V-WT; bP < 0.001 vs. V-KO by One-way ANOVA. (e) Glycemic curves during OGTT performed in mice treated either with vehicle (V) or Exendin 9–39 (EXE), which were given via i.p. injections 10 min before either metformin (M-V and M-EXE mice) or vehicle (V-V and V-EXE mice) administration, and (f) the corresponding AUC values. Data are means ± SEM (n = 6). aP < 0.005 vs. V-V; bP < 0.005 vs. V-EXE by One-way ANOVA. (g) Glycemic curves during OGTT performed in mice treated either with vehicle (V) or MK-801 (MK), which was given via i.p. injections 10 min before either metformin (M-V and M-MK mice) or vehicle (V-V and V-MK mice) administration, and (h) the corresponding AUC values. aP < 0.007 vs. V-V; bP < 0.007 vs. V-MK by One way ANOVA. Data are means ± SEM (n = 4–5).
Figure 3
Figure 3
Whole-body glucose oxidation is reduced in response to oral administration of metformin. Overnight fasted mice fed HFD for 8 weeks were placed in the measuring chambers of the indirect calorimetry system INCA, and then given either vehicle or metformin at a dose of 400 mg/kg body weight (M400) by gavage. Thirty min later (i.e. at 11:30 a.m.) D-glucose was orally administered at a dose of 3 mg/g body weight. The use of substrates during the experiment was monitored as the change in the RQ values measured by INCA. (a) The curves representing changes in the whole-body glucose oxidation rate that was calculated from the data obtained by indirect calorimetry (see Methods for details); arrows indicate the administration times of metformin (vehicle) and D-glucose. (b) The amount of glucose oxidized during a time interval of 60 min (12:00 p.m.–13:00 p.m.) within the indirect calorimetry measurements. aP = 0.021 vs. vehicle by t-test. (c) The amount of exogenous (i.e. administered) glucose that was not oxidized to CO2, calculated for a time interval of 60 min (12:00 p.m.–13:00 p.m.) during the indirect calorimetry measurements. aP = 0.014 vs. Vehicle by t-test; Data are means ± SEM (n = 5).
Figure 4
Figure 4
Metformin slows down the intestinal transit and stimulates glucose uptake from intestinal lumen into proximal intestinal segments while inhibiting glucose transport from intestinal lumen to circulation. Overnight fasted mice fed HFD for 8 weeks were first given vehicle or metformin at a dose of either 400 mg/kg (M400; a–c,e) or 60 mg/kg (M60; e) by oral gavage, followed by oral administration of [18F]-FDG (a,b) or incubation in 10 mM D-glucose solution (c–e) 30 min later. (a) The accumulation of [18F]-FDG in selected tissues measured during a time interval of 60 min following the administration of radioisotope. The intestinal content was carefully removed before the measurement. aP < 0.005 vs. vehicle by t-test (b) Representative images of [18F]-FDG accumulation obtained by PET/CT scanning; the time frame is 20–30 min following the administration of [18F]-FDG; arrows: green, stomach; blue, proximal segments of small intestine; red, distal segments of small intestine; yellow, bladder. (c) Glucose transport across intestinal epithelia measured ex vivo using everted gut sacs prepared from mice previously treated with either metformin (M400) or vehicle. (d) Glucose transport across intestinal epithelia into serosal fluid measured ex vivo using everted gut sacs prepared from vehicle-treated mice, and in the presence of 50 mM metformin (M 50 mM) only in the medium. (e) Glucose levels measured in vivo in blood samples from portal vein 10 min after intraduodenal administration of 75 mg glucose in mice previously treated with either metformin (M400) or vehicle. JEJ1, proximal jejunum; JEJ2, distal jejunum; IL1, proximal ileum; IL2, distal ileum. aP = 0.008 vs. vehicle; t-test. Data are means ± SEM (n = 6).

Similar articles

Cited by

References

    1. Sterne J. Blood sugar-lowering effect of 1,1-dimethylbiguanide. Therapie. 1958;13:650–659. - PubMed
    1. Inzucchi SE, et al. Management of hyperglycaemia in type 2 diabetes: a patient-centered approach. Position statement of the American Diabetes Association (ADA) and the European Association for the Study of Diabetes (EASD) Diabetologia. 2012;55:1577–1596. doi: 10.1007/s00125-012-2534-0. - DOI - PubMed
    1. Effect of intensive blood-glucose control with metformin on complications in overweight patients with type 2 diabetes (UKPDS 34). UK Prospective Diabetes Study (UKPDS) Group. Lancet352, 854–865 (1998). - PubMed
    1. Knowler WC, et al. Reduction in the incidence of type 2 diabetes with lifestyle intervention or metformin. The New England Journal of Medicine. 2002;346:393–403. doi: 10.1056/NEJMoa012512. - DOI - PMC - PubMed
    1. Morales DR, Morris AD. Metformin in cancer treatment and prevention. Annual Review of Medicine. 2015;66:17–29. doi: 10.1146/annurev-med-062613-093128. - DOI - PubMed

Publication types