

Review
doi: 10.1002/cld.704.
eCollection 2018 May.
Imaging of abnormal liver function tests
Affiliations
- PMID: 30992803
- PMCID: PMC6385957
- DOI: 10.1002/cld.704
Item in Clipboard
Review
Imaging of abnormal liver function tests
Clin Liver Dis (Hoboken).
.
No abstract available
Figures
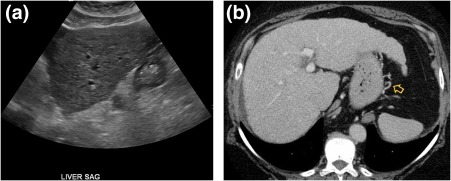
Chronic hepatitis C. (A) Ultrasound demonstrating hepatic surface nodularity and a coarsened echotexture, consistent with patient's biopsy‐proven cirrhosis. (B) CT in the same patient shows a hypertrophied left and caudate lobe, liver surface nodularity, and small perigastric varicosities (yellow arrow). SAG, sagittal.
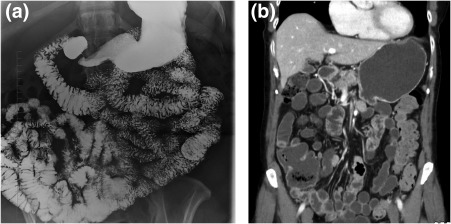
Celiac disease. (A) Small‐bowel follow‐through and (B) CT exhibiting reversal of the jejunoileal mucosal fold pattern, such that the jejunum has a decreased number of folds, whereas the ileum has an increased number of folds.
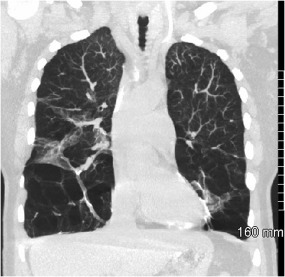
Alpha‐1‐antitrypsin deficiency. CT demonstrating severe basilar predominant paraseptal/centrilobular emphysema and scarring. Hepatic involvement may result in cirrhosis (not shown).
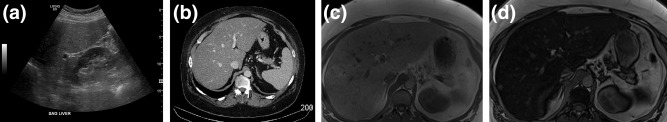
NAFLD. (A) Ultrasound demonstrates diffuse increased echogenicity and (B) CT demonstrates diffuse decreased attenuation. (C) in‐phase and (D) out‐of‐phase MR imaging exhibits diffuse, homogenous signal loss on out‐of‐phase images. SAG, sagittal.
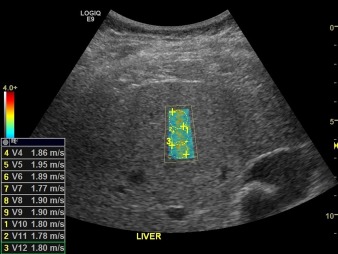
NASH. Shear wave elastography demonstrating elevated median velocity of 1.8 m/second, consistent with stage F3 fibrosis.
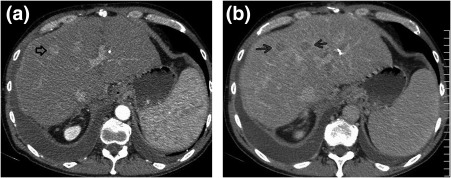
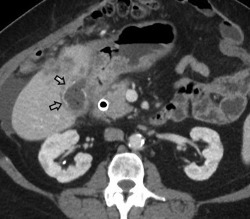
HCC. (A) Arterial‐phase CT shows a 14‐mm enhancing lesion (black open arrow) with capsular enhancement. There is washout on (B) venous phase in this and an adjacent lesion (black arrows).
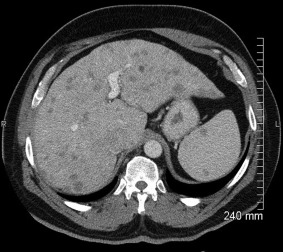
Sarcoidosis. CT exhibiting hepatomegaly with numerous small hypodense lesions in the liver and spleen.
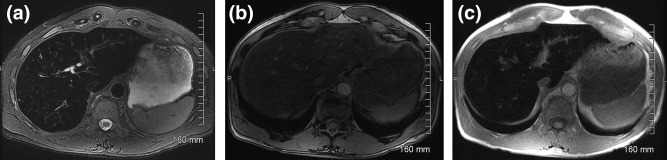
Hemochromatosis. (A) T2‐weighted MRI demonstrates diffuse low signal, whereas (B) out‐of‐phase and (C) in‐phase MRI exhibit loss of signal on the in‐phase images because of the longer TE.
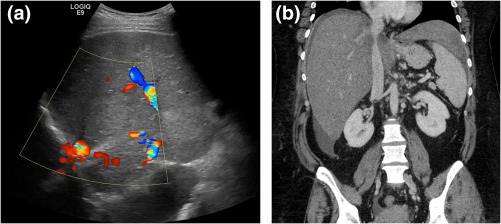
Budd‐Chiari syndrome. (A) Ultrasound illustrating nonvisualization of the hepatic veins, consistent with chronic occlusion. (B) CT demonstrating inferior vena cava (IVC) narrowing.
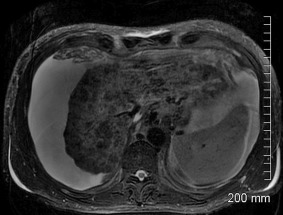
Wilson's disease. T2‐weighted MRI exhibiting a shrunken liver with severe parenchymal atrophy and nodular hypointense foci.
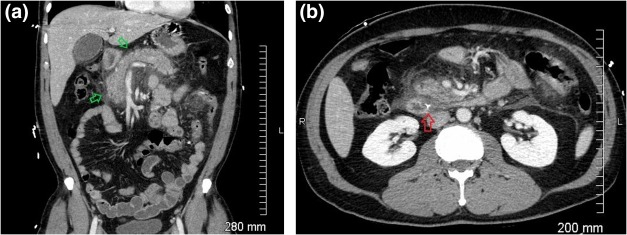
Gallstone pancreatitis. (A and B) CT demonstrating a calcified stone (B, red arrow) in the distal common bile duct near the sphincter of Oddi, peripancreatic fluid, and inflammatory stranding (A, green arrows).
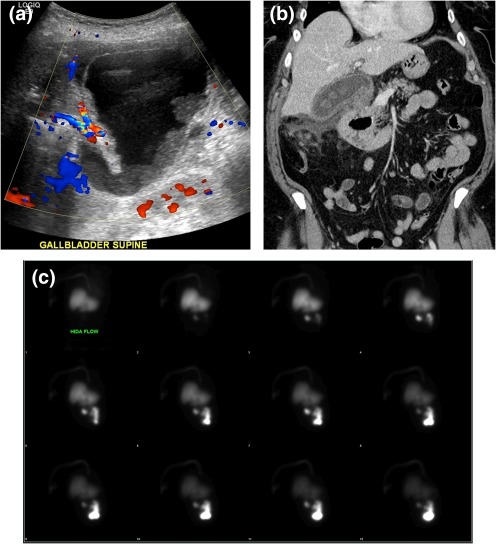
Acute cholecystitis. (A) Ultrasound demonstrating a distended gallbladder with wall thickening, dependent sludge, pericholecystic fluid, and hyperemia. (B) CT illustrates gallstones, gallbladder wall thickening, and pericholecystic fluid. (C) Nuclear medicine hepatobiliary scan (cholescintigraphy) shows normal uptake and excretion of radiotracer into the gastrointestinal tract. The gallbladder was not visualized at 2 hours, despite morphine augmentation.
Gallbladder carcinoma. CT of a patient with biopsy‐proven gallbladder carcinoma demonstrates loss of the fat plane between the gallbladder and adjacent liver, and a thickened gallbladder wall with calcifications (black arrows).
References
-
- Kwo PY, Cohen SM, Lim JK. ACG Clinical Guideline: evaluation of abnormal liver chemistries. Am J Gastroenterol 2017;112:18‐35. - PubMed
-
- Krier M, Ahmed A. The asymptomatic outpatient with abnormal liver function tests. Clin Liver Dis 2009;13:167‐177. - PubMed
-
- Kreuer S, Elgethun M, Tommack M. Imaging findings of cirrhosis. J Am Osteopath Coll Radiol 2016;5:5‐13.
-
- Barr RG, Ferraioli G, Palmeri ML, et al. Elastography assessment of liver fibrosis: Society of Radiologists in Ultrasound Consensus Conference Statement. Radiology 2015;276:845‐861. - PubMed
Publication types
LinkOut - more resources
Full Text Sources
