

Unintentional falls mortality in China, 2006-2016
- PMID: 30992985
- PMCID: PMC6445498
- DOI: 10.7189/jogh.09.010603
Unintentional falls mortality in China, 2006-2016
Abstract
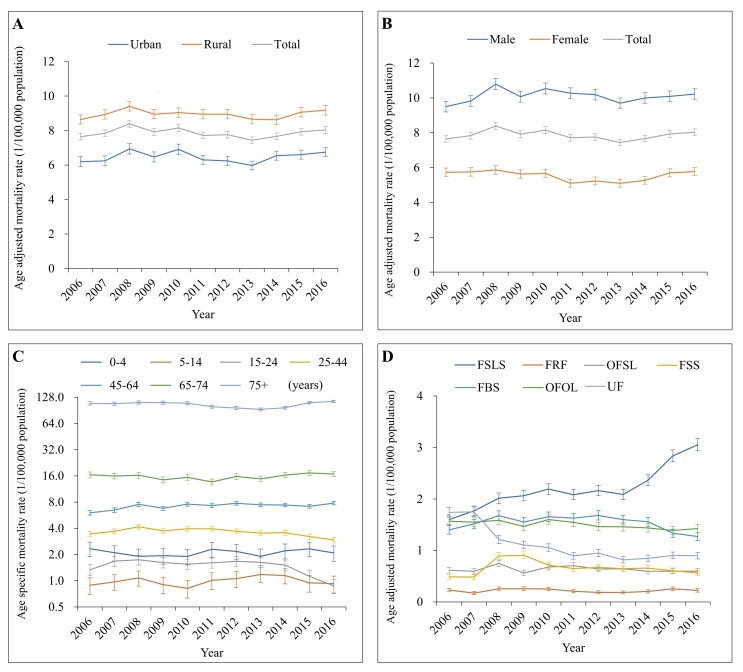
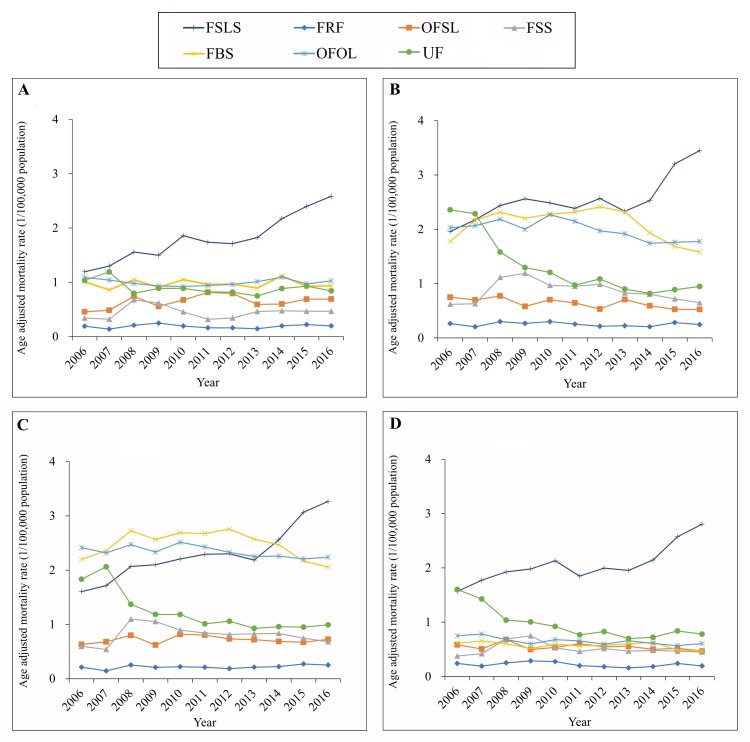
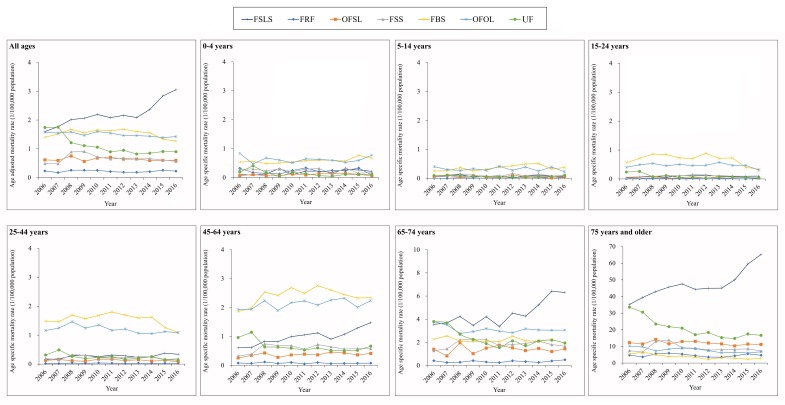
Background: To examine trends in unintentional falls mortality from 2006 to 2016 in China by location (urban/rural), sex, age group and mechanism.
Methods: Mortality data were retrieved from the National Disease Surveillance Points system (DSPs) of China, a nationally representative data source. Percent change in mortality between 2006 and 2016 was calculated as "mortality rate ratio - 1" based on a negative binomial regression model.
Results: The crude unintentional falls mortality was 9.55 per 100 000 population in 2016. From 2006 to 2016, the age-adjusted unintentional falls mortality increased by 5% (95% confidence interval (CI) = 1%-9%), rising from 7.65 to 8.03 per 100 000 population. Males, rural residents and older age groups consistently had higher falls mortality rates than females, urban residents and younger age groups. Falls on the same level from slipping, tripping and stumbling (W01) was the most common mechanisms of falls mortality, accounting for 29% of total mortality.
Conclusions: Unintentional falls continued to be a major cause of death in China from 2006 to 2016. Empirically-supported interventions should be implemented to reduce unintentional falls mortality.
Conflict of interest statement
Competing interests: The authors completed the Unified Competing Interest form at www.icmje.org/coi_disclosure.pdf (available upon request from the corresponding author), and declare no conflicts of interest.
Figures
References
-
- World Health Organization. The World Health Report 2004. 2004. Available: http://www.who.int/whr/2004/en/report04_en.pdf?ua=1. Accessed 22 Mar 2018.
-
- GBD 2015 Mortality and Causes of Death Collaborators Global, regional, and national life expectancy, all-cause mortality, and cause-specific mortality for 249 causes of death, 1980-2015: A systematic analysis for the Global Burden of Disease Study 2015. Lancet. 2016;388:1459–544. doi: 10.1016/S0140-6736(16)31012-1. - DOI - PMC - PubMed
-
- GBD 2016 DALY and HALE Collaborators Global, regional, and national disability-adjusted life-years (DALYs) for 333 diseases and injuries and healthy life expectancy (HALE) for 195 countries and territories, 1990-2016: a systematic analysis for the Global Burden of Disease Study 2016. Lancet. 2017;390:1260–344. doi: 10.1016/S0140-6736(17)32130-X. - DOI - PMC - PubMed
-
- World Health Organization. WHO Global Health Estimates. 2014. Available: http://www.who.int/healthinfo/global_burden_disease/projections/en/. Accessed: 22 March 2018.
MeSH terms
LinkOut - more resources
Full Text Sources
Medical
