Review
. 2019 Apr 15:4:8.
doi: 10.1038/s41525-019-0081-z. eCollection 2019.

Gene discovery informatics toolkit defines candidate genes for unexplained infertility and prenatal or infantile mortality

Affiliations
Review

Gene discovery informatics toolkit defines candidate genes for unexplained infertility and prenatal or infantile mortality

Ruebena Dawes et al. NPJ Genom Med. .

Abstract

Despite a recent surge in novel gene discovery, genetic causes of prenatal-lethal phenotypes remain poorly defined. To advance gene discovery in prenatal-lethal disorders, we created an easy-to-mine database integrating known human phenotypes with inheritance pattern, scores of genetic constraint, and murine and cellular knockout phenotypes-then critically assessed defining features of known prenatal-lethal genes, among 3187 OMIM genes, and relative to 16,009 non-disease genes. While around one-third (39%) of protein-coding genes are essential for murine development, we curate only 3% (624) of human protein-coding genes linked currently to prenatal/infantile lethal disorders. 75% prenatal-lethal genes are linked to developmental lethality in knockout mice, compared to 54% for all OMIM genes and 34% among non-disease genes. Genetic constraint correlates with inheritance pattern (autosomal recessive <<autosomal dominant <X-linked), and is greatest among prenatal-lethal genes. Importantly, >90% of recessive genes show neither missense nor loss-of-function constraint, even for prenatal-lethal genes. Detailed ontology mapping for 624 prenatal-lethal genes shows marked enrichment among dominant genes for nuclear proteins with roles in RNA/DNA biology, with recessive genes enriched in cytoplasmic (mitochondrial) metabolic proteins. We conclude that genes without genetic constraint should not be excluded as potential novel disease genes, and especially for recessive conditions (<10% constrained). Prenatal lethal genes are 5.9-fold more likely to be associated with a lethal murine phenotype than non-disease genes. Cell essential genes are largely a subset of mouse-lethal genes, notably under-represented among known OMIM genes, and strong candidates for gamete/embryo non-viability. We therefore curate 3435 'candidate developmental lethal' human genes: essential for murine development or cellular viability, not yet linked to human disorders, presenting strong candidates for unexplained infertility and prenatal/infantile mortality.


Conflict of interest statement

S.T.C. is director of Frontier Genomics Pty Ltd (Australia). Frontier Genomics has not traded (as of November 12th, 2018). Frontier Genomics Pty Ltd (Australia) will not benefit from publication of these data. The remaining authors declare no competing interests.

Figures
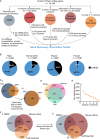
Fig. 1
Fig. 1
Gene Discovery Informatics Toolkit. a Data sources integrated within the Gene Discovery Informatics Toolkit. b Proportion of protein-coding genes found to be essential in yeast, human cells, mice and humans. Relative proportions of cell-essential genes are presented relative to the number of genes for which knockouts have been created (see Methods for details). Human-lethal genes were extracted through mining of OMIM database as described in methods, and proportion is shown relative to all protein-coding genes. c Venn diagram showing overlap between mouse lethal genes extracted from MGI and IMPC. (i) Overlap of genes annotated as inducing a pre-weaning lethal phenotype with recessive knockout in MGI and IMPC. (ii) 1290 genes with phenotypic information available for homozygous KO in both MGI and IMPC, with 84% concurrence in genes similarly annotated as inducing pre-weaning lethality by both sources. d Venn diagram showing overlap between cell ‘essentialomes’ described in the ref. Analyses include only genes tested in all three studies (15,903/19,169 protein coding genes, see Methods). e Number of genes classified as cell-essential among eleven cell lines. Our criteria for an aggregated ‘cell essentialome’ was defined as all genes shown to be essential for cellular viability in three or more cell lines, among any of the three studies. f Venn diagrams showing overlap between OMIM genes and mouse lethal and cell essential genes. (ii) Overlap of murine and cell essentialomes among all protein coding genes (16,764 genes which have either cell or mouse data, including 3118 OMIM genes shown in the grey Venn circle). (ii) Dataset is restricted to include only 8536 genes with both mouse and cell phenotypic information available. Note that areas of circles in Fii are not exactly correlated to numbers of genes but are largely representative of proportions
Fig. 2
Fig. 2
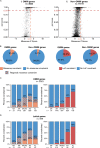
Loss-of-function (LoF) and missense constraint for OMIM versus non-OMIM genes. a Scatter plot showing levels of genetic tolerance to LoF (pLI) or missense constraint for 3115 OMIM genes (left) versus 14,757 non-OMIM protein-coding genes (right). Coloured dashed lines indicate thresholds (defined in the ref. ) demarking constraint to missense (mis z ≥ 3.09) or LoF (pLI ≥ 0.9) variation. b Pie Charts contrasting relative levels of genetic constraint for OMIM versus non-OMIM genes. A significantly higher proportion of OMIM genes than non-OMIM genes show missense constraint (odds ratio OR = 1.68; p < 2.2 × 10−16) or LoF constraint (OR 1.51; p < 2.2 × 10−16) using Fisher’s two-sided exact test. c Correlation of inheritance pattern with levels of genetic constraint among all OMIM genes: Left: Missense constraint—orange bars are OMIM genes with missense z ≥ 3.09. Orange and blue striped bars are OMIM genes with missense z < 3.09 and classed as having regional missense constraint by at least one of three metrics described in methods. Right: LoF constraint—red bars are OMIM genes with LoF pLI ≥ 0.9. The number and percentage of OMIM genes in each category are annotated. MT, Mitochondrial; AR, autosomal recessive; AR/AD, autosomal recessive and autosomal dominant; AD, autosomal dominant; XL, X-linked d Correlation of inheritance pattern with levels of genetic constraint among 624 curated prenatal-lethal genes (prenatal or infantile mortality)
Fig. 3
Fig. 3
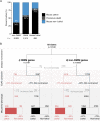
a Human-lethal genes (prenatal/infantile lethality) are strongly associated with lethal murine phenotypes. Proportions are based on 466/624 OMIM prenatal/infantile lethality genes for which Murine phenotypic data was available. b Flow chart connecting disease involvement with genetic constraint and murine non-viable phenotypes. OMIM genes: constrained genes: 68% linked to a lethal phenotype (murine phenotypic data available for 595/736 constrained genes). Non-constrained genes: 50% linked to a lethal phenotype (murine phenotypic data available for 1705/2287 non-constrained genes). Non-OMIM genes: constrained genes: 58% linked to a lethal phenotype (murine phenotypic data available for 1490/2418 constrained genes). Non-constrained genes: 27% were linked to a lethal phenotype (murine phenotypic data available for 5094/11723 non-constrained genes). Murine non-viability is more prevalent among constrained genes (68% among OMIM constrained genes and 58% among non-OMIM constrained genes). However, many non-constrained genes are nevertheless associated with non-viable murine phenotypes (27% among OMIM genes without constraint and 50% among non-OMIM genes without constraint)
Fig. 4
Fig. 4
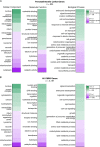
Ontology analysis of 624 known prenatal-lethal genes, compared with all 3187 OMIM genes. a Comparative analysis of gene ontology between dominant (AD or X-linked dominant) and recessive (AR or X-linked recessive) prenatal-lethal genes. Gene ontology terms for each gene were compiled, then GO terms comparatively enriched in either dominant or recessive gene families were determined (subcellular localisation, molecular function and biological processes). Comparative metrics were exported from cytoscape with a p-value cutoff of 0.025 with data visualisation performed in R. Green: GO terms significantly comparatively enriched among Dominant lethal genes, with intensity of colour correlating with the proportion of genes in category annotated with that term. Purple: GO terms significantly comparatively enriched terms among Recessive lethal genes. b Comparative analysis of gene ontology between dominant and recessive among all 3187 OMIM genes. Ontology analyses is available in https://github.com/RubyDawes/GD_Informatics_Toolkit/releases/tag/v1.0.0. Highly general terms are excluded from the figure (cellular component, cell, binding etc.). Some ontology terms are abbreviated for readability. Only the 14 most significantly overrepresented categories are visualised
Fig. 5
Fig. 5
Ontology analysis of 3435 candidate prenatal/infantile lethal genes. Gene Ontology categories enriched among 3435 candidate prenatal/infantile lethal genes compared with all 19,196 protein-coding genes as a background were visualised using BiNGO cytoscape plugin. Size of circles is proportional to the number of genes in the ontology category and colour is proportional to the p-value of enrichment of this GO term. Layout was manually organised for ease of interpretation, with biological process enriched terms separated into four categories: (1) Growth, differentiation, cell cycle; (2) Signalling; (3) Development and (4) Metabolic processes. Some ontology terms are abbreviated for readability
Fig. 6
Fig. 6
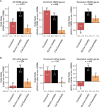
Odds ratio (OR) analyses synthesising relevance of scores of genetic cosntraint and model organism phenotypic data, with likelihood of being a disease gene. a All OMIM genes. b 624 Human-lethal disease genes. Red bars: murine lethality. Black bars: genetic constraint. Orange bars: cell essentiality. Odds-ratio statistical significance determined via Fishers two-sided exact test. Numbers in brackets represent the 95% confidence interval for each value. Maximum statistical significance determined in R is p < 2.2 × 10−16. Thus: ****p < 2.2 × 10−16; ***p < 5.0 × 10−7; **p < 5.0 × 10−5; *p < 5.0 × 10−2

References

    1. Vora NL, Hui L. Next-generation sequencing and prenatal ‘omics: advanced diagnostics and new insights into human development. Genet. Med. 2018;8:791–799. doi: 10.1038/s41436-018-0087-4. - DOI - PMC - PubMed
    1. Filges I, Friedman JM. Exome sequencing for gene discovery in lethal fetal disorders—harnessing the value of extreme phenotypes. Prenat. Diagn. 2015;35:1005–1009. doi: 10.1002/pd.4464. - DOI - PubMed
    1. Lek M, et al. Analysis of protein-coding genetic variation in 60,706 humans. Nature. 2016;536:285–291. doi: 10.1038/nature19057. - DOI - PMC - PubMed
    1. Havrilla JM, et al. A map of constrained coding regions in the human genome. Nat. Genet. 2019;51:88–95. doi: 10.1038/s41588-018-0294-6. - DOI - PMC - PubMed
    1. Samocha, K. E. et al. Regional missense constraint improves variant deleteriousness prediction. https://www.biorxiv.org/content/10.1101/148353v1 (2017). - DOI