. 2019 May;20(5):830-843.
doi: 10.3348/kjr.2018.0757.

Evaluation of Renal Pathophysiological Processes Induced by an Iodinated Contrast Agent in a Diabetic Rabbit Model Using Intravoxel Incoherent Motion and Blood Oxygenation Level-Dependent Magnetic Resonance Imaging

Affiliations

Evaluation of Renal Pathophysiological Processes Induced by an Iodinated Contrast Agent in a Diabetic Rabbit Model Using Intravoxel Incoherent Motion and Blood Oxygenation Level-Dependent Magnetic Resonance Imaging

Yongfang Wang et al. Korean J Radiol. 2019 May.

Abstract

Objective: To examine the potential of intravoxel incoherent motion (IVIM) and blood oxygen level-dependent (BOLD) magnetic resonance imaging for detecting renal changes after iodinated contrast-induced acute kidney injury (CI-AKI) development in a diabetic rabbit model.

Materials and methods: Sixty-two rabbits were randomized into 2 groups: diabetic rabbits with the contrast agent (DCA) and healthy rabbits with the contrast agent (NCA). In each group, 6 rabbits underwent IVIM and BOLD imaging at 1 hour, 1 day, 2 days, 3 days, and 4 days after an iohexol injection while 5 rabbits were selected to undergo blood and histological examinations at these specific time points. Iohexol was administrated at a dose of 2.5 g I/kg of body weight. Further, the apparent transverse relaxation rate (R2*), average pure molecular diffusion coefficient (D), pseudo-diffusion coefficient (D*), and perfusion fraction (f) were calculated.

Results: The D and f values of the renal cortex (CO) and outer medulla (OM) were significantly decreased compared to baseline values in the 2 groups 1 day after the iohexol injection (p < 0.05). A marked reduction in the D* values for both the CO and OM was also observed after 1 hour in each group (p < 0.05). In the OM, a persistent elevation of the R2* was detected for 4 days in the DCA group (p < 0.05). Histopathological changes were prominent, and the pathological features of CI-AKI aggravated in the DCA group until day 4. The D, f, and R2* values significantly correlated with the histological damage scores, hypoxia-inducible transcription factor-1α expression scores, and serum creatinine levels.

Conclusion: A combination of IVIM and BOLD imaging may serve as a noninvasive method for detecting and monitoring CI-AKI in the early stages in the diabetic kidney.

Keywords: Hypoxia-inducible transcription factor-1α; Medullary hypoxia; Renal vascular dysfunction; Vascular endothelial growth factor.


Conflict of interest statement

The authors have no potential conflicts of interest to disclose.

Figures

Fig. 1
Fig. 1. Experimental flow chart.
BOLD = blood oxygen level-dependent, BUN = blood urea nitrogen, Cr = serum creatinine, d = day, FBG = fasting blood glucose, h = hour, IVIM = intravoxel incoherent motion
Fig. 2
Fig. 2. Temporal changes in IVIM measurements in two groups.
(A–C) DCA group, (D–F) NCA group. Serially measured parameters (baseline, 1 hour, 1 day, 2 days, 3 days, and 4 days after CA injection) in 6 representative animals were recorded. Asterisk indicates p < 0.05 compared with baseline values. CA = contrast agent, CO = cortex, D = pure tissue molecular diffusion coefficient, D* = pseudo-diffusion coefficient, DCA = diabetic rabbits with contrast agent, f = perfusion fraction of voxel, NCA = healthy rabbits with contrast agent, OM = outer medulla
Fig. 3
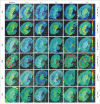
Fig. 3. Representative IVIM images of two groups at corresponding time points.
Maps were produced with same window and level settings. Maximum D and f signal changes appeared after day 1, whereas D* values appeared after 1 hour, followed by gradual recovery toward baseline values at subsequent time points.
Fig. 4
Fig. 4. R2* maps for two groups obtained at each time point.
A. R2* maps in DCA group until day 4. B. R2* maps in NCA group until day 4. C, D. Each data point was average of R2* measurements in 6 rabbits from same group at one scan time. For each group, sharp increase in R2* values was observed after day 1 in two anatomical layers; subsequently, R2* values returned to baseline over time. Asterisk indicates p < 0.05 compared with baseline values. R2* = apparent transverse relaxation rate
Fig. 5
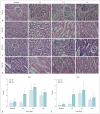
Fig. 5. Representative micrographs of hematoxylin and eosin staining of kidney in two groups.
(A, B) DCA group, (C, D) NCA group (original magnification, × 400), (E, F) severity of histopathological injury. *p < 0.05 (compared with baseline values).
Fig. 6
Fig. 6. Representative micrographs of kidney with Masson's trichrome staining.
(A, C) diabetic rabbits, (B, D) DCA post day 4, (E, G) healthy rabbits, and (F, H) NCA post day 4 (original magnification × 200). In DCA group, Masson's trichrome staining showed gradual increase in percentage of interstitial fibrosis, while in NCA group, small amount of interstitial fibrosis was observed after day 4.
Fig. 7
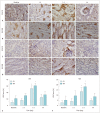
Fig. 7. Time course of HIF-1α expression after iohexol injection in each group.
(A, B) DCA group, (C, D) NCA group (original magnification × 400). (E, F) Nuclear staining score for HIF-1α in two groups. Expression of HIF-1α slightly increased after 1 hour in all anatomical layers and was significantly higher after day 1 compared to baseline in 2 groups. *p < 0.05 vs. baseline values. HIF-1α = hypoxia-inducible transcription factor-1α
Fig. 8
Fig. 8. Representative photomicrographs for VEGF expression in each group.
(A, B) DCA group, (C, D) NCA group (original magnification × 400), (E, F) VEGF scores for two groups. *p < 0.05 vs. baseline values. VEGF = vascular endothelial growth factor
Fig. 9
Fig. 9. Correlation between functional MRI parameters and pathological scores in OM.
Significant correlations of renal histological scores with D, f, and R2* values (A, C, and D) and fair correlations of renal histological scores with D* values (B). Significant correlations of renal HIF-1α scores with D, D*, f, and R2* values (E–H). Significant correlations of Cr with R2* values (L) and moderate correlations of Cr with D, D*, and f values (I–K).

Similar articles

Cited by

References

    1. McCullough PA. Contrast-induced acute kidney injury. J Am Coll Cardiol. 2008;51:1419–1428. - PubMed
    1. Li LP, Lu J, Zhou Y, Papadopoulou MV, Franklin T, Bokhary U, et al. Evaluation of intrarenal oxygenation in iodinated contrast-induced acute kidney injury-susceptible rats by blood oxygen level-dependent magnetic resonance imaging. Invest Radiol. 2014;49:403–410. - PMC - PubMed
    1. Calvin AD, Misra S, Pflueger A. Contrast-induced acute kidney injury and diabetic nephropathy. Nat Rev Nephrol. 2010;6:679–688. - PMC - PubMed
    1. Stacul F, van der Molen AJ, Reimer P, Webb JA, Thomsen HS, Morcos SK, et al. Contrast Media Safety Committee of European Society of Urogenital Radiology (ESUR) Contrast induced nephropathy: updated ESUR Contrast Media Safety Committee guidelines. Eur Radiol. 2011;21:2527–2541. - PubMed
    1. Chalikias G, Drosos I, Tziakas DN. Contrast-induced acute kidney injury: an update. Cardiovasc Drugs Ther. 2016;30:215–228. - PubMed

Publication types

MeSH terms