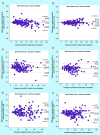
Feasibility of measuring sodium, potassium and creatinine from urine sample on dried filter paper
- PMID: 30994023
- PMCID: PMC6562700
- DOI: 10.4155/bio-2018-0295
Feasibility of measuring sodium, potassium and creatinine from urine sample on dried filter paper
Abstract
Aim: To develop a bioassay for estimation of sodium, potassium and creatinine in dried urine strips and comparing with their respective concentration in liquid urine samples. Materials & methods: Urine was collected on filter paper strips, dried at room temperature and, eluted for estimation of sodium, potassium by indirect ion selective electrode method and creatinine by Jaffé method. Result: This bioassay was validated based on the US FDA guidelines for bioanalytical method validation and was linear, sensitive, accurate and precise with acceptable recovery and matrix effects. Analytes were stable in dried urine strips during 1 year of storage at 4°C. Conclusion: We conclude that the dried urine is suitable for analysis of sodium, potassium and creatinine and offers a convenient alternative for monitoring dietary salt intake.
Keywords: cardiovascular disease; dried urine strip; electrolytes; hypertension; kidney dysfunction; salt intake.
Conflict of interest statement
Authors thank the Indian Council of Medical Research and WHO for providing financial support for National NCDs Monitoring Survey from which this pilot study was carried out. The authors have no other relevant affiliations or financial involvement with any organization or entity with a financial interest in or financial conflict with the subject matter or materials discussed in the manuscript apart from those disclosed.
No writing assistance was utilized in the production of this manuscript.
Figures


References
-
- Sacks FM, Svetkey LP, Vollmer WM. et al. Effects on blood pressure of reduced dietary sodium and the Dietary Approaches to Stop Hypertension (DASH) diet. DASH-Sodium Collaborative Research Group. N. Engl. J. Med. 344(1), 3–10 (2001). - PubMed
-
• Effect of dietary salt intake on blood pressure.
-
- Cook NR, Obarzanek E, Cutler JA. et al. Joint effects of sodium and potassium intake on subsequent cardiovascular disease: the Trials of Hypertension Prevention follow-up study. Arch. Intern. Med. 169(1), 32–40 (2009). - PMC - PubMed
-
•• Effect of dietary sodium and potassium intake on cardiovascular disease.
-
- Yang Q, Liu T, Kuklina EV. et al. Sodium and potassium intake and mortality among US adults: prospective data from the Third National Health and Nutrition Examination Survey. Arch. Intern. Med. 171(13), 1183–1191 (2011). - PubMed
MeSH terms
Substances
Grants and funding
LinkOut - more resources
Full Text Sources
Medical
