. 2019 Jun;34(3):249-271.
doi: 10.1177/0748730419841468. Epub 2019 Apr 17.

Neuronal Activity in Non-LNv Clock Cells Is Required to Produce Free-Running Rest:Activity Rhythms in Drosophila

Affiliations

Neuronal Activity in Non-LNv Clock Cells Is Required to Produce Free-Running Rest:Activity Rhythms in Drosophila

Nicholas Bulthuis et al. J Biol Rhythms. 2019 Jun.

Abstract

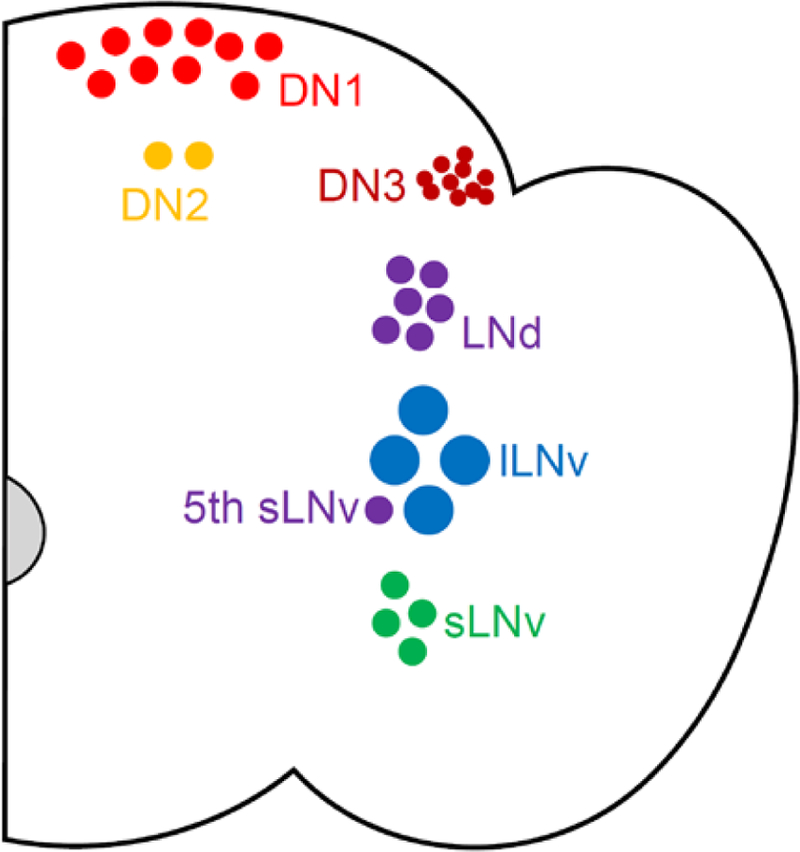
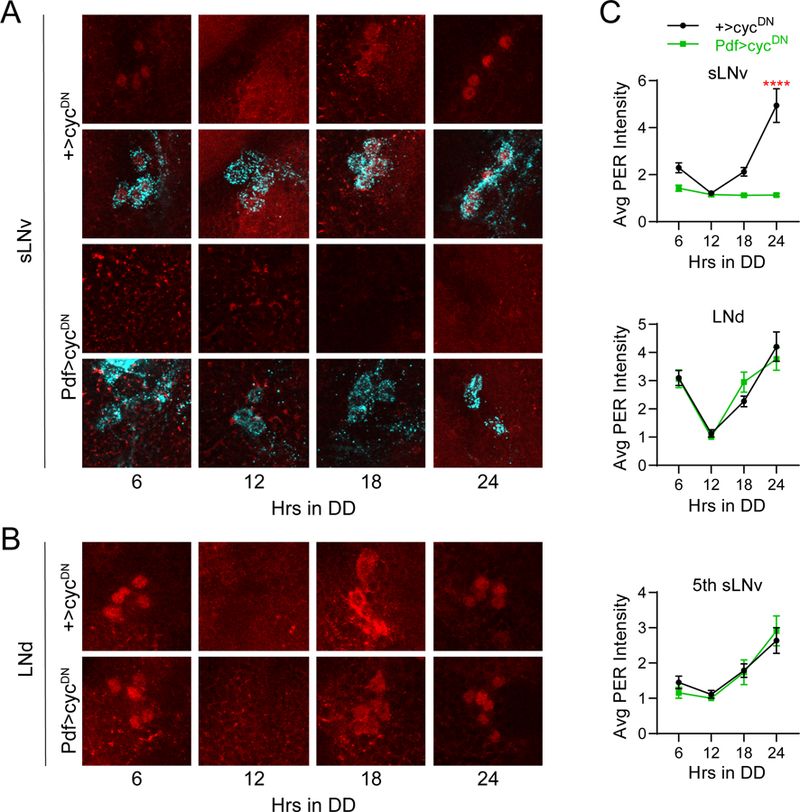
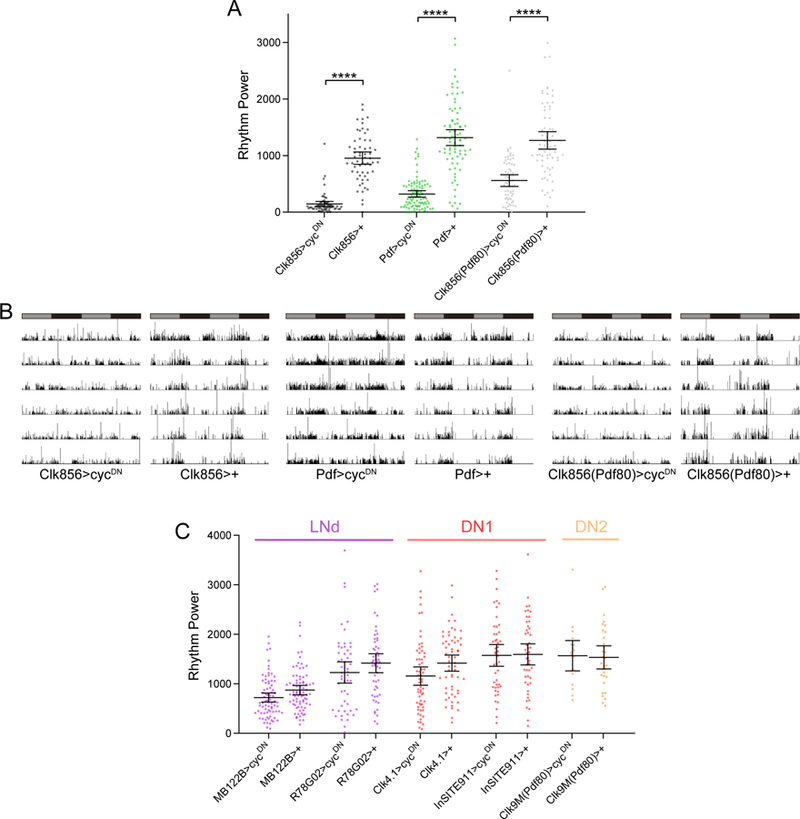
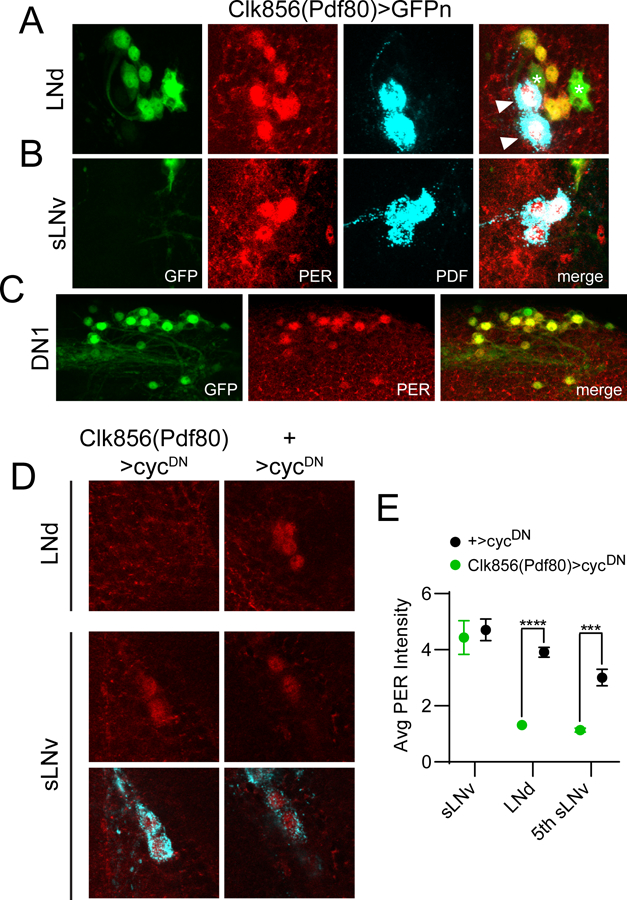
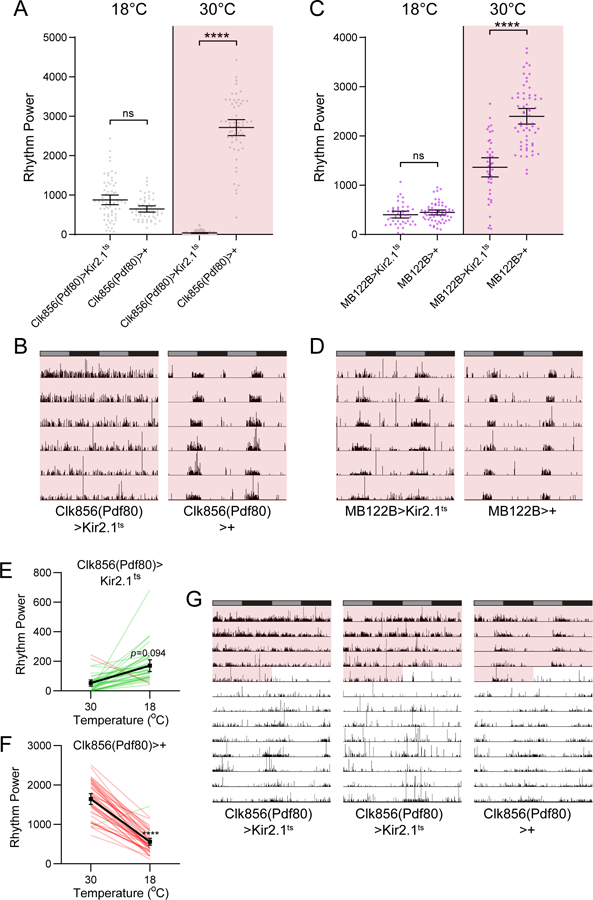
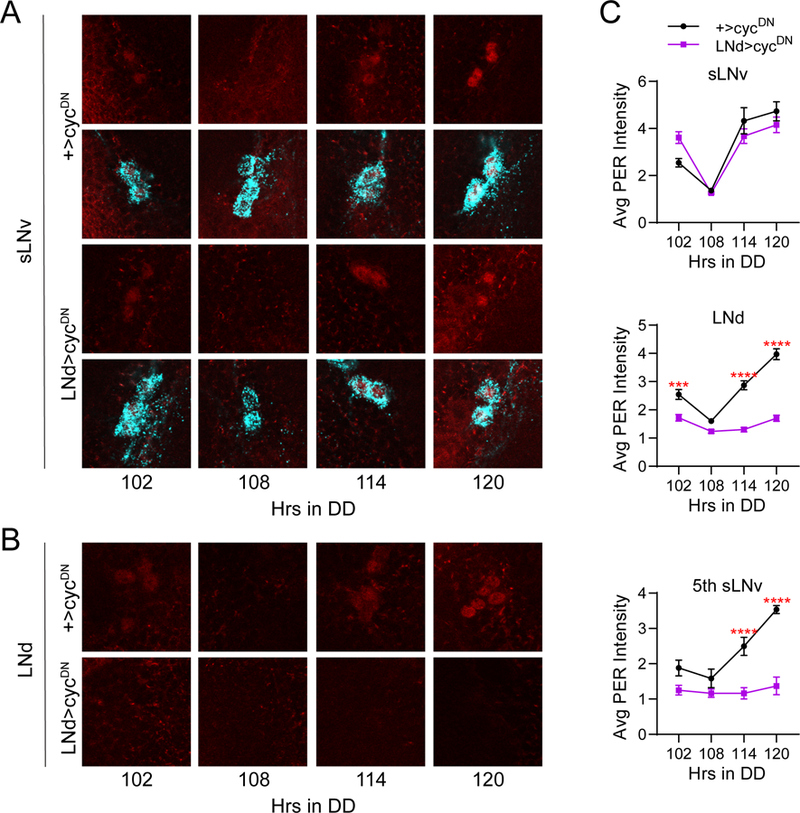
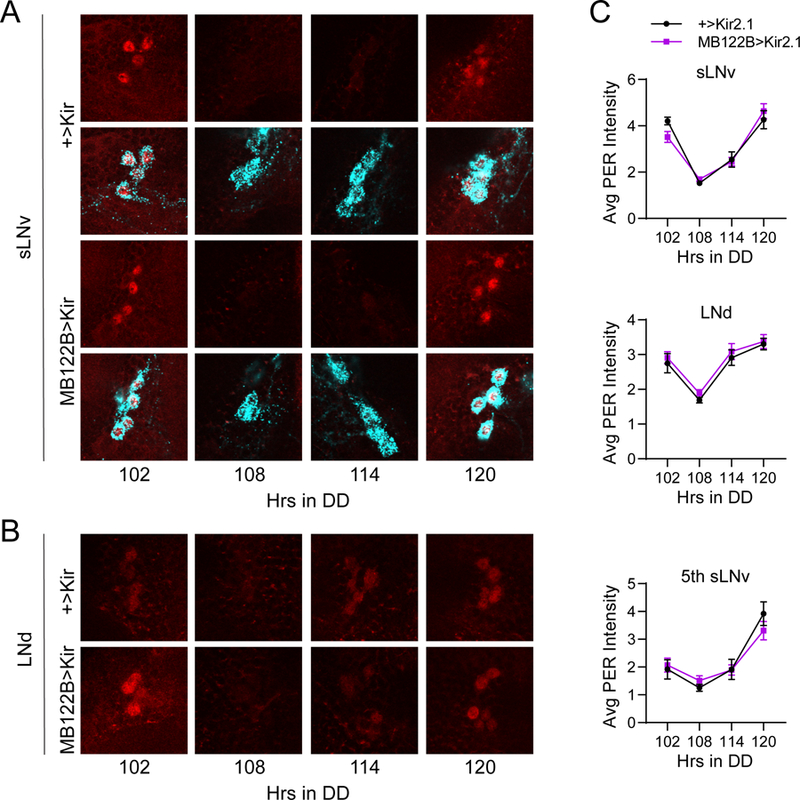
Circadian rhythms in behavior and physiology are produced by central brain clock neurons that can be divided into subpopulations based on molecular and functional characteristics. It has become clear that coherent behavioral rhythms result from the coordinated action of these clock neuron populations, but many questions remain regarding the organizational logic of the clock network. Here we used targeted genetic tools in Drosophila to eliminate either molecular clock function or neuronal activity in discrete clock neuron subsets. We find that neuronal firing is necessary across multiple clock cell populations to produce free-running rhythms of rest and activity. In contrast, such rhythms are much more subtly affected by molecular clock suppression in the same cells. These findings demonstrate that network connectivity can compensate for a lack of molecular oscillations within subsets of clock cells. We further show that small ventrolateral (sLNv) clock neurons, which have been characterized as master pacemakers under free-running conditions, cannot drive rhythms independent of communication between other cells of the clock network. In particular, we pinpoint an essential contribution of the dorsolateral (LNd) clock neurons, and show that manipulations that affect LNd function reduce circadian rhythm strength without affecting molecular cycling in sLNv cells. These results suggest a hierarchical organization in which circadian information is first consolidated among one or more clock cell populations before accessing output pathways that control locomotor activity.

Keywords: LNd; circadian; circuit; sLNv.


Conflict of interest statement

Declaration of Conflicting Interests: The authors declare that there is no conflict of interest.

Figures

Figure 1
Figure 1
Organization of Drosophila clock cells. A coronal cross-section schematic of a single hemisphere of a Drosophila brain is shown demonstrating small and large ventral lateral neurons (sLNv and lLNv; green and blue, respectively), the 5th sLNv (purple), dorsal lateral neurons (LNd; purple), and dorsal neurons (DN1, DN2, and DN3; light red, orange, and dark red, respectively). This coloring scheme is maintained throughout subsequent figures. Lateral posterior neurons (LPNs) are not shown.
Figure 2
Figure 2
Selective suppression of molecular clock cycling in PDF+ LNvs. A, Representative confocal images of PER staining (red) in sLNv clock cells at different time points taken every six hours on the first day of constant darkness (DD1). PDF staining (cyan) was used to identify sLNv cells, and a merged image of PER and PDF staining is shown below each PER staining panel. Control +>UAS-cycDN brains (top) exhibit normal PER oscillations in LNv neurons, while PER expression in Pdf>cycDN brains (bottom) is constitutively low. B, Representative confocal images of PER staining (red) in LNd cells taken from the same genotypes and time points as in A. PER levels and cycling are unaffected in LNds of Pdf>cycDN flies. C, Quantification of average PER staining intensity, normalized to background levels (mean ± SEM), for sLNv cells (top), LNd cells (middle) and the 5th sLNv (bottom). n= 7–10 brains per time point; ****p<0.0001 compared to control PER intensity at that time point, Sidak’s multiple comparisons test following Two-Way ANOVA.
Figure 3
Figure 3
Molecular clocks in non-LNv clock cells are required for robust free-running rest:activity rhythms. A, Rest:activity rhythm power is displayed for the genotypes listed. See methods for a description of determination of rhythm power. Lines are means ± 95% confidence intervals. Dots represent individual flies. n=59–91 per genotype; ****p<0.0001, Tukey HSD test following ANOVA. See Table 1 for exact n and p values. B, Representative single fly activity records over six days in DD for the genotypes listed. Activity in infrared beam breaks/min is plotted for each minute. Activity records are double plotted, with 48 hours of data on each line and the second 24 hours replotted at the start of the next line. Gray and black bars above each plot represent subjective day and night, respectively. C, Rest:activity rhythm power is displayed for the genotypes listed and plotted as in A. n=18–79 per genotype. Note that rest:activity rhythm strength is unaffected by selective molecular clock abrogation in specific non-LNv subsets of clock neurons.
Figure 4
Figure 4
The Clk856(Pdf80) line targets non-sLNv clock cells. For panels A-C, dissections were carried out at ~ZT23 and representative confocal images are shown. GAL4 expression is visualized via a cross to UAS-nGFP (green); PER staining (red) identifies clock cells; PDF staining (cyan) labels LNv cells and processes. A, GFP staining of Clk856(Pdf80)>GFPn brains demonstrating expression in all six LNd cells. In contrast, this line lacks GAL4 expression in PDF+ sLNvs (B) but is present in the vast majority of other non-LNv clock neurons such as DN1 and DN2 cells (C). For A, note that all six PER+ LNds are co-labeled with GFP; however two PDF+ lLNvs (arrowheads) are GFP-. Note also additional expression of this GAL4 line in two PER- non-clock cells (asterisks) near the LNds. D, Representative confocal images are shown of LNd and LNv cells of Clk856(Pdf80)>cycDN flies (left) and +>cycDN control flies (right) stained for PER (red) at ZT23. PDF staining (cyan) was used to identify sLNv cells, and a merged image of PER and PDF staining is shown below each PER staining panel for the sLNvs. E, Quantification of average PER staining intensity at ZT23, normalized to background levels (mean ± SEM), for sLNv cells, LNd cells and the 5th sLNv. n= 8 brains per time point; ***p<0.001; ****p<0.0001, Sidak’s multiple comparisons test following Two-Way ANOVA.
Figure 5
Figure 5
Expression patterns of LNd-targeting GAL4 lines. For all panels, dissections were carried out at ~ZT23 and representative confocal images are shown. GAL4 expression is visualized via a cross to UAS-nGFP (green); PER staining (red) identifies clock cells; PDF staining (cyan) labels LNv cells and processes. A, R78G02(Pdf802)>GFPn brain showing GAL4 expression in a subset of LNd cells. Note the presence of three PER+ LNds that are unlabeled by GFP (arrowheads). B, DvPdf(Pdf803)>GFPn brain showing GAL4 expression in 4 LNd cells. Note that two PER+ LNds are unlabeled by GFP (arrowheads). C, LNd>GFPn brain showing GAL4 expression in all six LNds (top) but lack of expression in PDF+ sLNvs (middle). This line is also strongly expressed in the 5th sLNv (bottom; arrowhead), and has faint residual expression in lLNvs (bottom; arrow).
Figure 6
Figure 6
Selective suppression of molecular clock cycling in LNds. A, Representative confocal images of PER staining (red) in sLNv clock cells at different time points taken every six hours on DD1. PDF staining (cyan) was used to identify sLNv cells, and a merged image of PER and PDF staining is shown below each PER staining panel. PER cycling in sLNvs of LNd>cycDN brains (bottom) was indistinguishable from control +>cycDN brains (top). B, Representative confocal images of PER staining (red) in LNd cells taken from the same genotypes and time points as in A. PER levels and cycling are strongly suppressed in LNd neurons of LNd>cycDN flies (bottom) compared to control brains (top), which exhibited normal PER cycling. C, Quantification of average PER staining intensity, normalized to background levels (mean ± SEM), for sLNv cells (top), LNd cells (middle) and the 5th sLNv (bottom). n= 8–9 brains per time point; ****p<0.0001 compared to control PER intensity at that time point, Sidak’s multiple comparisons test following Two-Way ANOVA.
Figure 7
Figure 7
Molecular oscillations in all six LNd neurons are required for robust free-running rest:activity rhythms. A, Rest:activity rhythm power is displayed for the genotypes listed. Lines are means ± 95% confidence intervals. Dots represent individual flies. n=53–64 per genotype; ****p<0.0001, Tukey HSD test following ANOVA. See Table 1 for exact n and p values. Rhythm strength was unaffected by molecular clock abrogation in either the CRY+ (R78G02(Pdf802)>cycDN) or CRY- (DvPdf(Pdf803>cycDN) LNds individually; however, collective clock suppression in all six LNd neurons (LNd>cycDN) moderately but significantly reduced rhythm strength. B, Representative single fly activity records over six days in DD for the genotypes listed. Activity in infrared beam breaks/min is plotted for each minute. Activity records are double plotted and gray and black bars above each plot represent subjective day and night, respectively.
Figure 8
Figure 8
Silencing neuronal activity in non-LNv clock neurons drastically degrades free-running rest:activity rhythms. A, Rest:activity rhythm power is displayed for the genotypes listed. Lines are means ± 95% confidence intervals. Dots represent individual flies. n=40–67 per genotype; ****p<0.0001, Tukey HSD test following ANOVA. See Table 1 for exact n and p values. Rhythm strength was strongly and equivalently reduced following neuronal silencing of all clock neurons (Clk856>Kir2.1), sLNv neurons (Pdf>Kir2.1), or non-LNv clock neurons (Clk856(Pdf80)>Kir2.1). B, Representative single fly activity records over six days in DD for the genotypes listed. Activity in infrared beam breaks/min is plotted for each minute. Activity records are double plotted and gray and black bars above each plot represent subjective day and night, respectively. C, Rest:activity rhythm power is displayed for the genotypes listed as described for A. n=71–91 per genotype; ****p<0.0001, *** p<0.001 Tukey HSD test following ANOVA. See Table 1 for exact n and p values. Silencing of either the CRY+ (MB122B>Kir2.1) or the CRY- (DvPdf(Pdf803)>Kir2.1) subset of LNd neurons reduced rest:activity rhythm strength. D, Representative single fly activity records for the genotypes listed are plotted as in B.
Figure 9
Figure 9
Adult-specific neuronal silencing of non-LNv clock neurons drastically degrades free-running rest:activity rhythms. A, Rest:activity rhythm power is displayed for the genotypes and temperatures listed. Red shading indicates that behavioral testing was conducted at 30°C, which allows for GAL4-mediated expression of Kir2.1. Lines are means ± 95% confidence intervals. Dots represent individual flies. n=53–79 per genotype; ****p<0.0001, Tukey HSD test following ANOVA. See Table 1 for exact n and p values. Rhythm strength was strongly reduced following adult-specific neuronal silencing of all non-LNv clock neurons (Clk856(Pdf80)>Kir2.1ts). B, Representative single fly activity records over six days in DD for the genotypes listed at 30°C. Activity in infrared beam breaks/min is plotted for each minute. Activity records are double plotted and gray and black bars above each plot represent subjective day and night, respectively. C, Rest:activity rhythm power is displayed for the genotypes and temperatures listed as described for A. n=41–60 per genotype; ****p<0.0001, Tukey HSD test following ANOVA. See Table 1 for exact n and p values. Adult-specific silencing of the CRY+ (MB122B>Kir2.1ts) subset of LNd neurons reduced rest:activity rhythm strength. D, Representative single fly activity records for the genotypes and temperature listed are plotted as in B. E and F, Rest:activity rhythm power is displayed for Clk856(Pdf80)>Kir2.1ts (E) and Clk856(Pdf80)>+ (F) flies. Red and green lines represent rhythm power of individual flies assessed at 30°C followed by 18°C. Red lines indicate flies in which power decreased from following transition to 18°C, and green lines indicate flies in which power increased. Black squares represent means ± 95% confidence intervals. n = 36–37 per genotype. ****p<0.0001, Sidak’s multiple comparison test following 2-way Repeated Measures ANOVA. G, Representative single fly activity records for the indicated genotypes showing 5 days at 30°C (pink shading) followed by 9 days at 18°C as plotted in B. Note that Clk856(Pdf80)>Kir2.1ts flies recover rhythmic behavior after a few days at 18°C.
Figure 10
Figure 10
Molecular clock suppression in all six LNd neurons has no effect on LNv clocks. A, Representative confocal images of PER staining (red) in sLNv clock cells at different time points taken every six hours on the fifth day of constant darkness (DD5). PDF staining (cyan) was used to identify sLNv cells, and a merged image of PER and PDF staining is shown below each PER staining panel. PER cycling in sLNvs of LNd>cycDN brains (bottom) was indistinguishable from control +>cycDN brains (top) even after extended time under free-running conditions. B, Representative confocal images of PER staining (red) in LNd cells taken from the same genotypes and time points as in A. PER levels and cycling are strongly suppressed in LNd neurons of LNd>cycDN flies (bottom) compared to control brains (top), which exhibited normal PER cycling. C, Quantification of average PER staining intensity, normalized to background levels (mean ± SEM), for sLNv cells (top), LNd cells (middle) and the 5th sLNv (bottom). n= 8 brains per time point; ****p<0.0001 compared to control PER intensity at that time point, Sidak’s multiple comparisons test following Two-Way ANOVA.
Figure 11
Figure 11
Silencing CRY+ LNds has no effect on LNv clocks. A, Representative confocal images of PER staining (red) in sLNv clock cells at different time points taken every six hours on DD5. PDF staining (cyan) was used to identify sLNv cells, and a merged image of PER and PDF staining is shown below each PER staining panel. PER cycling in sLNvs of MB122B>Kir2.1 brains (bottom) was indistinguishable from control +>Kir2.1 brains (top) even after extended time under free-running conditions. B, Representative confocal images of PER staining (red) in LNd cells taken from the same genotypes and time points as in A. PER levels and cycling are unaffected in LNd neurons of MB122B>Kir2.1 flies (bottom) compared to control brains (top). C, Quantification of average PER staining intensity, normalized to background levels (mean ± SEM), for sLNv cells (top), LNd cells (middle) and the 5th sLNv (bottom). n= 7–9 brains per time point.

Similar articles

Cited by

References

    1. Abruzzi KC, Zadina A, Luo W, Wiyanto E, Rahman R, Guo F, Shafer O, Rosbash M (2017) RNA-seq analysis of Drosophila clock and non-clock neurons reveals neuron-specific cycling and novel candidate neuropeptides. PLOS Genet 13:e1006613 Available at: http://dx.plos.org/10.1371/journal.pgen.1006613. - DOI - PMC - PubMed
    1. Bahn JH, Lee G, Park JH (2009) Comparative analysis of Pdf-mediated circadian behaviors between Drosophila melanogaster and D. virilis. Genetics 181:965–975. - PMC - PubMed
    1. Baines RA, Uhler JP, Thompson A, Sweeney ST, Bate M (2001) Altered electrical properties in Drosophila neurons developing without synaptic transmission. J Neurosci 21:1523–1531. - PMC - PubMed
    1. Beckwith EJ, Ceriani MF (2015) Experimental assessment of the network properties of the Drosophila circadian clock. J Comp Neurol 523:982–996. - PubMed
    1. Benito J, Houl JH, Roman GW, Hardin PE (2008) The blue-light photoreceptor CRYPTOCHROME is expressed in a subset of circadian oscillator neurons in the Drosophila CNS. J Biol Rhythms 23:296–307. - PMC - PubMed

Publication types

LinkOut - more resources