

Market food diversity mitigates the effect of environment on women's dietary diversity in the Agriculture to Nutrition (ATONU) study, Ethiopia
- PMID: 30994082
- PMCID: PMC7745109
- DOI: 10.1017/S136898001900051X
Market food diversity mitigates the effect of environment on women's dietary diversity in the Agriculture to Nutrition (ATONU) study, Ethiopia
Abstract
Objective: In Ethiopia, women's dietary diversity is low, primarily due to poor food availability and access, both at home and market level. The present study aimed to describe market access using a new definition called market food diversity (MFD) and estimate the impact of MFD, crop and livestock diversity on dietary diversity among women enrolled in the Agriculture to Nutrition (ATONU) trial.
Design: Baseline cross-sectional data collected from November 2016 to January 2017 were used for the analysis. Availability of foods in markets was assessed at the village level and categorized into nine food groups similar to the dietary diversity index for women. Bivariate and multivariate mixed-effects regression analyses were conducted, adjusted for clustering at the village level.
Setting: Chicken-producing farmers in rural Ethiopia.ParticipantsWomen (n 2117) aged 15-49 years.
Results: Overall, less than 6 % of women met the minimum dietary diversity (≥5 food groups) and the most commonly consumed food groups were staples and legumes. Median MFD was 4 food groups (interquartile range: 2-8). Multivariate models indicated that women's dietary diversity differed by livestock diversity, food crop diversity and agroecology, with significant interaction effects between agroecology and MFD.
Conclusions: Women's dietary diversity is poor in Ethiopia. Local markets are variable in food availability across seasons and agroecological zones. The MFD indicator captures this variability, and women who have access to higher MFD in the highland agroecological zone have better dietary diversity. Thus, MFD has the potential to mitigate the effects of environment on women's dietary diversity.
Keywords: Agriculture; Farm diversity; Livestock diversity; Market food diversity; Nutrition.
Figures
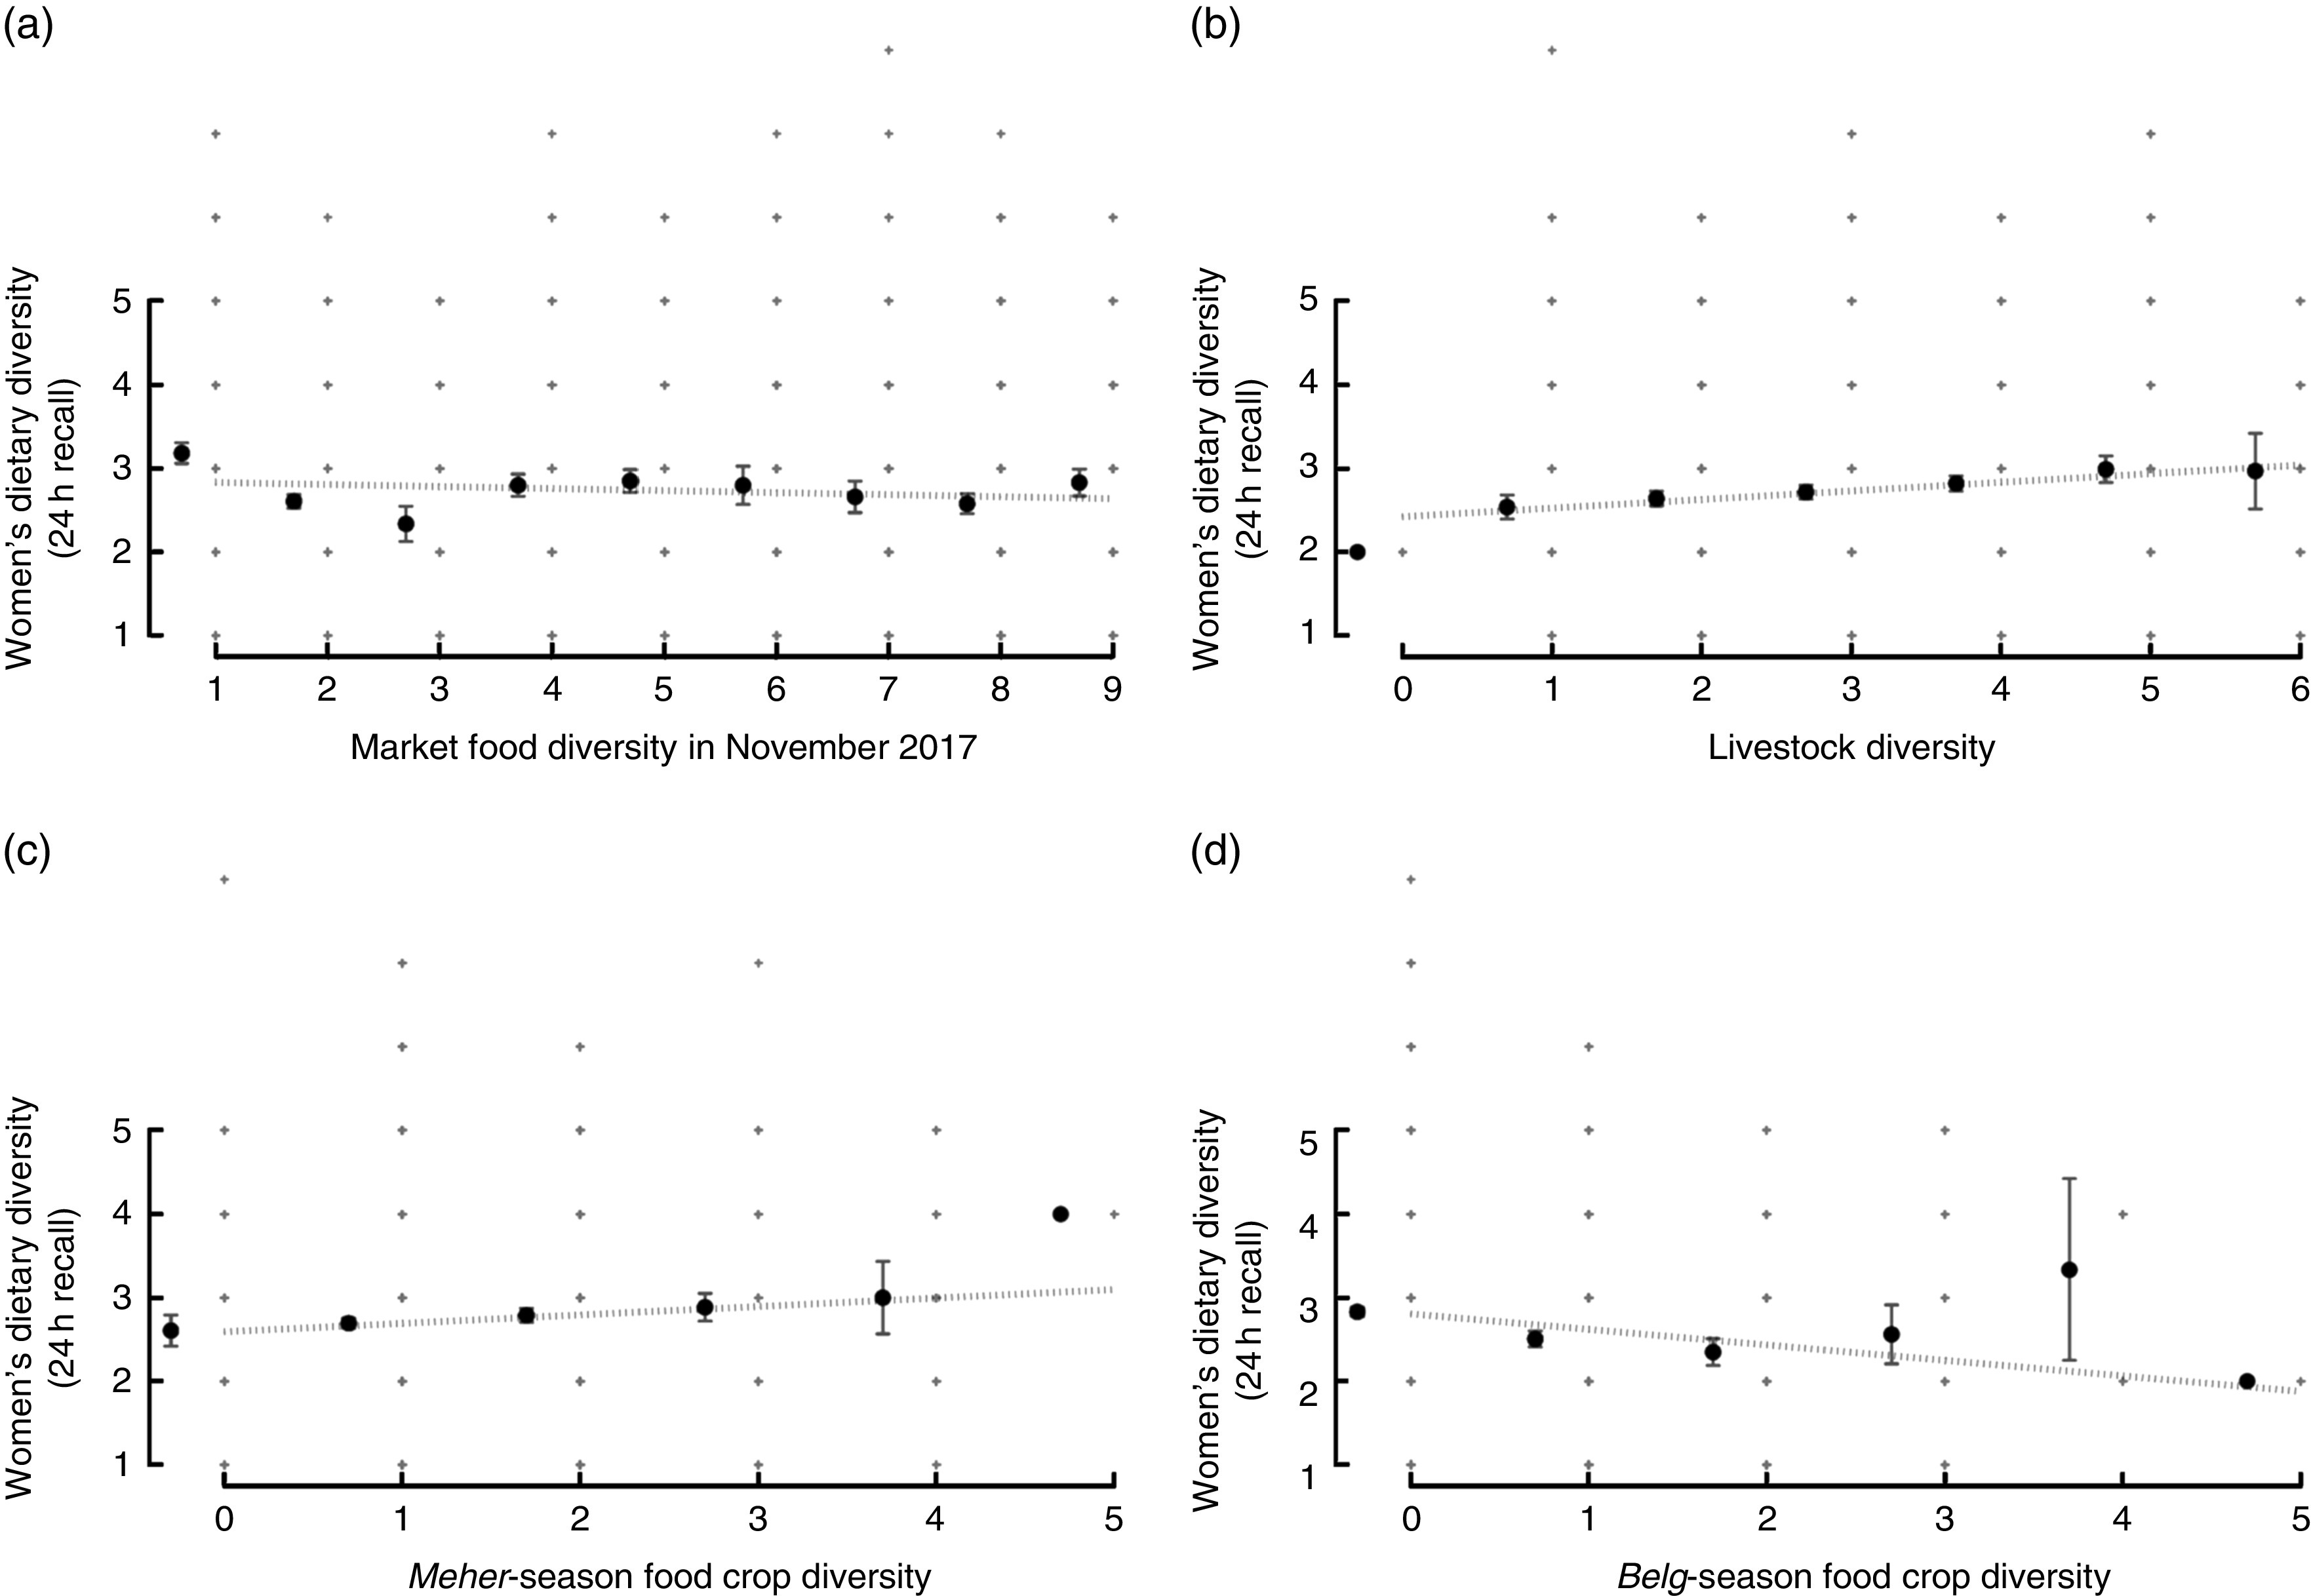
 ), with their standard errors represented by vertical bars;
  represent the range of dietary diversity scores. Slope and P value from bivariate models adjusted for kebele: (a) slope=–0·02, P=0·286; (b) slope=0·10, P<0·001; (c) slope=0·13, P<0·001; (d) slope=0·05, P=0·179
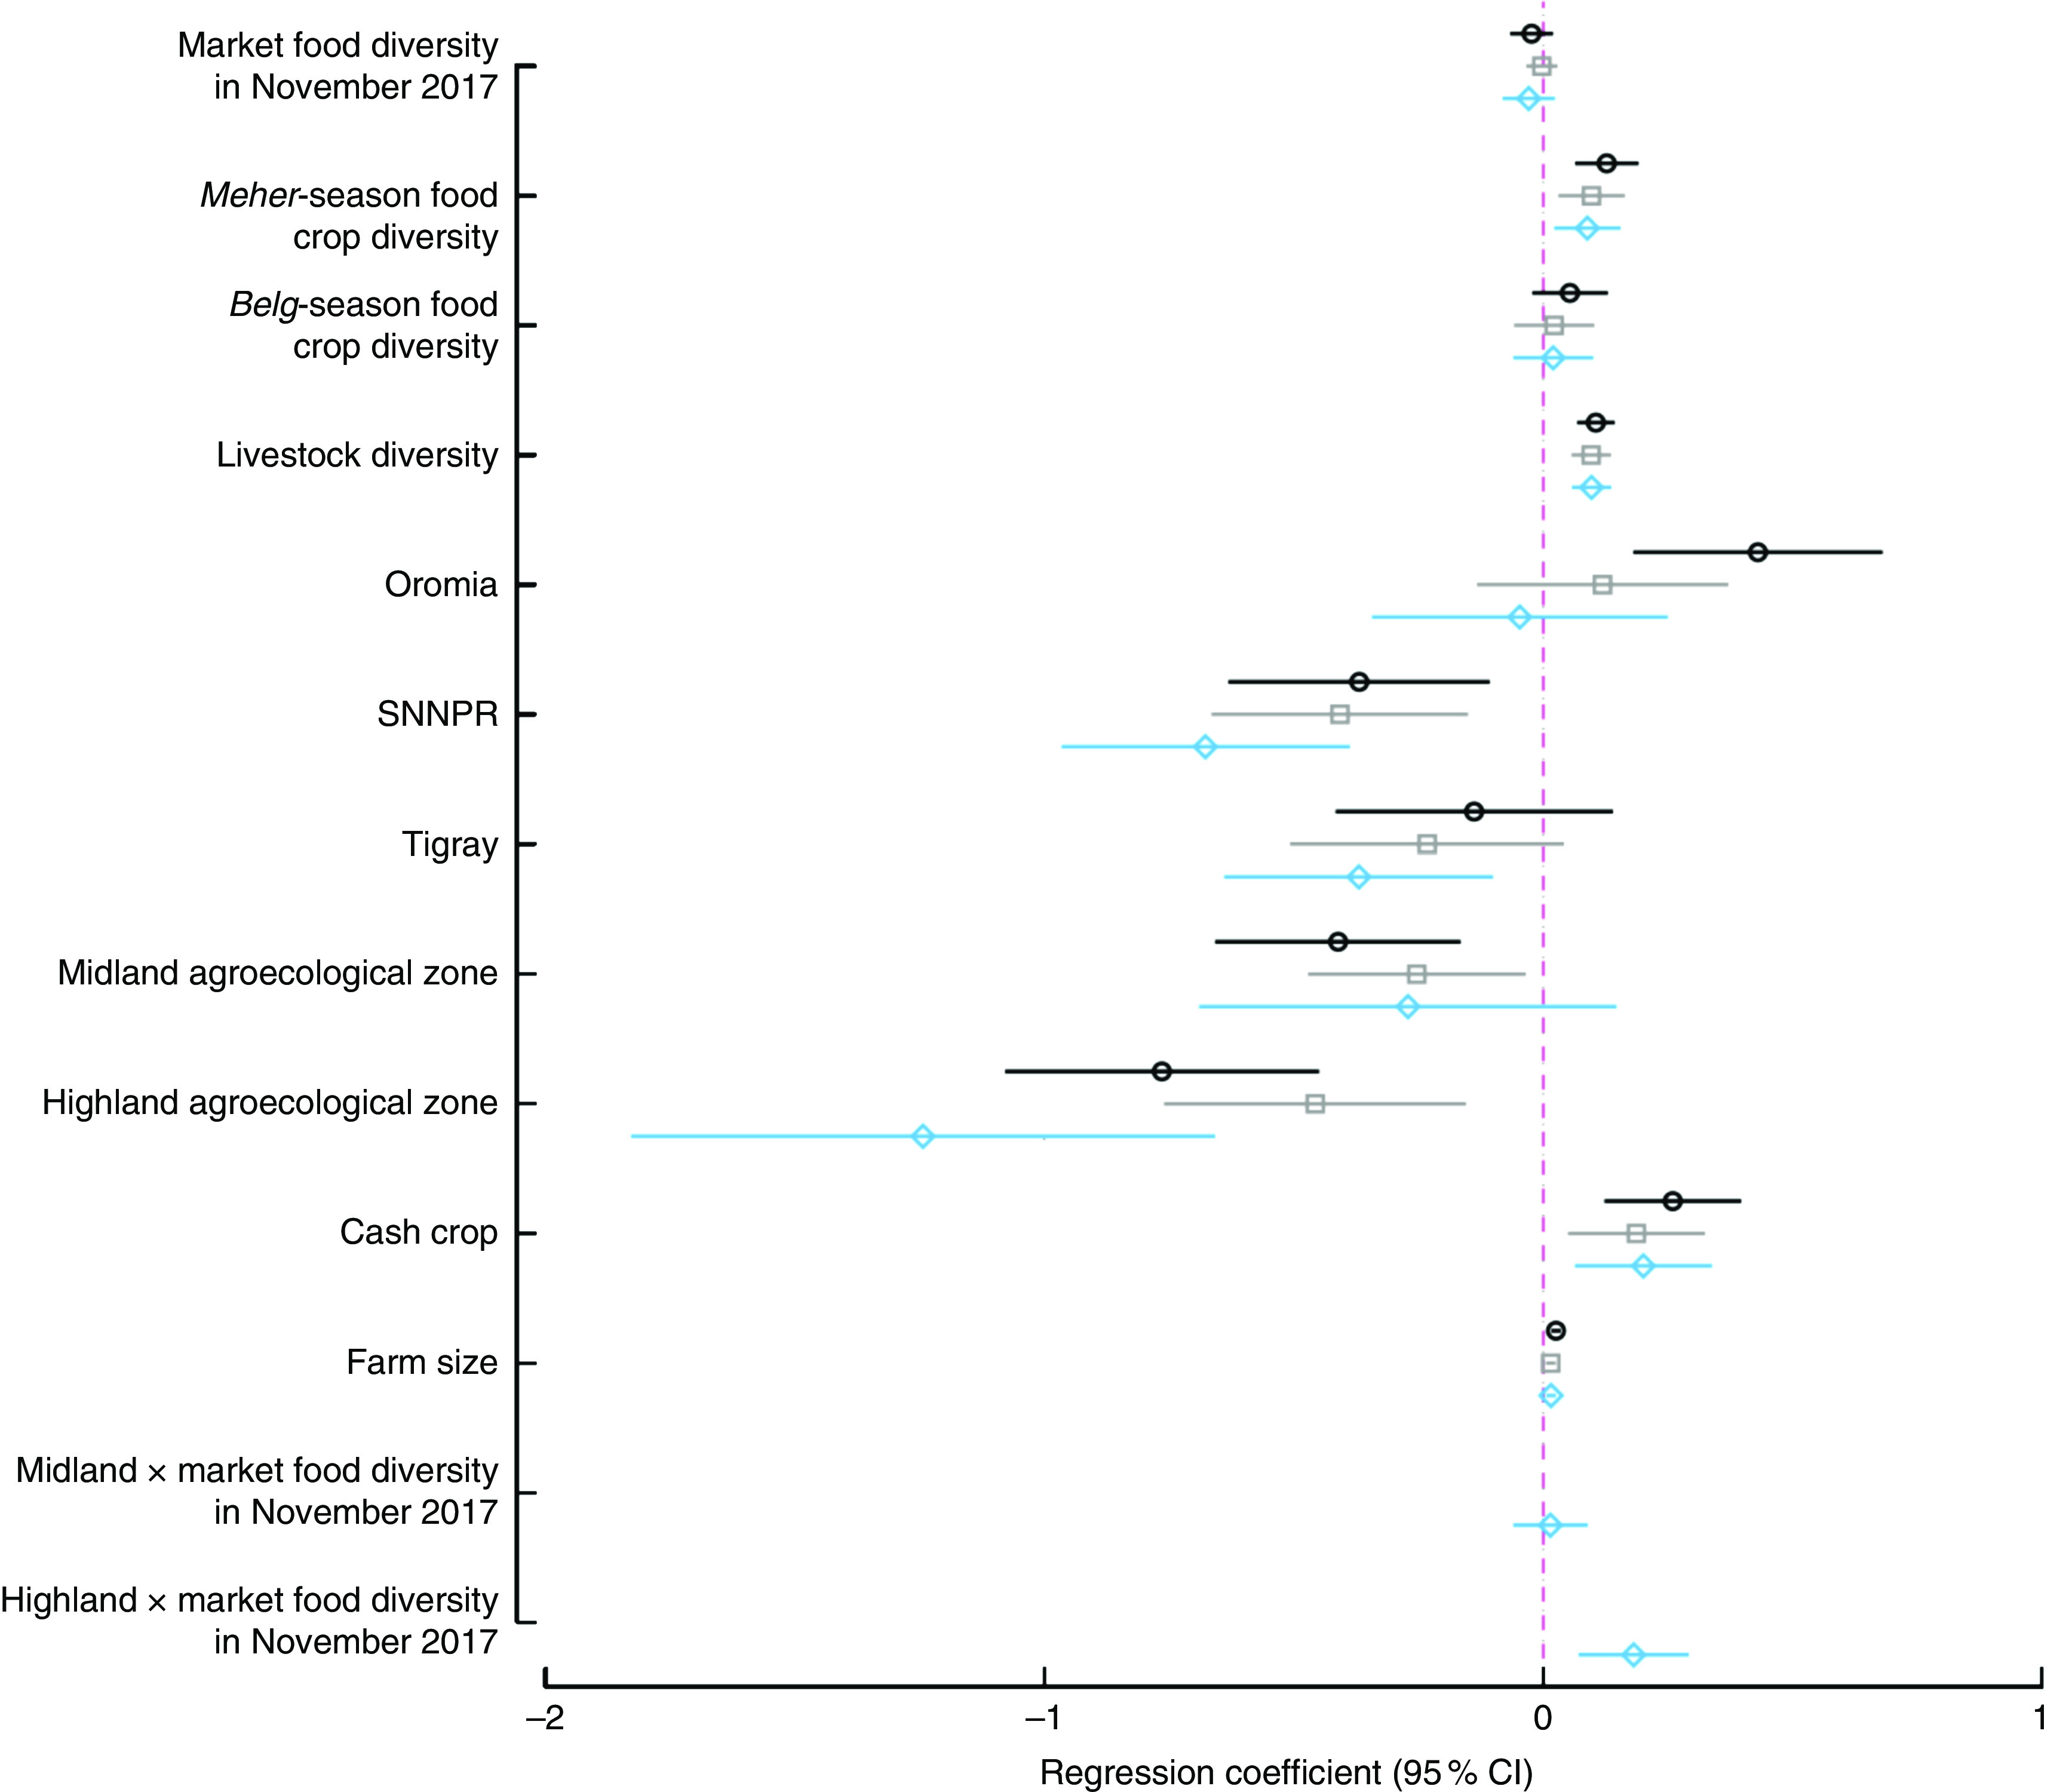
 ), multivariate models without interaction terms (
 ) and multivariate models with interaction terms (
 ). Multivariate models adjusted for region, education, women’s education, wealth quintiles, woman’s age, age of the household head, household size, access to improved water and sanitation, and kebele-level clustering (SNNPR, Southern Nations, Nationalities and Peoples’ Region). Other coefficients are presented in the online supplementary material, Supplemental Table 3
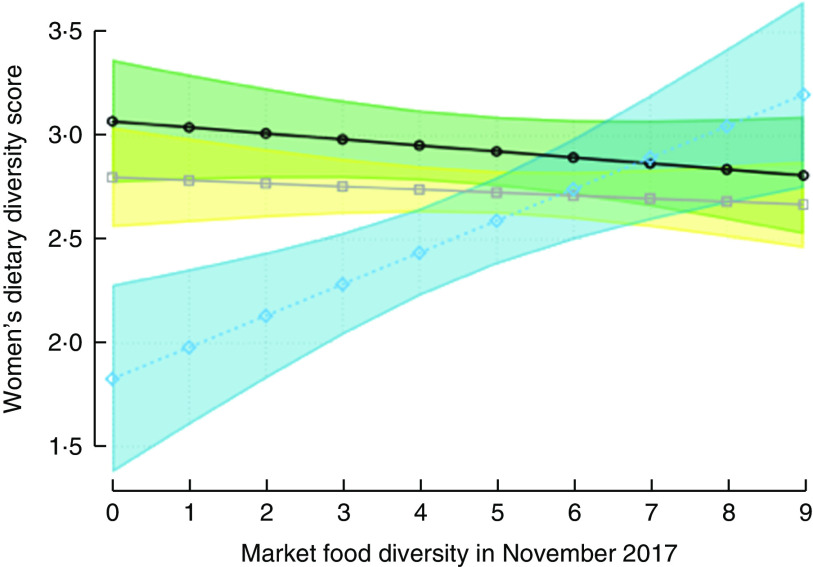
 ,
,  , lowland;
  ,
,  , midland;
  ,
,  , highland) and market food diversity; Agriculture to Nutrition (ATONU) study, rural Ethiopia, November 2016–January 2017. Highland agroecological zone × market food diversity has estimated slope=0·18 and P=0·001
References
-
- Yimer F & Tadesse F (2015) Women’s Empowerment in Agriculture and Dietary Diversity in Ethiopia. Working Paper no. 80. Washington, DC: International Food Policy Research Institute.
-
- Ruel MT, Quisumbing AR & Balagamwala M (2018) Nutrition-sensitive agriculture: what have we learned so far? Glob Food Sec 17, 128–153.
-
- Central Statistical Agency & ICF (2016) Ethiopia Demographic and Health Survey 2016: Key Indicators Report. https://www.usaid.gov/sites/default/files/documents/1860/Ethiopia%20DHS%... (accessed June 2017).
Publication types
MeSH terms
LinkOut - more resources
Full Text Sources
Miscellaneous
