

Color visual acuity in preperimetric glaucoma and open-angle glaucoma
- PMID: 30995280
- PMCID: PMC6469804
- DOI: 10.1371/journal.pone.0215290
Color visual acuity in preperimetric glaucoma and open-angle glaucoma
Abstract
Purpose: To investigate the clinical significance of color visual acuity (CVA) in preperimetric glaucoma (PPG) and open-angle glaucoma (OAG).
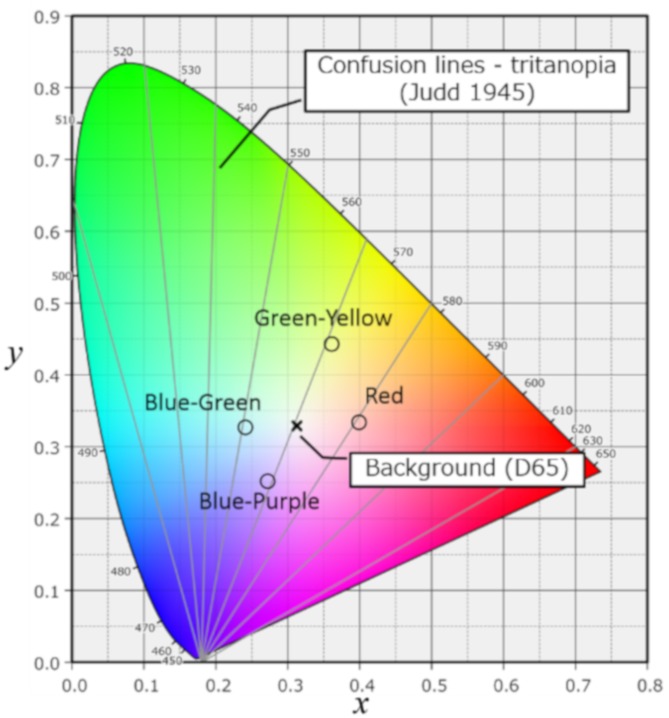
Methods: A total of 123 eyes of 73 subjects (22 normal eyes, 14 PPG eyes, and 87 OAG eyes; mean age: 44.9 ± 10.1 years, age range: 21-64 years) were enrolled. CVA was tested for red, green-yellow, blue-green and blue-purple with a newly developed test.
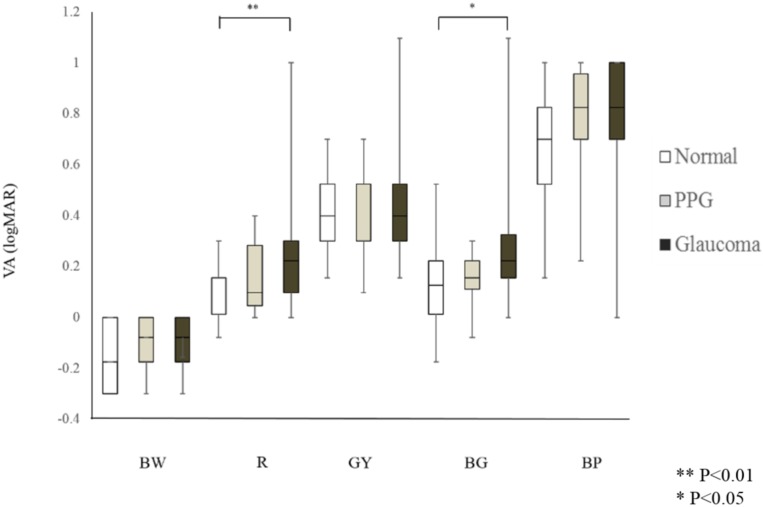
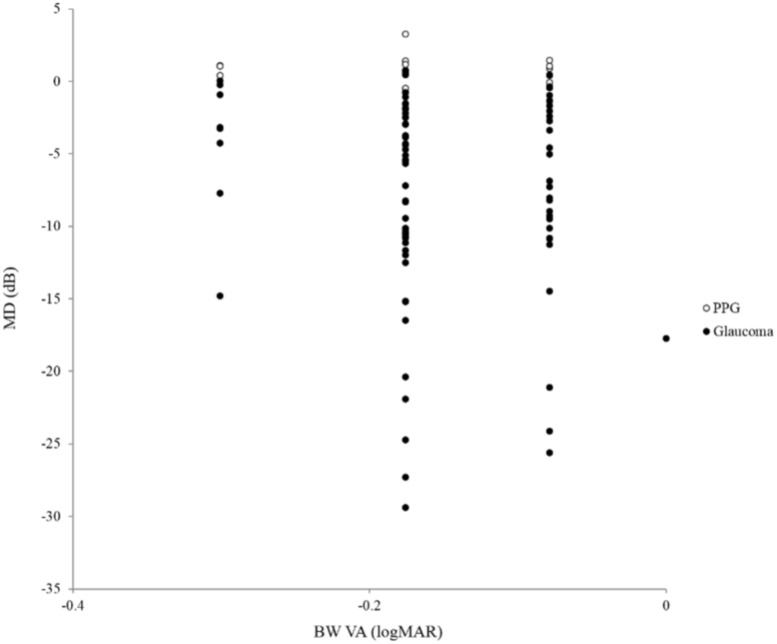
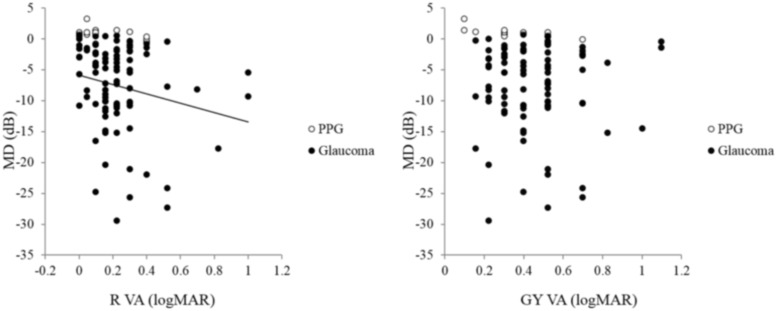
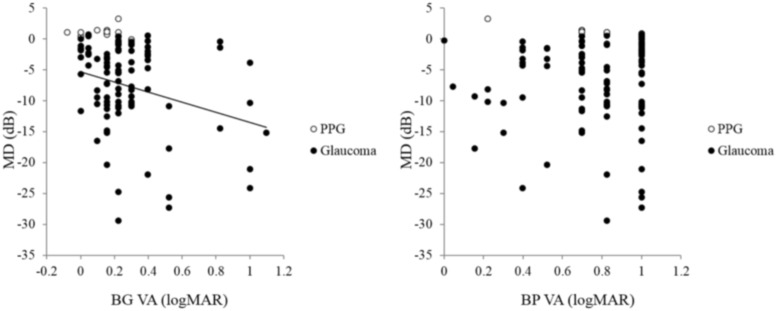
Results: There was no statistical difference in clinical background factors, including age, sex, intraocular pressure, or spherical equivalent between the three groups. Red VA and blue-green VA were significantly worse in the OAG eyes than in the normal eyes (P = 0.008 and P = 0.015, respectively), although green-yellow VA and blue-purple VA were not significantly worse. Furthermore, red VA and blue-green VA were significantly correlated with MD in a group of eyes with either PPG or OAG (r = -0.23, P = 0.023; r = -0.25, P = 0.012, respectively), but green-yellow VA and blue-purple VA were not.
Conclusion: Red VA and blue-green VA were detectably worse in eyes with OAG, in close association with the degree of functional loss. This suggests that measuring CVA with the new color test described here may be a promising supplement to existing methods of detecting glaucoma and evaluating its severity.
Conflict of interest statement
The authors have declared that no competing interests exist.
Figures
Similar articles
-
Age-related changes of color visual acuity in normal eyes.PLoS One. 2021 Nov 29;16(11):e0260525. doi: 10.1371/journal.pone.0260525. eCollection 2021. PLoS One. 2021. PMID: 34843576 Free PMC article.
-
[A study of para-foveal color vision in normal-tension and primary open angle glaucoma eyes].Nippon Ganka Gakkai Zasshi. 1993 Apr;97(4):526-31. Nippon Ganka Gakkai Zasshi. 1993. PMID: 8317374 Japanese.
-
A Novel Motion-on-Color Paradigm for Isolating Magnocellular Pathway Function in Preperimetric Glaucoma.Invest Ophthalmol Vis Sci. 2015 Jul;56(8):4439-46. doi: 10.1167/iovs.15-16394. Invest Ophthalmol Vis Sci. 2015. PMID: 26193920
-
Comparison between broadband and monochromatic photopic negative response in full-field electroretinogram in controls and subjects with primary open-angle glaucoma.Doc Ophthalmol. 2019 Feb;138(1):21-33. doi: 10.1007/s10633-018-09668-1. Epub 2019 Jan 12. Doc Ophthalmol. 2019. PMID: 30635745
-
[A new approach for studying the retinal and choroidal circulation].Nippon Ganka Gakkai Zasshi. 2004 Dec;108(12):836-61; discussion 862. Nippon Ganka Gakkai Zasshi. 2004. PMID: 15656089 Review. Japanese.
Cited by
-
Democratizing Health Care in the Metaverse: How Video Games can Monitor Eye Conditions Using the Vision Performance Index: A Pilot Study.Ophthalmol Sci. 2023 Jun 5;4(1):100349. doi: 10.1016/j.xops.2023.100349. eCollection 2024 Jan-Feb. Ophthalmol Sci. 2023. PMID: 37869021 Free PMC article.
-
Does Retinal Ganglion Cell Loss Precede Visual Field Loss in Glaucoma?J Glaucoma. 2019 Nov;28(11):945-951. doi: 10.1097/IJG.0000000000001380. J Glaucoma. 2019. PMID: 31688445 Free PMC article. Review.
-
[Awareness for glaucoma in the general population].Ophthalmologie. 2023 Nov;120(11):1088-1097. doi: 10.1007/s00347-023-01943-0. Epub 2023 Oct 17. Ophthalmologie. 2023. PMID: 37847376 Review. German.
-
Clinical Applications of the Cone Contrast Test in Ophthalmology and Neurology.J Clin Med. 2025 Apr 29;14(9):3079. doi: 10.3390/jcm14093079. J Clin Med. 2025. PMID: 40364109 Free PMC article. Review.
References
-
- Quigley HA, Dunkelberger GR, Green WR. Retinal ganglion cell atrophy correlated with automated perimetry in human eyes with glaucoma. Am J Ophthalmol. 1989;107(5):453–64. - PubMed
Publication types
MeSH terms
LinkOut - more resources
Full Text Sources
