. 2019 Apr 16;27(3):793-805.e4.
doi: 10.1016/j.celrep.2019.03.053.

PAR2-Mediated cAMP Generation Suppresses TRPV4-Dependent Ca2+ Signaling in Alveolar Macrophages to Resolve TLR4-Induced Inflammation

Affiliations

PAR2-Mediated cAMP Generation Suppresses TRPV4-Dependent Ca2+ Signaling in Alveolar Macrophages to Resolve TLR4-Induced Inflammation

Sheikh Rayees et al. Cell Rep. .

Abstract

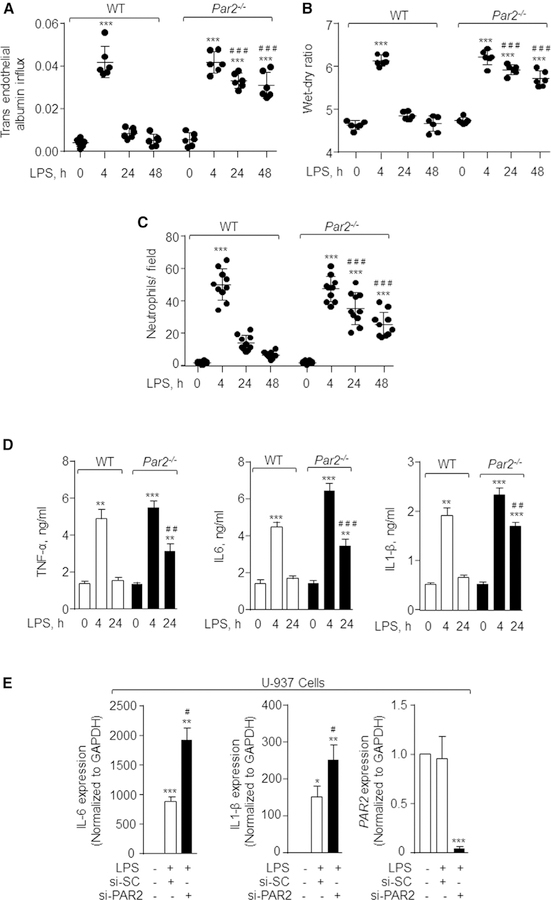
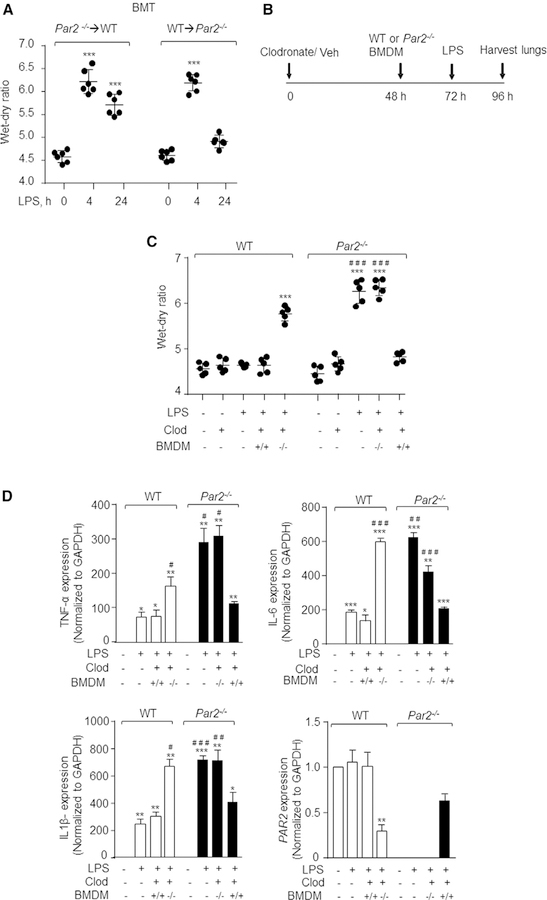
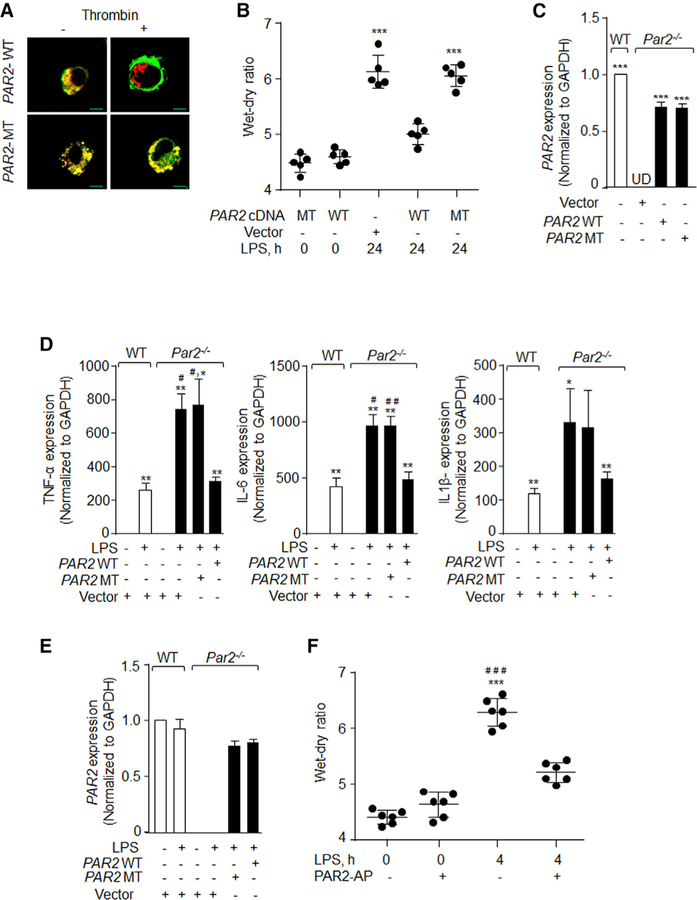
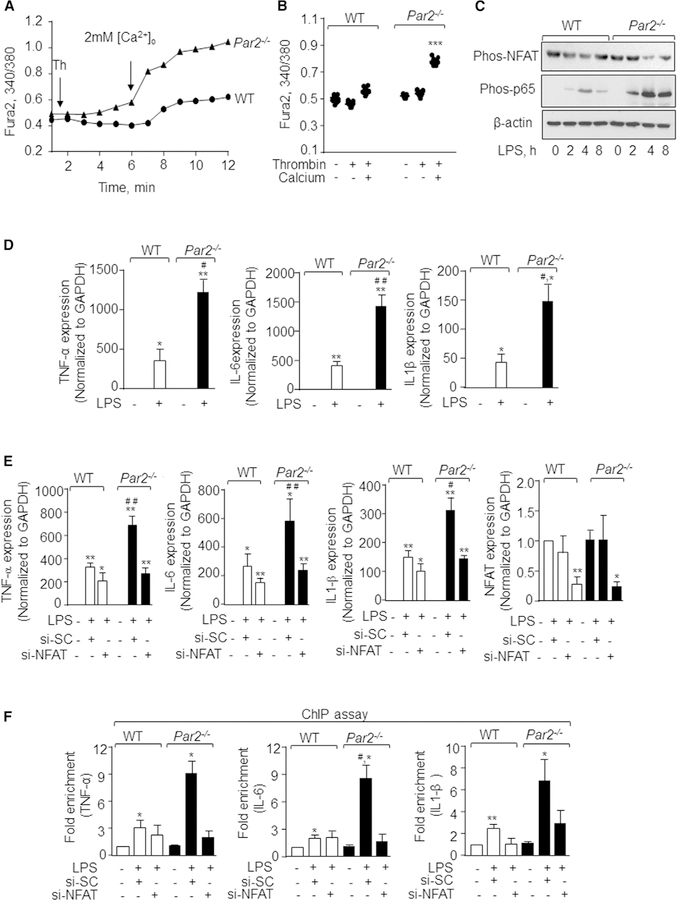
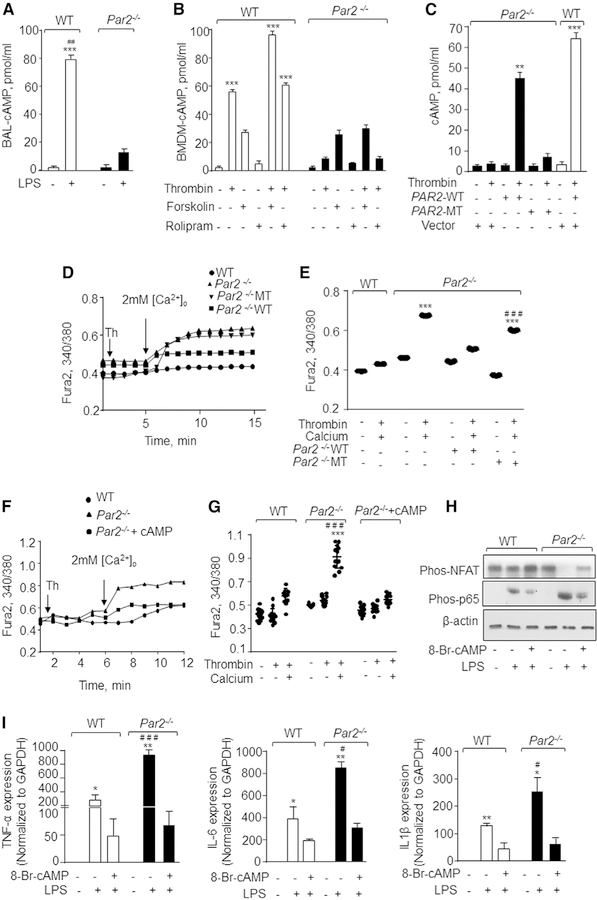
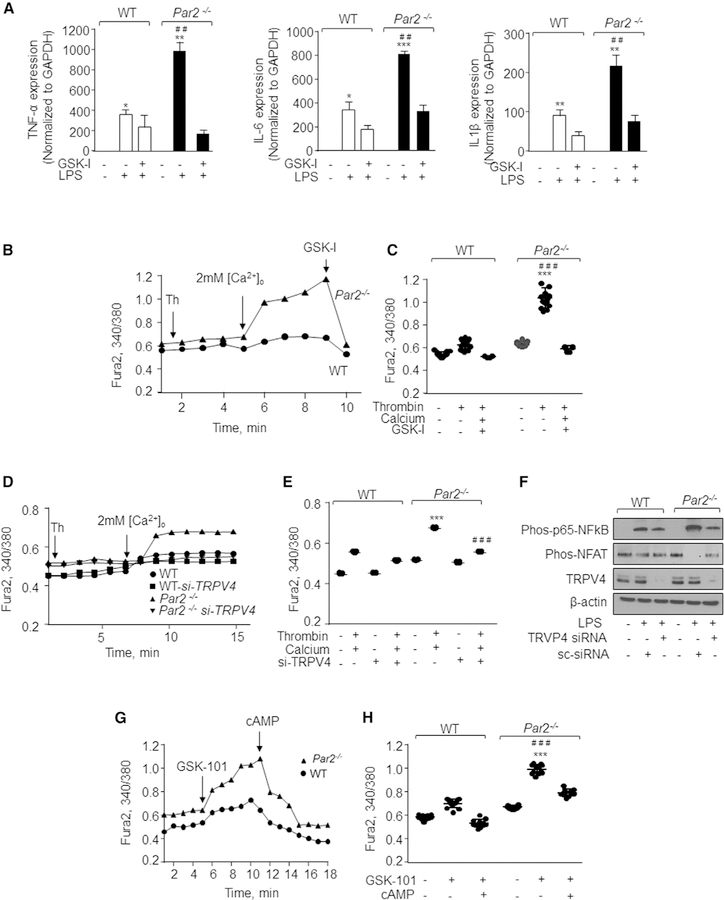
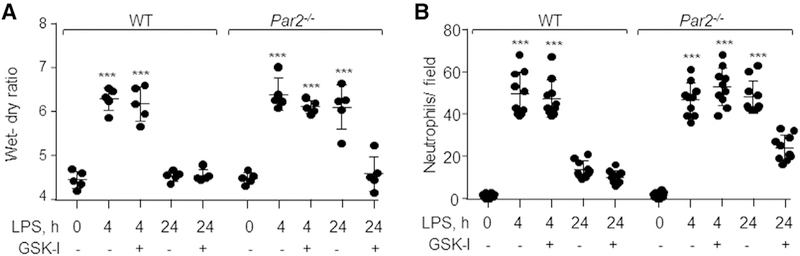
Alveolar macrophages (AMs), upon sensing pathogens, trigger host defense by activating toll-like receptor 4 (TLR4), but the counterbalancing mechanisms that deactivate AM inflammatory signaling and prevent lethal edema, the hallmark of acute lung injury (ALI), remain unknown. Here, we demonstrate the essential role of AM protease-activating receptor 2 (PAR2) in rapidly suppressing inflammation to prevent long-lasting injury. We show that thrombin, released during TLR4-induced lung injury, directly activates PAR2 to generate cAMP, which abolishes Ca2+ entry through the TRPV4 channel. Deletion of PAR2 and thus the accompanying cAMP generation augments Ca2+ entry via TRPV4, causing sustained activation of the transcription factor NFAT to produce long-lasting TLR4-mediated inflammatory lung injury. Rescuing thrombin-sensitive PAR2 expression or blocking TRPV4 activity in PAR2-null AMs restores their capacity to resolve inflammation and reverse lung injury. Thus, activation of the thrombin-induced PAR2-cAMP cascade in AMs suppresses TLR4 inflammatory signaling to reinstate tissue integrity.

Keywords: Ca(2+) entry; NFAT; TRPV4; acute lung injury; alveolar macrophages; cAMP; protease-activating receptor 2.


Conflict of interest statement

DECLARATION OF INTERESTS

The authors declare no competing interests.

Figures

Figure 1
Figure 1. Deletion of PAR2 Impairs Resolution of Lung Inflammatory Vascular Injury Induced by LPS
(A and B) WT and Par2−/− mice were exposed to nebulized LPS (1 mg/mL) for 45 min. 30 min before sacrificing the mice at the indicated times, Evans blue-labeled albumin was injected retro-orbitally into each mouse. Lung vascular inflammatory injury was determined by measuring albumin influx (A) and lung wet-dry ratio (B). n = 6 mice/group. (C) Neutrophil count was performed (per field) on H&E-stained WT and Par2−/− lung sections. The plot shows individual values from three independent experiments. In (A)–(C), the data are presented as mean ± SD. ***p < 0.001 indicates values that are significantly different from control group receiving vehicle alone. ###p < 0.001 indicates values that are significantly different from WT mice post-24 and −48 h LPS challenge. (D) After 4 and 24 h following LPS-induced injury, bronchoalveolar lavage was obtained from WT and Par2−/− mice and the levels of the indicated cytokines were determined by ELISA. Data are represented as mean ± SD from experiments that were performed three times independently. **p < 0.01 and ***p < 0.001 indicate values that are significantly different from mice receiving vehicle alone. ##p < 0.01 and ###p < 0.001 indicate values that were significantly different from WT-mice post-4 and −24 h LPS challenge. (E) U-937 human monocytic cells were differentiated to macrophages by exposing them to PMA (100 ng/mL) for 48 h. Differentiated macrophages were then transfected with scrambled or PAR2 siRNA. After 48 h, the cells were serum starved for 30 min followed by addition of 1 mg/mL LPS. Expression of indicated cytokines was determined using qPCR. GAPDH was used as an internal control. Data are represented as mean ± SD; experiments were performed three times individually. *p < 0.05 and **p < 0.01 indicates values that are significantly different from unstimulated scrambled siRNA transfected cells. #p < 0.05 indicates values that are significantly different from cells transfected with control siRNA post-4 h LPS challenge. In all figures, one-way ANOVA followed by paired two-tailed t test was used to assess significance between groups.
Figure 2
Figure 2. AM PAR2 Is Required to Resolve Lung Inflammatory Vascular Injury
(A) After bone marrow irradiation, WT mice were injected with Par2−/− bone marrow cells and vice versa. Six weeks after the transplant, the mice were challenged with nebulized LPS for 45 min, and the lung wet-dry ratio was determined at the indicated times in the chimeric mice. The plot shows individual values with mean ± SD. ***p < 0.001 indicates values significantly different from mice receiving vehicle (no LPS). n = 6 mice/group. (B and C) Clodronate liposomes (300 mg/mouse in a volume of 60 mL) were injected i.t. into WT or PAR2-null mice, and, after 48 h, BMDMs isolated from WT or PAR2-null mice were adoptively transferred to mouse lungs. At 72 h, the mice were exposed to nebulized LPS for 45 min, and lungs and BAL were harvested at 96 h to determine lung injury (B). The plot shows individual values of lung wet-dry ratio in indicated mice post-LPS challenge (C). ***p < 0.001 indicates values that are significantly different from control group receiving vehicle alone. ###p < 0.001 indicates values that are significantly different from corresponding WT mice group post-LPS challenge. n = 5 mice/group. (D) BAL macrophages were isolated and RNA was extracted from them to determine cytokine expression. Data are represented as mean ± SD of three independently performed experiments. *p < 0.05, **p < 0.01, and ***p < 0.001 indicate values that are significantly different from corresponding vehicle control group. #p < 0.05, ##p < 0.01, and ###p < 0.001 indicate values that are significantly different from WT mice that received LPS. In all figures, one-way ANOVA followed by paired two-tailed t test was used to assess significance between groups.
Figure 3
Figure 3. Thrombin Activation of PAR2 in Macrophages Suppresses LPS-Induced Inflammatory Lung Injury
(A) PAR2-null BMDMs were transfected with WT dual tagged PAR2 cDNA (WT) or a dual tagged MT-PAR2 cDNA (resistant to thrombin cleavage [MT]) by electroporation. After 48 h, the cells were serum starved in media containing 0.1% FBS for 30 min. The cells were then stimulated with 50 U/mL thrombin, fixed with 2% paraformaldehyde for 10 min, and imaged using confocal microscope (scale bars, 5 mm). Images from a representative experiment are shown, and these experiments were performed three times independently. (B) Liposomes complexed with either WT-PAR2 or MT-PAR2 cDNA were administered i.t into WT or Par2−/− mice, and, after 48 h, the mice were exposed to nebulized LPS for 45 min. Lung injury was assessed by determining lung wet-dry ratio, 24 h after LPS inhalation. The plot shows individual values with mean ± SD. ***p < 0.001 indicates values that are significantly different from PAR2-null mice receiving control vector. n = 5 mice/ group. (C) Lungs from PAR2-null mice transducing WT-PAR2 or MT-PAR2 cDNA were digested with collagenase and stained with AM markers (CD11c, CD45, and Siglec-F antibodies). AMs (CD11c+/CD45+/Siglec F+) were sorted and PAR2 expression was determined using qPCR taking GAPDH as control. AMs sorted from WT lungs served as control for PAR2 expression. The plot shows mean ± SD of PAR2 expression. ***p < 0.001 indicates values that are significantly different from PAR2-null mice receiving control vector. The experiment was performed three times independently. (D and E) WT and Par2−/− BMDMs were transfected with WT-PAR2 cDNA or MT-PAR2 cDNA. After 48 h of transfection, the cells were stimulated with LPS for 4 h. RNA was isolated and the expression of indicated pro-inflammatory genes (D) and PAR2 (E) was determined by qPCR. The data are represented as mean ± SD of three independent experiments. *p < 0.05 and **p < 0.01 indicate a significant increase in expression levels in comparison to unstimulated cells. #p < 0.05 and ##p < 0.01 indicate significant increase in expression of cytokines in comparison to WT-BMDMs post-LPS challenge. (F) WT mice were exposed to nebulized LPS for 45 min and after 1 h PAR2-AP (SLIGRL-NH2) or control peptide (LRGILS) was delivered i.t. (1 mg/kg of body weight). Lung wet-dry ratio was determined at 4 h after LPS exposure. The plot shows individual values with mean ± SD n = 6 mice /group. ***p < 0.001 indicates values significantly different from control mice. ###p < 0.001 indicates values that are significantly different from mice receiving PAR2-AP with LPS. In all figures, one-way ANOVA followed by paired two-tailed t test was used to assess significance between groups.
Figure 4
Figure 4. Loss of PAR2 Augments Ca2+Entry and Cytokine Generation via NFAT Activity
(A and B) WT and Par2−/− BMDMs were loaded with Fura2 for 15 min following which they were stimulated with thrombin in Ca2+-free media to deplete intracellular stores. Ca2+ entry was invoked by repleting 2 mM Ca2+ at ~360 s. A representative trace is shown in (A), while (B) shows individual data points along with mean ± SD of 12–15 cells. Results show data from experiments that were repeated three times. ***p < 0.001 indicates values that were significantly different from WT-BMDMs. (C) WT and Par2−/− BMDMs were stimulated with LPS (1 mg/mL) for indicted times and lysed. Phosphorylation of p65 subunit of NF-ҡB and NFAT was determined by western blotting using NFAT or NF-ҡB phosphor-specific antibodies. Immunoblotting with anti-actin antibody served as a loading control. A representative immunoblot is shown from experiments that were independently repeated three times. (D) BMDMs were left unstimulated or stimulated with LPS for 4 h and RNA was isolated. The expression of indicated pro-inflammatory genes was determined by qPCR. Data are represented as mean ± SD from three independent experiments. *p < 0.05 and **p < 0.01 indicate values that were significantly different from unstimulated BMDMs. #p < 0.05 and ##p < 0.01 indicate values that were significantly different from WT-BMDMs post-LPS challenge. (E) WT and Par2−/− BMDMs were transfected with scrambled or NFATc1 siRNA, and after 48 h the cells were stimulated with LPS for 4 h. The RNA was isolated and the expression of indicated pro-inflammatory genes was determined by qPCR. Data are represented as mean ± SD from three independent experiments. *p < 0.05 and **p < 0.01 indicate values significantly different from untreated BMDMs. #p < 0.05 and ##p < 0.01 indicate values that were significantly different from WT-BMDMs post-LPS challenge. (F) DNA fragments obtained from transfected and control WT and Par2−/− BMDMs were purified. qPCR was performed using primers specific for TNF-a, IL-6, and IL1-b. Data are represented as mean ± SD of three independent experiments. *p < 0.05 and **p < 0.01 indicate values significantly different from untreated BMDMs. #p < 0.05 indicates values that were significantly different from WT-BMDMs post-LPS challenge. In all figures, one-way ANOVA followed by paired two-tailed t test was used to assess significance between groups.
Figure 5
Figure 5. PAR2 Suppresses Ca2+Entry and NFAT-Dependent Cytokine Generation by Generating cAMP
(A) BAL-AM from control or LPS challenged mice were obtained after 30 min, and intracellular cAMP was measured using ELISA kit. Data are represented as mean ± SD of three independently performed experiments. ***p < 0.001 indicates a significant increase in cAMP concentration in comparison to control cells. ##p < 0.01 indicates a significant increase in cAMP as compared to the Par2−/− plus LPS group. (B) WT and Par2−/− BMDMs were stimulated with indicated agonists and cAMP levels were determined using an ELISA kit. Data represent mean ± SD of three experiments. ***p < 0.001 indicates values significantly different from corresponding Par2−/− BMDMs. (C) BMDMs were transfected with WT-PAR2 or MT-PAR2 cDNA. After 48 h of transfection, the cells were stimulated with thrombin for 30 min (50 U/mL) and intracellular cAMP was estimated using the ELISA kit. The data are represented as mean ± SD of three experiments. **p < 0.01 and ***p < 0.001 indicate a significant increase in cAMP levels in comparison to unstimulated or MT-PAR2 transfected cells post thrombin stimulation. (D and E) BMDMs were transfected with WT-PAR2 or MT-PAR2 cDNA or control vector. The cells were stimulated with thrombin in Ca2+-free media followed by repletion of extracellular Ca2+ (2 mM) at ~300 s. A representative trace is shown in (D) from three independent experiments, while (E) shows individual data points along with mean ± SD of 12–15 cells. ***p < 0.001 indicates values that were significantly different from WT BMDMs. ###p < 0.001 indicates values that were significantly different from Par2−/−-null BMDMs transfected with WT-PAR2 after thrombin stimulation. (F and G) BMDMs were stimulated with thrombin in Ca2+-free media followed by stimulation with 250 mM 8-Br-cAMP at ~180 s and subsequent repletion of extracellular Ca2+ (2 mM) at ~360 s. A representative trace is shown in (F), while (G) shows individual data points along with mean ± SD of 12–15 cells. Results show data from experiments that were repeated three times. ***p < 0.001 indicates values that were significantly different WT BMDMs treated with thrombin only. ###p < 0.001 indicates values that were significantly different from BMDMs were treated with 8-Br-cAMP. (H) BMDMs were pre-treated with 250 mM 8-Br-cAMP for 15 min followed by LPS stimulation for 4 h. The phosphorylation of p65-NF-ҡB and NFAT was estimated by western blotting. A representative immunoblot is shown from independent experiments that were repeated 3 times. (I) In a separate experiment under the same experimental conditions (i.e., 8-Br-cAMP pre-treatment and LPS stimulation of BMDMs), expression of the indicated pro-inflammatory genes was measured by qPCR. Data are represented as mean ± SD of three independent experiments. *p < 0.05 and **p < 0.05 indicate values that were significantly different from untreated BMDMs. #p < 0.05 and ###p < 0.001 indicate values that were significantly different from WT-BMDMs post-LPS challenge. In all figures, one-way ANOVA followed by paired two-tailed t test was used to assess significance between groups.
Figure 6
Figure 6. TRPV4 Induces Ca2+ Entry and Promotes NFAT-Dependent Inflammatory Cytokine Generation
(A) WT and Par2−/− BMDMs were pre-treated with 100 nM GSK-I for 5 min followed by addition of 1 mg/mL of LPS. The expression of indicated pro-inflammatory genes was determined after 4 h by qPCR. Data are represented as mean ± SD of three independent experiments. *p < 0.05, **p < 0.01, and ***p < 0.001 indicate values that were significantly different from unstimulated BMDMs. ##p < 0.01 indicates values that were significantly different from WT-BMDMs post-LPS challenge. (B–E) BMDMs were left un-transfected (B and C) or transfected with control or TRPV4 siRNA (D and E). These cells were stimulated with thrombin in Ca2+-free media followed by repletion of extracellular Ca2+ (2 mM). GSK-I (100 nM) was then added at the peak phase of Ca2+ entry (arrow) in un-transfected cells to assess TRPV4 activity (B and C). A representative trace is shown in (B) and (D), while (C) and (E) show individual data points along with mean ± SD of 8–15 cells. Results show data from experiments that were repeated three times. ***p < 0.001 indicates values that were significantly different from WT BMDMs. ###p < 0.001 indicates values that were significantly different from TRPV4-depleted BMDMs or BMDMs treated with GSK-I.
Figure 7
Figure 7. Inhibition of TRPV4 Resolves ALI
(A) WT and Par2−/− mice were challenged with LPS for 45 min followed by i.t. administration of TRPV4 antagonist, GSK-I (0.5 mg/kg, body weight), or vehicle post-30 min of lung injury. After 4 and 24 h, lung edema and neutrophil accumulation in the lungs were determined. Plot shows individual values of lung edema with mean ± SD. ***p < 0.001 indicates values that are significantly different from their respective control groups. n = 5 mice/group. (B) Neutrophil count was performed as described in Figure 1C. The plot shows individual values of neutrophils from three independent experiments with mean ± SD. ***p < 0.001 indicates a significant increase in neutrophil count as compared to the respective vehicle control group. In all figures, one-way ANOVA followed by paired two-tailed t test was used to assess significance between groups. (F) BMDMs were transfected with control or TRPV4 siRNA. Cells were then stimulated with 1 mg/mL LPS for 4 h. The phosphorylation of NFAT and NF-ҡB was estimated by western blotting. A representative immunoblot is shown from experiments that were independently repeated 3 times. (G and H) BMDMss were incubated in 2 mM Ca2+ containing media followed by stimulation with 50 nM of a TRPV4 agonist (GSK-101). Subsequently, 8-Br-cAMP was added at the peak phase of Ca2+ entry. A representative trace is shown in (G), and (H) shows individual data points along with mean ± SD of 12–15 cells. Results show data from experiments that were repeated three times. ***p < 0.001 indicates values that were significantly different from WT BMDMs. ###p < 0.001 indicates values that were significantly different from BMDMs treated with 8-Br-cAMP.

Similar articles

Cited by

References

    1. Arniges M, Fernández-Fernández JM, Albrecht N, Schaefer M, and Valverde MA (2006). Human TRPV4 channel splice variants revealed a key role of ankyrin domains in multimerization and trafficking. J. Biol. Chem 281, 1580–1586. - PubMed
    1. Bair AM, Thippegowda PB, Freichel M, Cheng N, Ye RD, Vogel SM, Yu Y, Flockerzi V, Malik AB, and Tiruppathi C (2009). Ca2+ entry via TRPC channels is necessary for thrombin-induced NF-kappaB activation in endothelial cells through AMP-activated protein kinase and protein kinase Cdelta. J. Biol. Chem 284, 563–574. - PMC - PubMed
    1. Balakrishna S, Song W, Achanta S, Doran SF, Liu B, Kaelberer MM, Yu Z, Sui A, Cheung M, Leishman E, et al. (2014). TRPV4 inhibition counteracts edema and inflammation and improves pulmonary function and oxygen saturation in chemically induced acute lung injury. Am. J. Physiol. Lung Cell. Mol. Physiol 307, L158–L172. - PMC - PubMed
    1. Ballinger MN, and Christman JW (2016). Pulmonary Macrophages: Overlooked and Underappreciated. Am. J. Respir. Cell Mol. Biol 54, 1–2. - PubMed
    1. Bang BR, Chun E, Shim EJ, Lee HS, Lee SY, Cho SH, Min KU, Kim YY, and Park HW (2011). Alveolar macrophages modulate allergic inflammation in a murine model of asthma. Exp. Mol. Med 43, 275–280. - PMC - PubMed

Publication types

MeSH terms