. 2019 May;569(7756):433-437.
doi: 10.1038/s41586-019-1161-z. Epub 2019 Apr 17.

Transcriptome-wide off-target RNA editing induced by CRISPR-guided DNA base editors

Affiliations

Transcriptome-wide off-target RNA editing induced by CRISPR-guided DNA base editors

Julian Grünewald et al. Nature. 2019 May.

Abstract

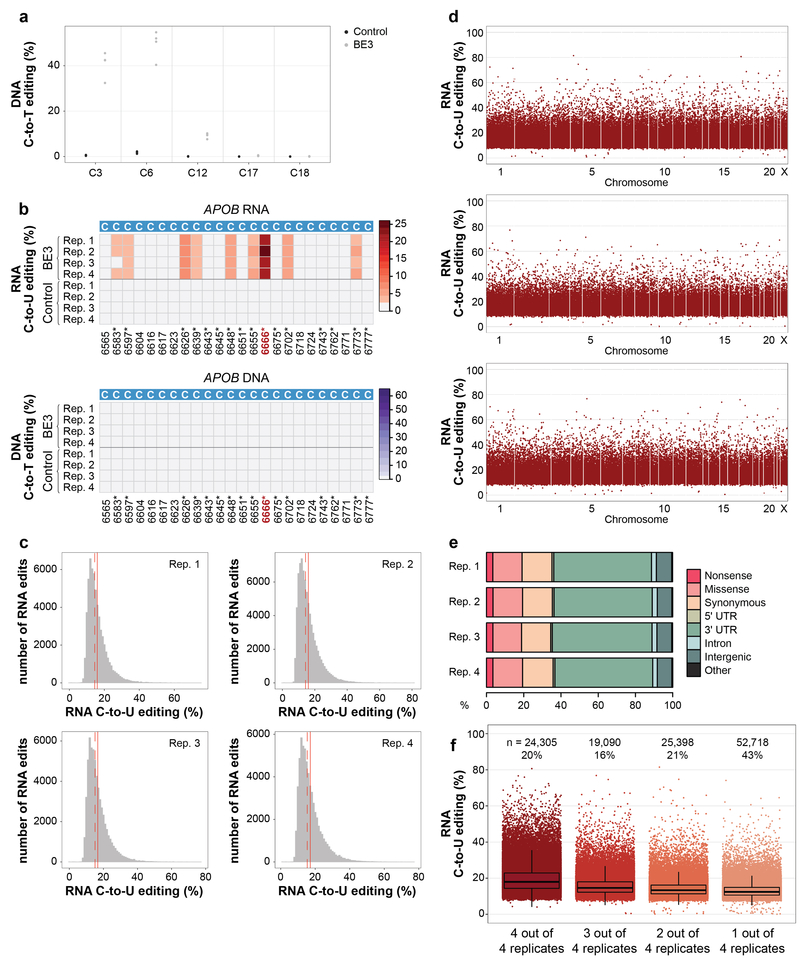
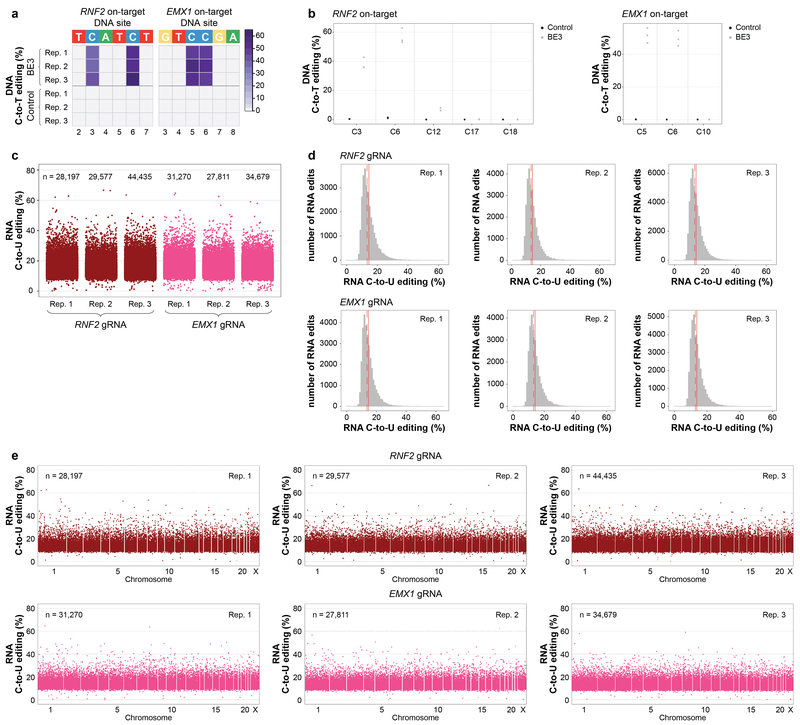
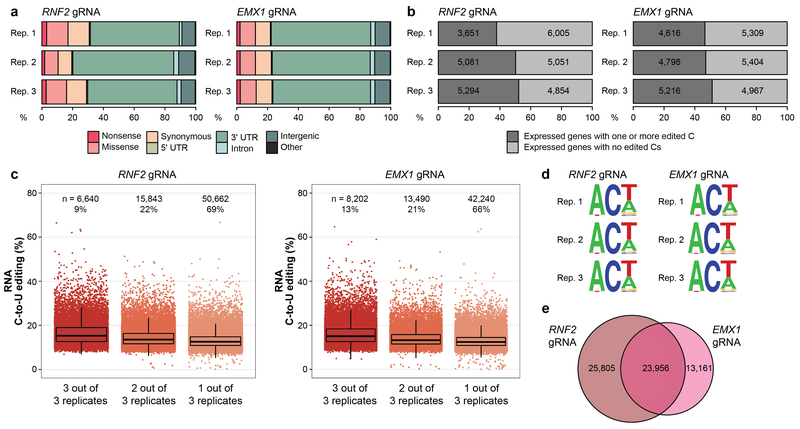
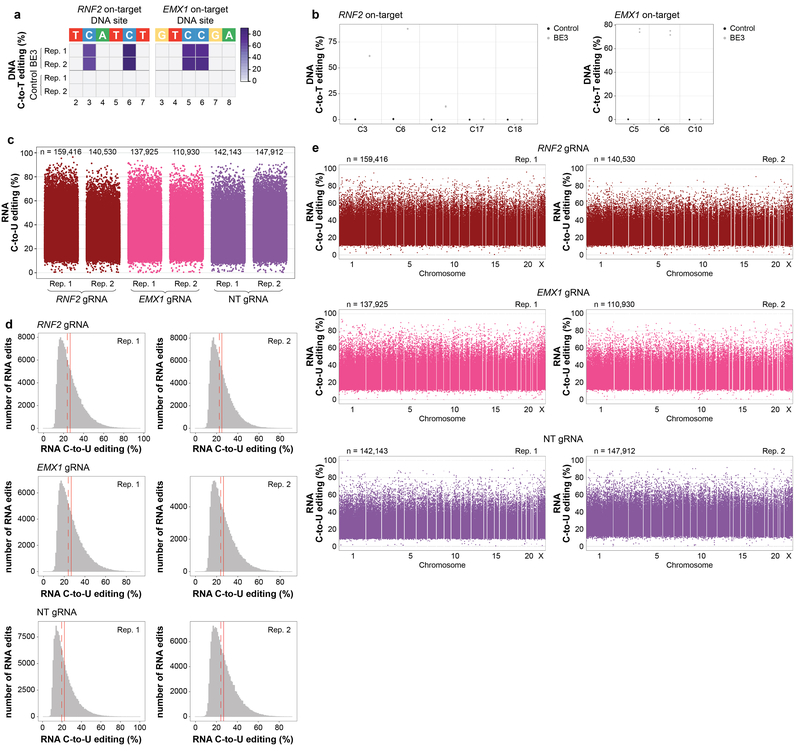
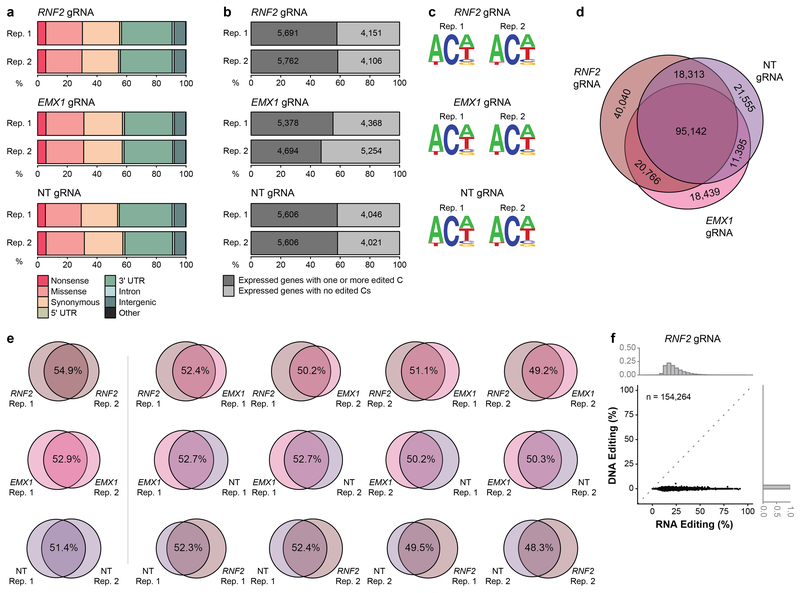
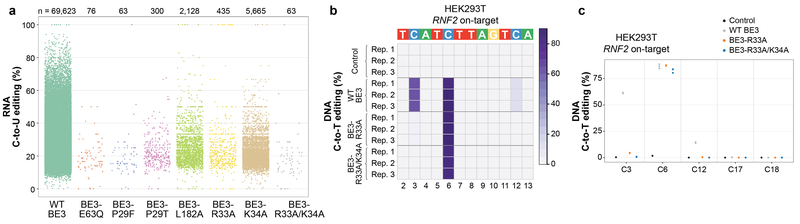
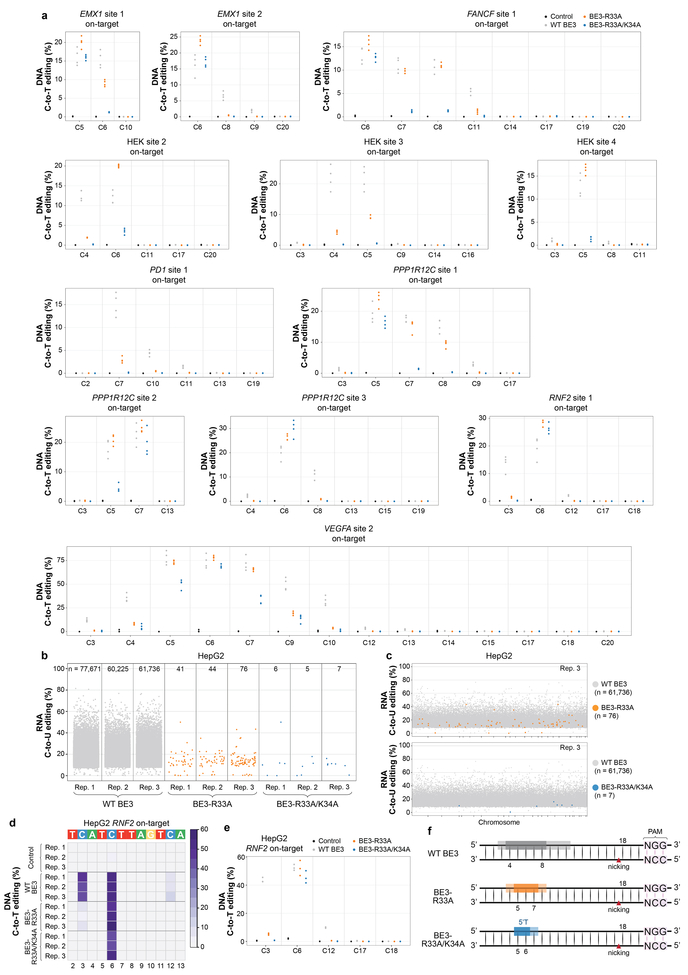
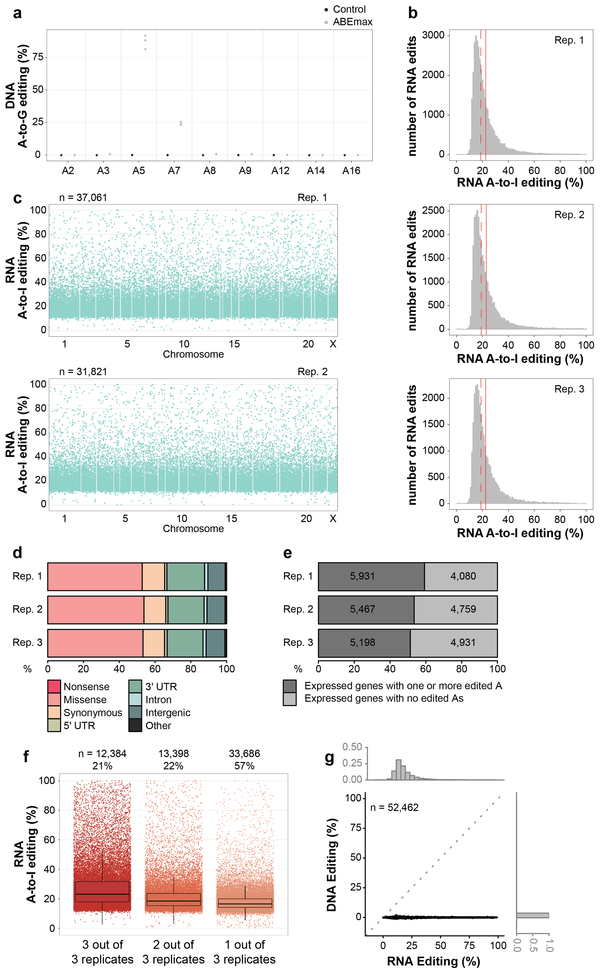
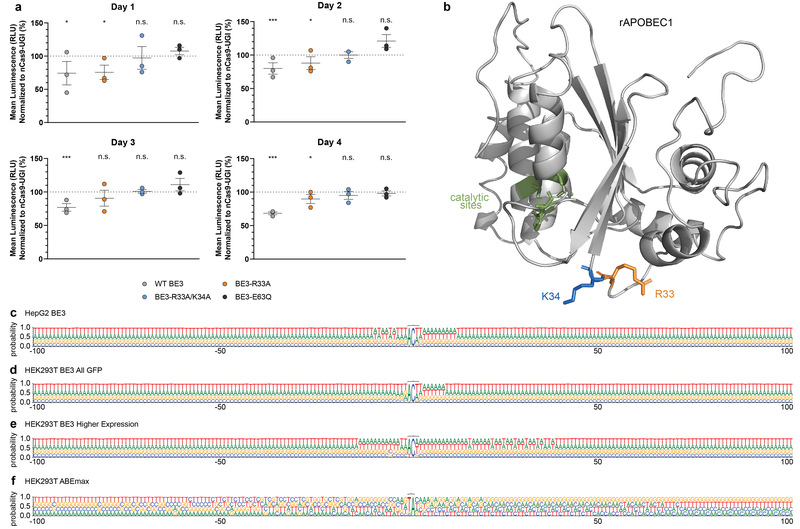
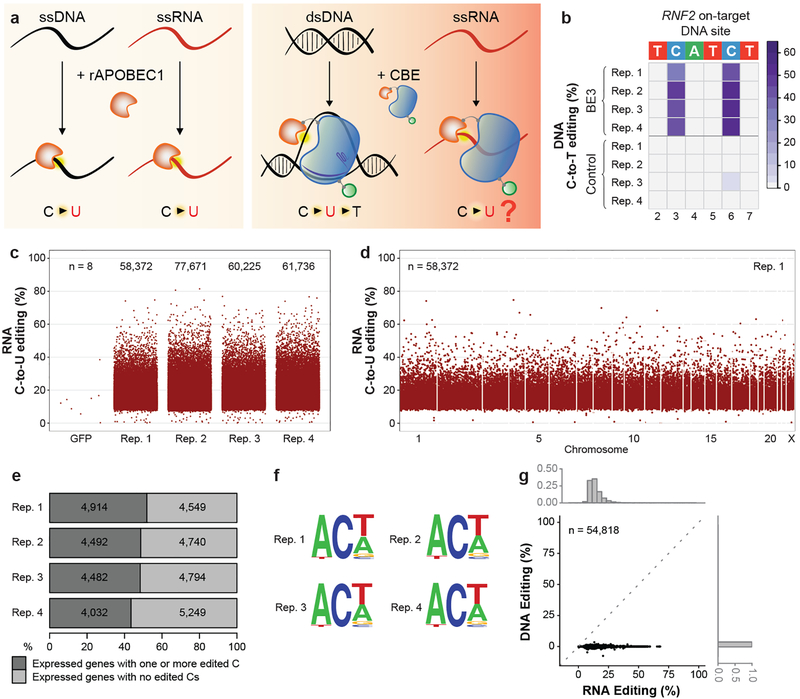
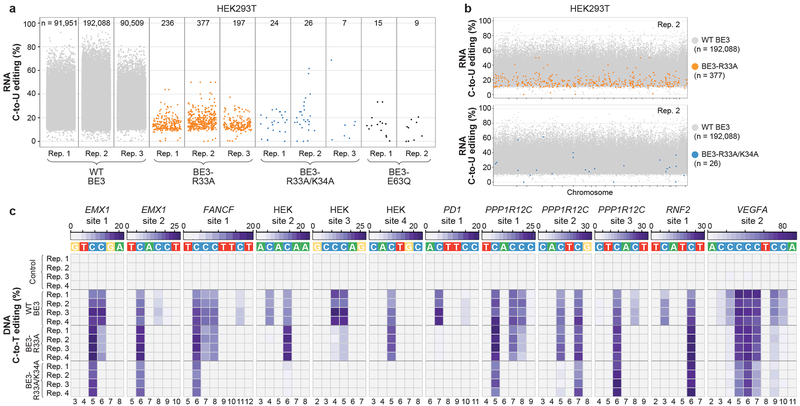
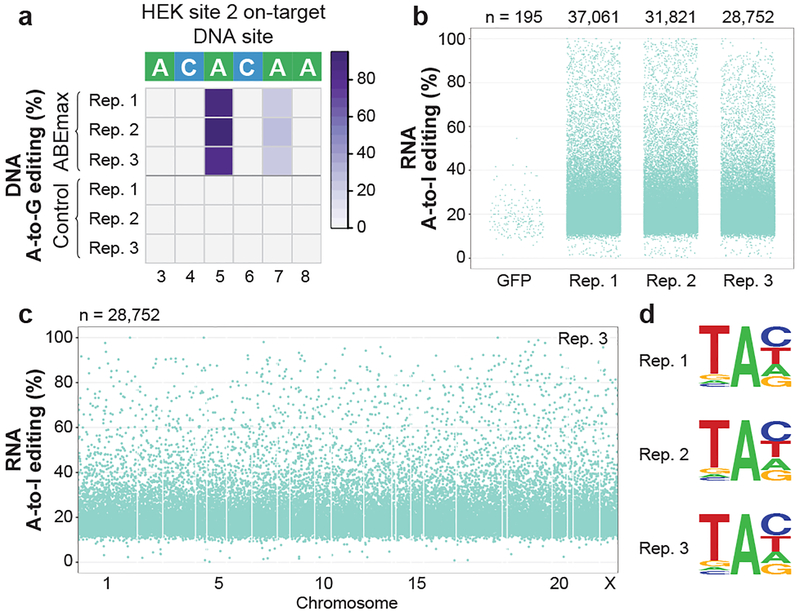
CRISPR-Cas base-editor technology enables targeted nucleotide alterations, and is being increasingly used for research and potential therapeutic applications1,2. The most widely used cytosine base editors (CBEs) induce deamination of DNA cytosines using the rat APOBEC1 enzyme, which is targeted by a linked Cas protein-guide RNA complex3,4. Previous studies of the specificity of CBEs have identified off-target DNA edits in mammalian cells5,6. Here we show that a CBE with rat APOBEC1 can cause extensive transcriptome-wide deamination of RNA cytosines in human cells, inducing tens of thousands of C-to-U edits with frequencies ranging from 0.07% to 100% in 38-58% of expressed genes. CBE-induced RNA edits occur in both protein-coding and non-protein-coding sequences and generate missense, nonsense, splice site, and 5' and 3' untranslated region mutations. We engineered two CBE variants bearing mutations in rat APOBEC1 that substantially decreased the number of RNA edits (by more than 390-fold and more than 3,800-fold) in human cells. These variants also showed more precise on-target DNA editing than the wild-type CBE and, for most guide RNAs tested, no substantial reduction in editing efficiency. Finally, we show that an adenine base editor7 can also induce transcriptome-wide RNA edits. These results have implications for the use of base editors in both research and clinical settings, illustrate the feasibility of engineering improved variants with reduced RNA editing activities, and suggest the need to more fully define and characterize the RNA off-target effects of deaminase enzymes in base editor platforms.


Conflict of interest statement

Competing Interests Statement: J.K.J. has financial interests in Beam Therapeutics, Editas Medicine, Endcadia, Pairwise Plants, Poseida Therapeutics, and Transposagen Biopharmaceuticals. J.K.J.’s interests were reviewed and are managed by Massachusetts General Hospital and Partners HealthCare in accordance with their conflict of interest policies. J.K.J. is a member of the Board of Directors of the American Society of Gene and Cell Therapy. J.G., R.Z., and J.K.J. are co-inventors on patent applications that have been filed by Partners Healthcare/Massachusetts General Hospital on engineered base editor architectures that reduce RNA editing activities.

Figures

Extended Data Figure 1.
Extended Data Figure 1.. Additional data and analysis for transcriptome-wide off-target C-to-U RNA editing induced by BE3 in human HepG2 cells.
(a) Dot plot of RNF2 on-target DNA editing data shown in Fig. 1b, depicting editing frequencies for all cytosines across the spacer sequence. (b) Heat maps showing RNA and DNA editing efficiencies of BE3 and Control on cytosines in human APOB. Numbering indicates nucleotide positions in the APOB transcript with asterisks by those previously shown to be modified by APOBEC1. (c) Histograms showing numbers of RNA edited cytosines (y-axis) with RNA C-to-U editing frequencies (x-axis) for the four replicates shown in Fig. 1c. Dashed red line shows the median, solid red line represents the mean. (d) Manhattan plots of data for replicates 2, 3, and 4 from Fig. 1c showing the distribution of modified cytosines across the transcriptome. n = total number of modified cytosines observed. (e) Percentages of different predicted effects and locations of edited cytosines in each RNA-seq replicate. (f) Jitter plots of cytosines modified by BE3 expression with the RNF2 gRNA categorized by their presence in 4, 3, 2 or 1 of the replicate RNA-seq experiments performed in HepG2 cells (n=4 biologically independent samples, same as in Fig. 1c). The box spans the interquartile range (first to third quartiles), with the band inside the box depicting the median (second quartile). The whiskers extend to the ±1.5 * interquartile range. n = total number of modified cytosines present in each category. The percentage of all modified cytosines in each category is also shown. UTR = untranslated region.
Extended Data Figure 2.
Extended Data Figure 2.. BE3 expression with two different gRNAs induces transcriptome-wide off-target RNA editing in HEK293T cells.
(a) Heat maps of on-target DNA base editing efficiencies of BE3 and nCas9-UGI-NLS (Control) in HEK293T cells (all GFP sorting) determined in triplicate with the RNF2 or EMX1 gRNA. Bases shown are within the editing window of the on-target spacer sequence (numbering is at the bottom with 1 being the most PAM distal spacer position). (b) Dot plots of RNF2 and EMX1 on-target DNA editing data shown in (a), depicting editing frequencies for all cytosines across the spacer sequence. (c) Jitter plots derived from RNA-seq experiments showing RNA cytosines modified by BE3 expression with the RNF2 or EMX1 gRNA. Y-axis represents the efficiencies of C-to-U editing. n = total number of modified cytosines observed in each replicate. (d) Histograms showing numbers of RNA edited cytosines (y-axis) with RNA C-to-U editing frequencies (x-axis) for the experiments shown in (c). Dashed red line shows the median, solid red line represents the mean. (e) Manhattan plots of data shown in (c) depicting the distribution of modified cytosines across the transcriptome. n = total number of modified cytosines observed.
Extended Data Figure 3.
Extended Data Figure 3.. Additional analysis of data showing transcriptome-wide off-target RNA editing in HEK293T cells by BE3 with two different gRNAs.
(a) Percentages of different predicted effects and locations of edited cytosines in each RNA-seq replicate from Extended Data Fig. 2c. (b) Percentages (x-axis) and numbers (shown inside the bars) of expressed genes in each RNA-seq replicate from same dataset as described in (a) that show at least one edited cytosine. (c) Jitter plots of cytosines modified by BE3 expression with the RNF2 or the EMX1 gRNA categorized by their presence in 3, 2 or 1 of the replicate RNA-seq experiments performed in HEK293T cells (n=3 biologically independent samples, same as Extended Data Fig. 2c). Box, whiskers and n are as defined in Extended Data Fig. 1f. The percentage of all modified cytosines in each category is also shown. (d) Sequence logos derived from edited cytosines identified in each RNA-seq replicate. Analysis done using RNA-seq data generated from cDNA, thus every T depicted should be considered a U in actual RNA. (e) Venn diagram showing numbers of cytosines edited with the RNF2 and EMX1 gRNAs. For each gRNA, the number of cytosines represents the union of those identified in the three replicates.
Extended Data Figure 4.
Extended Data Figure 4.. Increased BE3 expression induces higher numbers and frequencies of transcriptome-wide RNA cytosine edits in HEK293T cells.
(a) Heat maps of on-target DNA base editing efficiencies of BE3 and nCas9-UGI-NLS (Control) in HEK293T cells (top 5% GFP sorting) determined in duplicate with the RNF2 or EMX1 gRNA. Bases shown are within the editing window of the on-target spacer sequence (numbering is at the bottom with 1 being the most PAM distal spacer position). (b) Dot plots of RNF2 and EMX1 on-target DNA editing data shown in (a), depicting editing frequencies for all cytosines across the spacer sequence. (c) Jitter plots derived from RNA-seq experiments showing RNA cytosines modified by BE3 expression with the RNF2, EMX1, or NT gRNA. Y-axis represents the efficiencies of C-to-U editing. n = total number of modified cytosines observed in each replicate. (d) Histograms showing numbers of RNA edited cytosines (y-axis) with RNA C-to-U editing frequencies (x-axis) for the experiments shown in (c). Dashed red line shows the median, solid red line represents the mean. (e) Manhattan plots of data for both replicates of the RNF2, EMX1, and NT gRNAs from (c) showing the distribution of modified cytosines across the transcriptome. n = total number of modified cytosines.
Extended Data Figure 5.
Extended Data Figure 5.. Additional data and analysis showing increased BE3 expression induces higher numbers and frequencies of transcriptome-wide RNA cytosine edits in HEK293T cells.
(a) Percentages of different predicted effects and locations of edited cytosines in each RNA-seq replicate from Extended Data Fig. 4c. (b) Percentages (x-axis) and numbers (shown inside the bars) of expressed genes in each RNA-seq replicate that have at least one edited cytosine. (c) Sequence logos derived from edited cytosines identified in each RNA-seq duplicate experiment from Extended Data Fig. 4c for the RNF2, EMX1, and NT gRNAs. Analysis done using RNA-seq data generated from cDNA, thus every T depicted should be considered a U in actual RNA. (d) Venn diagram showing numbers of cytosines edited with the RNF2, EMX1, and NT gRNAs. For each gRNA, the circle encompasses the union of cytosines identified in the two replicates. (e) Venn diagrams showing all possible pairwise comparisons of edited cytosines observed in duplicate experiments performed with the RNF2, EMX1, and NT gRNAs (data derived from the experiments of Extended Data Fig. 4c). (f) Scatter plot correlating RNA editing frequencies (x-axis) of 154,264 cytosines previously shown to be edited by RNA-seq with DNA editing frequencies (y-axis) determined by WES performed with DNA derived from the same experiments (n=3 biologically independent samples, pooled data). Superimposed histograms depict the percentages of cytosines that show various editing rates on RNA (upper x-axis) or DNA (right y-axis).
Extended Data Figure 6.
Extended Data Figure 6.. Additional data showing SECURE-BE3 variants induce substantially reduced numbers of RNA edits but possess comparable and more precise DNA editing activities in HEK293T.
(a) Initial screen of the transcriptome-wide RNA editing activities of six BE3 variants harboring various APOBEC1 mutations and expressed at high levels in HEK293T cells (sorting cells with top 5% of GFP signal). Jitter plots of single replicate RNA-seq experiments showing RNA cytosines modified by expression of wild-type (WT) BE3, BE3-E63Q (APOBEC1 catalytic site mutant), BE3-P29F, BE3-P29T, BE3-L182A, BE3-R33A, BE3-K34A, and BE3-R33A/K34A variants. Y-axis represents the efficiencies of C-to-U editing. n = total number of modified cytosines observed in each sample. (b) Heat map of on-target DNA base editing efficiencies of WT BE3, BE3-R33A, BE3-R33A/K34A, and nCas9-UGI-NLS (Control) in HEK293T cells with the RNF2 gRNA (cells from same experiment as presented in Fig. 2a). Bases within the editing window of the on-target spacer sequence are numbered as previously described. Note the inclusion of C12, which is inefficiently edited by WT BE3 in these samples but not edited by the SECURE-BE3 variants, even in the higher expression context. (c) Dot plot for HEK293T on-target data displayed in (b), expanded to include all cytosines across the spacer sequence.
Extended Data Figure 7.
Extended Data Figure 7.. Additional data and analysis of the on-target DNA and off-target RNA activities of BE3 and SECURE-BE3 variants.
(a) Dot plots illustrating on-target DNA editing efficiencies of nCas9-UGI-NLS (Control), WT BE3, BE3-R33A, and BE3-R33A/K34A in HEK293T cells on 12 genomic sites. These are the same datasets shown in Fig. 2c, with an expanded depiction that includes all cytosines across the spacer sequence. (b) Jitter plots from RNA-seq experiments in HepG2 cells showing RNA cytosines modified by WT BE3, BE3-R33A and BE3-R33A/K34A. Y-axis represents the efficiencies of C-to-U RNA editing. WT BE3 data are from the same experiments presented in Fig. 1c (Reps. 2–4). n = total number of modified cytosines observed. (c) Manhattan plots of data showing the distribution of modified cytosines induced by BE3-R33A and BE3-R33A/K34A for replicate 3 from (b) overlaid on modified cytosines induced by WT BE3 (note that the WT BE3 data is the same in the top and bottom plots). n = total number of modified cytosines. (d) Heat map of on-target DNA base editing efficiencies of WT BE3, BE3-R33A, BE3-R33A/K34A, and nCas9-UGI-NLS (Control) in HepG2 cells with the RNF2 gRNA (cells from same experiment as presented in Extended Data Fig. 7b). Note that replicates 1, 2, and 3 for WT BE3 and nCas9-UGI-NLS in this panel show the same data presented as replicates 2, 3, and 4 for WT BE3 and nCas9-UGI-NLS in Fig. 1b. Bases within the editing window of the on-target spacer sequence are numbered as previously described. Note again the inclusion of position C12. (e) Dot plot for HepG2 on-target data displayed in (d), expanded to include all cytosines across the spacer sequence. (f) Schematic representation of the editing windows (colored boxes) for WT BE3, BE3-R33A, and BE3-R33A/K34A based on experimental data from Fig. 2c and Extended Data Fig. 7a. Darker colored and more translucent boxes indicate positions generally showing higher and lower C-to-T editing efficiencies, respectively. Increased stringency for a 5’T with BE3-R33A/K34A is also indicated. PAM (NGG) and the nicking site in the DNA backbone are highlighted. Drawings are adapted from Table 1 of ref. 1.
Extended Data Figure 8.
Extended Data Figure 8.. Additional data and analysis for transcriptome-wide off-target A-to-I RNA editing induced by ABEmax expression in HEK293T cells.
(a) Dot plot of HEK site 2 on-target DNA editing data shown in Fig. 3a, depicting editing frequencies for all adenines across the spacer sequence. (b) Histograms showing numbers of RNA-edited adenines (y-axis) with RNA A-to-I editing frequencies (x-axis) for three replicates shown in Fig. 3b. Dashed red line shows the median, solid red line represents the mean. (c) Manhattan plots of data for replicates 1 and 2 from Fig. 3b showing the distribution of modified adenines across the transcriptome. (d) Percentages of different predicted effects and locations of edited adenines in each RNA-seq replicate shown in Fig. 3b. (e) Percentages (x-axis) and numbers (inside the bars) of expressed genes in each RNA-seq replicate that show at least one edited adenine. (f) Jitter plots of adenines modified by ABEmax expression with the HEK site 2 gRNA categorized by their presence in 3, 2 or 1 of the replicate RNA-seq experiments shown in Fig. 3b (n=3 biologically independent samples). Box and whiskers are as defined in Extended Data Fig. 1f. n = total number of modified adenines present in each category. The percentage of all modified adenines found in each category is also shown. (g) Scatterplot correlating RNA editing frequencies (x-axis) of 52,462 adenines previously shown to be RNA edited with DNA editing frequencies (y-axis) determined by WES (n=3 biologically independent samples, pooled data). Superimposed histograms depict the percentages of edited adenines on RNA (upper x-axis) or DNA (right y-axis).
Extended Data Figure 9.
Extended Data Figure 9.. Impacts of BE3 and SECURE-BE3 variants on cell viability, structural model of rAPOBEC1, and extended sequence logos of off-target RNA edited sites.
(a) Cell viability assay comparing HEK293T cells transfected with plasmid expressing nCas9-UGI-NLS, wild-type (WT) BE3, BE3-R33A, BE3-R33A/K34A, or BE3-E63Q (n=3 biologically independent samples/condition). Each dot represents one biological replicate (and is the mean of three technical replicates). All data points were normalized to the mean luminescence of a nCas9-UGI-NLS control (set to 100%, grey dotted line) that was performed for each biological replicate experiment. The assay was performed on days 1, 2, 3, and 4 post-plating. Mean (longer horizontal line) and standard errors of the mean (shorter horizontal lines) are shown for each set of biological replicates. RLU = relative light unit; n.s.= not significantly decreased compared to matched nCas9 control; * and *** = p < 0.05 and p<0.001 values, respectively, for a significant decrease compared to matched nCas9-UGI control. Statistical significance was determined as described in Supplementary Methods. (b) rAPOBEC1 structural model with locations of catalytic residues and the R33 and K34 positions altered in SECURE variants. A predicted rAPOBEC1 structure is shown that was generated with Protein Homology/analogY Recognition Engine v 2.0 (Phyre2) and visualized in PyMOL (v 1.8.2.1). The R33 and K34 residues mutated in the SECURE variants are highlighted in orange and blue respectively. Catalytic site residues (H61, E63, C93 and C96) have been previously described and are highlighted in green. (c-f) Extended sequence logos for BE3- and ABEmax-induced RNA editing sites. Sequence logos derived with the nucleotides 100 bp upstream and downstream of the motifs edited in RNA by BE3 (ACW) or ABEmax (UA) are shown. Logos were derived from data for (c) BE3 expression in HepG2 cells (Fig. 1c), (d) BE3 expression in HEK293T cells (all GFP-sorted cells; Extended Data Fig. 2c), (e) higher BE3 expression in HEK293T cells (top 5% GFP-sorted cells; Extended Data Fig. 4c), and (f) ABEmax expression in HEK293T experiments (top 5% GFP-sorted cells; Fig. 3b). Analysis was done using RNA-seq data generated from cDNA, thus every T depicted should be considered a U in actual RNA.
Figure 1.
Figure 1.. Transcriptome-wide off-target C-to-U RNA editing induced by BE3 in human liver-derived HepG2 cells.
(a) Schematic of known rat APOBEC1 (rAPOBEC1) enzymatic activities (left panel) and known and unknown activities of a CBE harboring rAPOBEC1 (right panel). rAPOBEC1 = orange shape, nCas9 = blue shape, gRNA = violet line, UGI = green circle. Yellow halos depict cytosine deamination. (b) Heat map showing on-target efficiencies of BE3 and nickase Cas9(nCas9)-UGI-NLS (Control) within the editing window of RNF2 site 1 (bases numbered with 1 as the most PAM distal). In this (and all main figures), C12 in the spacer is not shown because of its relatively low editing efficiency but comprehensive quantitation of edit efficiencies of all spacer cytosines are in Extended Data Fig. 1a. (c) Jitter plots showing efficiencies of C-to-U editing (y-axis) from RNA-seq experiments with BE3 expression or a GFP negative control (Methods). n = total number of modified cytosines. See Methods for details about which edited cytosines are depicted in these plots. (d) Manhattan plot of modified cytosines across the transcriptome for replicate 1 from (c). n = total number of modified cytosines. (e) Percentages of expressed genes in each RNA-seq replicate with at least one edited cytosine. Numbers of expressed genes are shown. (f) Sequence logos from edited cytosines identified in each RNA-seq replicate. Generated RNA-seq data using cDNA, thus every T should be considered a U in RNA. (g) Scatterplot correlating RNA editing rates (%, x-axis) of 54,818 cytosines edited by BE3 with DNA editing rates (%, y-axis) as determined by WES (n=3 biologically independent samples, pooled data). Histograms depict fractions of edited cytosines on RNA (upper x-axis) or DNA (right y-axis). Rep. = Replicate; ss = single-stranded; ds = double-stranded.
Figure 2.
Figure 2.. SECURE-BE3 variants exhibit substantially reduced RNA editing with comparable but more precise DNA editing activities in HEK293T cells.
(a) Jitter plots from RNA-seq experiments in HEK293T cells showing RNA cytosines modified by expression of wild-type (WT) BE3, BE3-R33A, BE3-R33A/K34A, or BE3-E63Q. Y-axis represents the efficiencies of C-to-U RNA editing. n = total number of modified cytosines observed. (b) Manhattan plots showing the distribution of modified cytosines induced by BE3-R33A and BE3-R33A/K34A from replicate 2 in (a) overlaid on modified cytosines induced by WT BE3 (note that the WT BE3 data is the same in the top and bottom plots). (c) Heat maps of on-target DNA base editing efficiencies of WT BE3, BE3-R33A, BE3-R33A/K34A, and nCas9-UGI-NLS (Control) in HEK293T cells with 12 different gRNAs (cells transfected and harvested without sorting). Bases shown are within the editing window of the on-target site (numbered with 1 as the most PAM distal position).
Figure 3.
Figure 3.. Adenine base editor ABEmax induces transcriptome-wide off-target A-to-I RNA editing in HEK293T cells.
(a) Heat map of on-target DNA base editing efficiencies of ABEmax and NLS-nCas9-NLS (Control) in HEK293T cells with the HEK site 2 gRNA. Bases shown are within the editing window of the on-target site (numbered with 1 as the most PAM distal position). (b) Jitter plots derived from RNA-seq experiments showing RNA adenines modified by ABEmax expression with the HEK site 2 gRNA or a GFP control (Methods). Y-axis represents the efficiencies of A-to-I RNA editing. n = total number of modified adenines observed. (c) Manhattan plot showing the distribution of modified adenines across the transcriptome for replicate 3 from (b). n = total number of modified adenines observed. (d) Sequence logos derived from edited adenines in each RNA-seq replicate. Analysis done using RNA-seq data generated from cDNA, thus every T depicted should be considered a U in RNA.

Comment in

  • Towards precise, safe genome editing.
    Memczak S, Shao Y, Izpisua Belmonte JC. Memczak S, et al. Cell Res. 2019 Sep;29(9):687-689. doi: 10.1038/s41422-019-0188-x. Cell Res. 2019. PMID: 31201381 Free PMC article. No abstract available.

References

    1. Rees HA & Liu DR Base editing: precision chemistry on the genome and transcriptome of living cells. Nat Rev Genet 19, 770–788, doi:10.1038/s41576-018-0059-1 (2018). - DOI - PMC - PubMed
    1. Seo H & Kim JS Towards therapeutic base editing. Nat Med 24, 1493–1495, doi:10.1038/s41591-018-0215-3 (2018). - DOI - PubMed
    1. Komor AC, Kim YB, Packer MS, Zuris JA & Liu DR Programmable editing of a target base in genomic DNA without double-stranded DNA cleavage. Nature 533, 420–424, doi:10.1038/nature17946 (2016). - DOI - PMC - PubMed
    1. Komor AC et al. Improved base excision repair inhibition and bacteriophage Mu Gam protein yields C:G-to-T:A base editors with higher efficiency and product purity. Sci Adv 3, eaao4774, doi:10.1126/sciadv.aao4774 (2017). - DOI - PMC - PubMed
    1. Kim D et al. Genome-wide target specificities of CRISPR RNA-guided programmable deaminases. Nat Biotechnol 35, 475–480, doi:10.1038/nbt.3852 (2017). - DOI - PubMed

Publication types