Review
. 2019 Apr 16;10(4):251.
doi: 10.3390/mi10040251.

Sensors that Learn: The Evolution from Taste Fingerprints to Patterns of Early Disease Detection

Affiliations
Review

Sensors that Learn: The Evolution from Taste Fingerprints to Patterns of Early Disease Detection

Nicolaos Christodoulides et al. Micromachines (Basel). .

Abstract

The McDevitt group has sustained efforts to develop a programmable sensing platform that offers advanced, multiplexed/multiclass chem-/bio-detection capabilities. This scalable chip-based platform has been optimized to service real-world biological specimens and validated for analytical performance. Fashioned as a sensor that learns, the platform can host new content for the application at hand. Identification of biomarker-based fingerprints from complex mixtures has a direct linkage to e-nose and e-tongue research. Recently, we have moved to the point of big data acquisition alongside the linkage to machine learning and artificial intelligence. Here, exciting opportunities are afforded by multiparameter sensing that mimics the sense of taste, overcoming the limitations of salty, sweet, sour, bitter, and glutamate sensing and moving into fingerprints of health and wellness. This article summarizes developments related to the electronic taste chip system evolving into a platform that digitizes biology and affords clinical decision support tools. A dynamic body of literature and key review articles that have contributed to the shaping of these activities are also highlighted. This fully integrated sensor promises more rapid transition of biomarker panels into wide-spread clinical practice yielding valuable new insights into health diagnostics, benefiting early disease detection.

Keywords: biomarkers; biosensors; early disease detection; electronic taste chip; electronic tongue; point-of-care; programmable bio-nano-chip (p-BNC); saliva; serum.


Conflict of interest statement

Principal Investigator, John T. McDevitt, has an equity interest in SensoDx II, LLC. He also serves on the Scientific Advisory Board of SensoDx. Michael P. McRae has served as a consultant for SensoDx.

Figures

Figure 1
Figure 1
The illustration shows various elements that are related to the electronic taste chip. In panel (A), a diagram is provided displaying the pit region within the silicon chip where bead sensors are localized. In panel (B), a top perspective of a single well wherein a resin sensor bead is located centrally is shown. In panel (C), a schematic diagram depicting one of the flow cell interfaces developed by the McDevitt group is included. In panel (D), a schematic is shown of the bead confinement strategy, fluid direction (arrows), and optical access (light gray shaded area) within the flow cell. Adapted from [66] with permission.
Figure 2
Figure 2
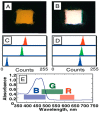
Optical intensity information from the video chip recorded simultaneously at different bead sites were acquired by the electronic taste chip platform. The bead derivatized with fluorescein appears yellow (A), while the reference/blank microsphere shows white (B). The effective color attenuation is shown for (C) fluorescein derivatized microsphere and (D) the blank microsphere. This data is used to quantitated RGB color histograms observed in each of these spectral regions. The bottom segment (E) provides the approximate RGB spectral features and the absorbance characteristics of fluorescein. Adapted with permission from [66].
Figure 3
Figure 3
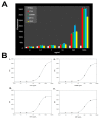
This illustration provides a summary of data for the applications of the electronic taste chip. (A) For sour detection, a series of optical responses for a total of 6 separate pH indicator dye-coated microspheres. (B) For the electrolyte-salt group, green, blue, and red responses for a series of complexometric dyes, as observed for 4 different solutions: (i) pH 9.8 inorganic buffer; (ii) pH 9.8 buffer with 10 mM MgCl2; (iii) pH 9.8 with 10 mM Ca(NO3)2; (iv) pH 9.8 containing 10 mM BaCl2. Insets show optical micrographs of the beads. Adapted from [66] with permission.
Figure 4
Figure 4
A broad range of applications have been demonstrated for the p-BNC sensor approach. The various test sectors are summarized in this illustration.
Figure 5
Figure 5
This illustration shows dose response curves for cardiac assays as developed on a partially integrated p-BNC sensing platform. These data were acquired with syringe pump fluid control using a laminate labcard. The measurements of the four shown cardiac biomarkers are completed within a single multiplexed assay. The sample matrix used here is serum.
Figure 6
Figure 6
Precision data acquired for the cardiac biomarker myoglobin on a partially integrated p-BNC platform (see Figure 5 for more details).
Figure 7
Figure 7
Calibration curves are shown for the following cases: (A) CA125, (B) HE4, (C) MMP-7, and (D) CA72-4. The data was obtained for both singleplex (black circles) and multiplex (white circles) formats. The insert table at the bottom lists the assay characteristics of the multiplexed test, such as limits of detection (LOD) and intra- and inter-assay precision values for same analytes. Adapted from [73] with permission.
Figure 8
Figure 8
This illustration provides three-dimensional computational modeling for fluid delivery within agarose bead ensembles. Show here are the following cases: (A) Schematic showing fluid delivered via an inlet channel to a porous bead array; (B) A high magnification perspective of a single bead revealing that signal develops at the exterior of the bead. (C) Pressure is found to influence the flow rates at the bead well interface. Adapted from [74] with permission.
Figure 9
Figure 9
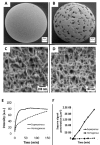
The illustration shows the influence of weight fraction of agarose content controls range of pore size of the beads. Here, electron microscopy images of interior of beads of varying agarose concentrations are provided as follows: (A) 0.5% (wt/wt%); (B) 2% (wt/wt%); (C) 4% (wt/wt%); and (D) 8% (wt/wt%). The various cases reveal that decrease in pore size as the amount of agarose increases. Panel (E) shows inverse relationship for pore size and agarose percentage, as extracted by microscopy techniques. Adapted from [75] with permission.
Figure 10
Figure 10
The illustration shows the comparison between homogeneous and superporous beads for the following cases as obtained by SEM for panels A to D. (A) Images reveals surface morphology of homogenous 4% agarose beads; (B) 4% superporous beads with ~30 µm microcavities; (C) higher magnification of homogeneous case; (D) superporous bead also at detailed view. The bottom two panels show: (E) Comparison of CRP capture by homogeneous and superporous agarose spheres; (F) the CRP diffusion is 50x higher in superporous beads. Adapted with permission from [75].
Figure 11
Figure 11
The illustration shows the elucidation of the spatial distribution of fluorescently labeled BSA via finite element analysis as a function of time and microbead receptor concentration. Adapted from [75] with permission.
Figure 12
Figure 12
Summary of the bead analysis algorithm shown for one bead in the array. The first-order difference of the raw image is calculated to elucidate the edge of the bead. A series of Gabor annulus filters are then convolved over the first difference image. The 2-D convolution response is then used to approximate the center of the bead. The bead’s outer edge is identified by the maximum gradient in pixel intensity. Since the bead signal develops nonuniformly, an annulus region of interest is mapped in which the region of highest intensity along the outer diameter is extracted and averaged. Adapted from [88] with permission.
Figure 13
Figure 13
The evolution of the instrumentation is shown. (a) First, a typical MACRO-lab-based- configuration used in the early stages. This structure has a microchip element that is supported by external pumps, valves, and waste chambers. (b) Second, a typical MICRO non-form factor prototype configuration that serves as an intermediate step with partial integration is shown. This structure has a labcard for fluid routing and supports a microchip sensor where biomarker capture occurs. (c) The final MICRO-form factor prototype configuration serves as key step towards full integration both in terms of the instrument and the injection molded plastic cartridge. The universal cartridge comes in both bead and membrane configurations that are serviced by image-based instrumentation.
Figure 14
Figure 14
Bead- and membrane-based assay platforms of the MICRO-form factor cartridges dedicated to soluble chemistries and cellular assays, respectively.
Figure 15
Figure 15
Intended cycle of use of the MICRO-form factor instrument and cartridge. Adapted from [110] with permission.
Figure 16
Figure 16
The MICRO-form factor’s system components. (A) Features of the sensor technology at multiple length scales: (a) MICRO-form factor cartridge; (b) matrix with (bottom) and without (top) bead sensors; (c) an agarose bead (bottom) and microcontainer (top); (d) SEM image showing porous agarose bead structure; and (e), illustration of an agarose bead fiber functionalized with immunoreagents. (B) Illustration of cartridge features. (C) Summary of MICRO-form factor instrumentation: (a) illustration of the prototype analyzer; (b) fluid delivery system with images of an actuator compressing a blister (top) and flow rate verification results (bottom) for five runs at low, medium, and high target flow rates. Adapted from [110] with permission.
Figure 17
Figure 17
Demonstration of bead-based cartridge for multiplexed panels for prostate (A) and ovarian (B) cancers and AMI (C) using consumable cartridges (i). Bead sensor images for non-case/control (ii) and case (iii). The prostate cancer panel includes total and free prostate-specific antigen (a). The ovarian cancer panel includes CA125 and HE4 (b). The AMI diagnostic panel includes cTnI, CK-MB, myoglobin and NT-proBNP (c). Average fluorescence intensity measurements are shown for each biomarker (iv). Reprinted with permission from [110].
Figure 18
Figure 18
(A) Allergy testing on bead-based assay platform showing total human IgE assay immunoschematic; (B) Images obtained using MACRO non form factor instrumentation of bead array exposed to increasing concentration of human IgE. The platform has also been used to identify allergen-specific IgE as well (data not shown).
Figure 19
Figure 19
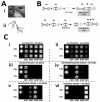
Saliva-based tests for drugs of abuse on the bead-based sensor suite. (A) Oral fluid sample collection by a swab (A-i) and extraction (A-ii). (B) Immuno-components of this competitive assay approach. (C) Series of experimental runs demonstrating the specificity of this assay system. Adapted from [94] with permission.
Figure 20
Figure 20
The CVD pathophysiology and Pearson correlation coefficient matrix-based grouping of cardiac biomarkers. The illustration on the left outlines atherosclerotic plaque stages and associated biomarkers. On the right is shown the Pearson correlation coefficient matrix calculated from serum biomarker concentrations of 579 patients in the study. Adapted from [108] with permission.
Figure 21
Figure 21
Receiver Operating Characteristic curves show improved discrimination performance for the cardiac wellness ScoreCard model over Framingham Risk Score and a biomarkers-only model. Adapted from [108] with permission.
Figure 22
Figure 22
Cytology-on-a-chip. Panel (I) the “cytology-on-chip” approach vs histopathology. Histopathological (H&E staining) images (A,B) and immunofluorescence cytology images (C,D) for four different patients. Panels A and C are derived from healthy controls and panels B and D from OSCC patients. Panel (II) “Cytology-on-chip” test in which a brush biopsy sample is obtained (A), loaded into the flow cell (B) which captures the cells on a porous membrane (C). Multispectral fluorescence images are captured (D), automated image analyses identify individual cells (E), and important intensity and morphology measurements are extracted to be used in the machine learning algorithms (F). Reprinted from [115] with permission.
Figure 23
Figure 23
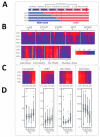
Summary of results from Random Forest model development. (A) The OSCC diagnostic spectrum and four binary splits used to dichotomize outcomes into ‘‘Case” or ‘‘Non-case”. (B) Normalized Gini value heat maps from Random Forest models demonstrating variable importance of select predictors across four diagnostic splits (y axis). (C) A subset of predictors from (B) showing summary percentile measurements (10, 25, 75, 90 percentiles). (D) Box plots displaying the median value distributions for circularity, Ki67, NC ratio, and cell area. Adapted from [115] with permission.
Figure 24
Figure 24
Cell phenotypes classified by morphometry. Panel (I) scatterplot and histograms for maximum Feret diameter and mean fluorescence intensity for Phalloidin. Panel (II) cell counts for each phenotype shown in Panel (III) for 300 cells selected at random from subjects with lesion determinations of Normal, Benign, Dysplastic, and OSCC. Panel (III) representative images of cell phenotypes with unique morphological characteristics, including: (A) cells with high circularity, low NC ratio; (B) cells with high circularity, high NC ratio, and medium cytoplasm area; (C) cells with high circularity, high NC ratio, and small cytoplasm area; (D) large cells with enlarged nuclei; (E) binucleated cells; (F) polynucleated cells; (G) cells with micronuclei; and (H) normal squamous cells. Reprinted from [115] with permission.
Figure 25
Figure 25
(A) The two valleys of “death” that medical device manufactures face and (B) the E5D bridge that connects academic findings with their widespread usage at the clinical setting (to stage T4 and beyond).
Figure 26
Figure 26
Picture of the current SensoDx instrumentation. The instrument is fully integrated with cloud connected capabilities and able to complete complex tests using single push of button process.

References

    1. Vitzthum F., Behrens F., Anderson N.L., Shaw J.H. Proteomics: From basic research to diagnostic application. A review of requirements & needs. J. Prot. Res. 2005;4:1086–1097. - PubMed
    1. Becker H. One size fits all? LOC. 2010;10:1894–1897. doi: 10.1039/c005380p. - DOI - PubMed
    1. Whitesides G.M. The origins and the future of microfluidics. Nature. 2006;442:368–373. doi: 10.1038/nature05058. - DOI - PubMed
    1. Yager P., Edwards T., Fu E., Helton K., Nelson K., Tam M.R., Weigl B.H. Microfluidic diagnostic technologies for global public health. Nature. 2006;442:412–418. doi: 10.1038/nature05064. - DOI - PubMed
    1. Chin C., Chin S., Laksanasopin T., Sia S. Low-cost microdevices for point-of-care testing. In: Issadore D., Westervelt R.M., editors. Point-of-Care Diagnostics on a Chip. Springer; Berlin/Heidelberg, Germany: 2013. pp. 3–21.

LinkOut - more resources