. 2019 Apr 16;20(8):1880.
doi: 10.3390/ijms20081880.

Calcium Activity Dynamics Correlate with Neuronal Phenotype at a Single Cell Level and in a Threshold-Dependent Manner

Affiliations

Calcium Activity Dynamics Correlate with Neuronal Phenotype at a Single Cell Level and in a Threshold-Dependent Manner

Sudip Paudel et al. Int J Mol Sci. .

Abstract

Calcium is a ubiquitous signaling molecule that plays a vital role in many physiological processes. Recent work has shown that calcium activity is especially critical in vertebrate neural development. Here, we investigated if calcium activity and neuronal phenotype are correlated only on a population level or on the level of single cells. Using Xenopus primary cell culture in which individual cells can be unambiguously identified and associated with a molecular phenotype, we correlated calcium activity with neuronal phenotype on the single-cell level. This analysis revealed that, at the neural plate stage, a high frequency of low-amplitude spiking activity correlates with an excitatory, glutamatergic phenotype, while high-amplitude spiking activity correlates with an inhibitory, GABAergic phenotype. Surprisingly, we also found that high-frequency, low-amplitude spiking activity correlates with neural progenitor cells and that differentiating cells exhibit higher spike amplitude. Additional methods of analysis suggested that differentiating marker tubb2b-expressing cells exhibit relatively persistent and predictable calcium activity compared to the irregular activity of neural progenitor cells. Our study highlights the value of using a range of thresholds for analyzing calcium activity data and underscores the importance of employing multiple methods to characterize the often irregular, complex patterns of calcium activity during early neural development.

Keywords: Ca2+; Xenopus; calcium; calcium activity; development; embryo; nervous system; neural development; sox2; tubb2b.


Conflict of interest statement

The authors declare no conflict of interest. The funders had no role in the design of the study; in the collection, analyses, or interpretation of data; in the writing of the manuscript, and in the decision to publish the results.

Figures

Figure 1
Figure 1
Overview schematic showing dissociation of neural tissue, calcium imaging and subsequent molecular phenotype identification of individual cells. (A) Dissection of embryonic neural tissue at neural plate (Stage 14), neural tube (Stage 18) and early tailbud stage (Stage 22). (B) Dissociation of explant in calcium and magnesium free solution followed by Fluo-4 AM treatment. (C) A representative fluorescence still image acquired using Nikon A1R Ti Laser Scanning Confocal Microscope. (D) Identification of molecular phenotype using fluorescence in situ hybridization assay. (E) Overlay of calcium activity images with gene expression.
Figure 2
Figure 2
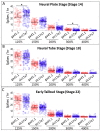
Presumptive glutamatergic cells dissected at neural plate stage of development show more low-level spiking activity, while presumptive GABAergic cells display higher-amplitude spiking. Comparison of spiking frequency counted using five different thresholds (125%, 150%, 200%, 300% and 400% of baseline), between inhibitory (gad1.1) and excitatory (slc17a7) neurons at: (A) neural plate stage (Stage 14); (B) neural tube stage (Stage 18); and (C) early tailbud stage (Stage 22). Stars represent statistically significant differences according to both Bonferroni-corrected two-sample Kolmogorov–Smirnov Test (p < 0.05) and Cohen’s d statistics for effect size (mean + SD; n = 5 cultures; * 0.2 ≤ |d| < 0.5).
Figure 3
Figure 3
Presumptive glutamatergic cells dissociated at neural plate stage show more chaotic activity, while presumptive GABAergic cells display more periodic calcium dynamics. Comparison of Markovian entropy, estimated Hurst exponent, and average power between inhibitory (gad1.1) versus excitatory (slc17a7) neurons at: (A) neural plate stage (Stage 14); (B) neural tube stage (Stage 18); and (C) early tailbud stage (Stage 22). Stars represent statistically significant differences according to both Bonferroni-corrected two-sample Kolmogorov–Smirnov Test (p < 0.05) and Cohen’s d statistics for effect size (mean + SD; n = 5 cultures; * 0.2 ≤ |d| < 0.5, ** 0.5 ≤ |d| < 0.8, *** |d| ≥ 0.8). Markovian entropy was calculated with n = 4 and k = 1.
Figure 4
Figure 4
Neural progenitor cells exhibit high numbers of small spikes and lower numbers of high-amplitude spikes, but differentiated neurons exhibit a lower number of small spikes and larger number of high-amplitude spikes. Comparison of spiking frequency counted using five different thresholds (125%, 150%, 200%, 300% and 400% of baseline), between neural progenitor cells (sox2) and differentiated neurons (tubb2b) at: (A) neural plate stage (Stage 14); (B) neural tube stage (Stage 18); and (C) early tailbud stage (Stage 22). Stars represent statistically significant differences according to both Bonferroni-corrected two-sample Kolmogorov–Smirnov Test (p < 0.05) and Cohen’s d statistics for effect size (mean + SD; n = 5 cultures; * 0.2 ≤ |d| < 0.5, ** 0.5 ≤ |d| < 0.8, *** |d| ≥ 0.8).
Figure 5
Figure 5
Neural progenitor cells exhibit comparatively noisy low-level calcium dynamics, while differentiated neurons exhibit relatively persistent and more predictable calcium dynamics. Comparison of Markovian entropy, estimated Hurst exponent, and average power between neural progenitor (sox2) versus differentiated neurons (tubb2b) at: (A) neural plate stage (Stage 14); (B) neural tube stage (Stage 18); and (C) early tailbud stage (Stage 22). Stars represent statistically significant differences according to both Bonferroni-corrected two-sample Kolmogorov–Smirnov Test (p < 0.05) and Cohen’s d statistics for effect size (mean + SD; n = 5 cultures; * 0.2 ≤ |d| < 0.5, ** 0.5 ≤ |d| < 0.8, *** |d| ≥ 0.8). Markovian entropy was calculated with n = 4 and k = 1.

References

    1. Markova O., Sénatore S., Chardès C., Lenne P.-F.F. Calcium Spikes in Epithelium: Study on Drosophila Early Embryos. Sci. Rep. 2015;5:11379. doi: 10.1038/srep11379. - DOI - PMC - PubMed
    1. Vidavsky N., Shpigel M., Addadi S., Schertel A., Ben-Ezra D., Addadi L., Weiner S. Calcium Transport into the Cells of the Sea Urchin Larva in Relation to Spicule Formation. Proc. Natl. Acad. Sci. USA. 2016;113:12637–12642. doi: 10.1073/pnas.1612017113. - DOI - PMC - PubMed
    1. Chen J., Xia L., Bruchas M.R., Solnica-Krezel L. Imaging Early Embryonic Calcium Activity with GCaMP6s Transgenic Zebrafish. Dev. Biol. 2017;430:385–396. doi: 10.1016/j.ydbio.2017.03.010. - DOI - PMC - PubMed
    1. Berridge M.J., Lipp P., Bootman M.D. The Versatility and Universality of Calcium Signalling. Nat. Rev. Mol. Cell Biol. 2000;1:11–21. doi: 10.1038/35036035. - DOI - PubMed
    1. Clapham D.E. Calcium Signaling. Cell. 2007;131:1047–1058. doi: 10.1016/j.cell.2007.11.028. - DOI - PubMed

LinkOut - more resources