

Sedation practices and clinical outcomes in mechanically ventilated patients in a prospective multicenter cohort
- PMID: 30995940
- PMCID: PMC6472077
- DOI: 10.1186/s13054-019-2394-9
Sedation practices and clinical outcomes in mechanically ventilated patients in a prospective multicenter cohort
Abstract
Objectives: We sought to study the association between sedation status, medications (benzodiazepines, opioids, and antipsychotics), and clinical outcomes in a resource-limited setting.
Design: A longitudinal study of critically ill participants on mechanical ventilation.
Setting: Five intensive care units (ICUs) in four public hospitals in Lima, Peru.
Patients: One thousand six hundred fifty-seven critically ill participants were assessed daily for sedation status during 28 days and vital status by day 90.
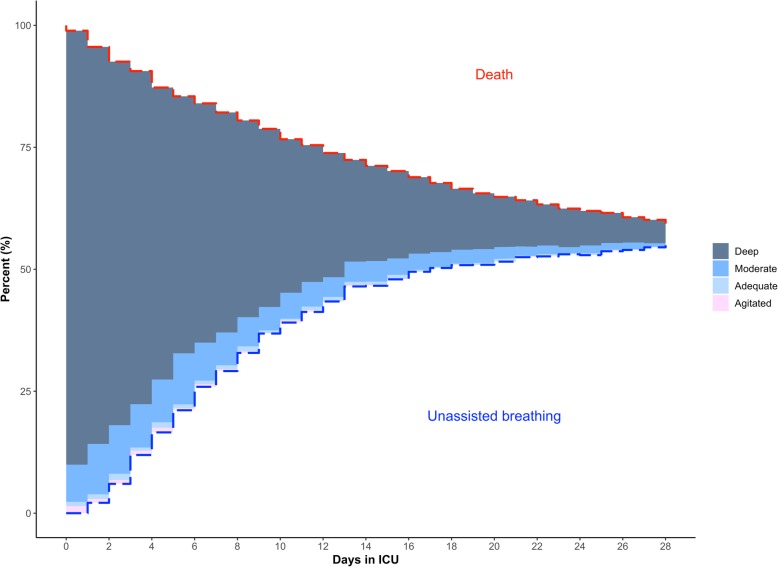
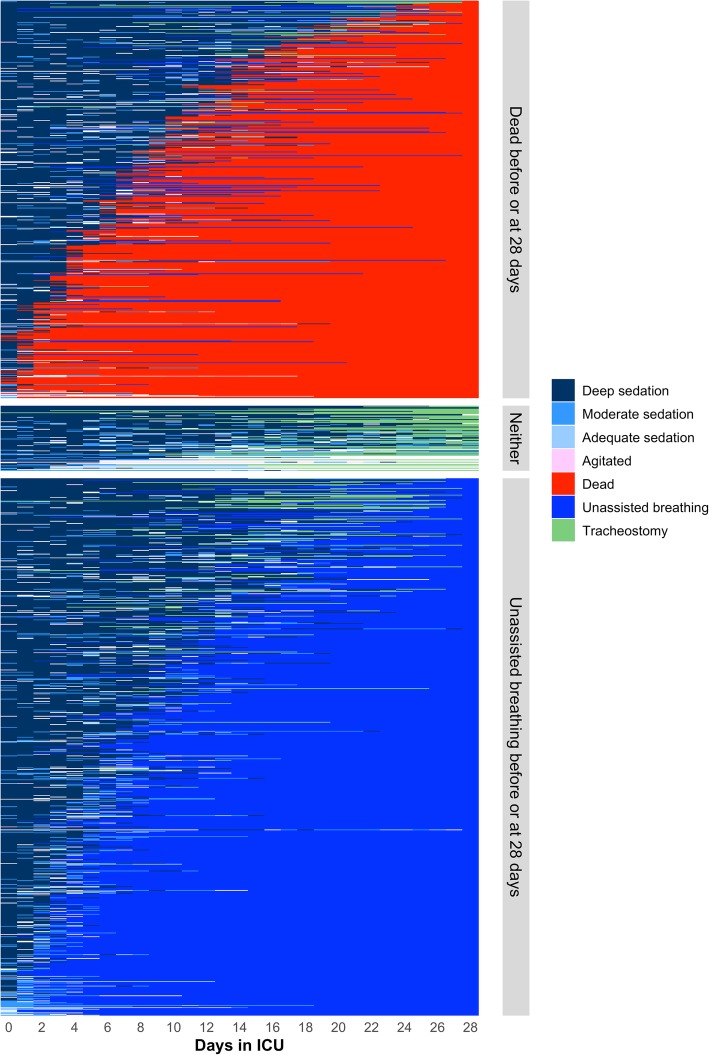
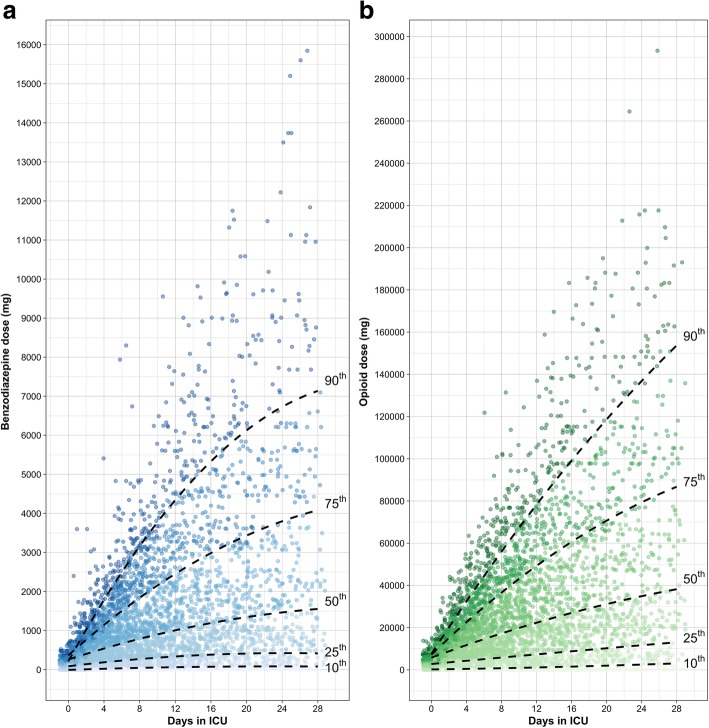
Results: After excluding data of participants without a Richmond Agitation Sedation Scale score and without sedation, we followed 1338 (81%) participants longitudinally for 18,645 ICU days. Deep sedation was present in 98% of participants at some point of the study and in 12,942 ICU days. Deep sedation was associated with higher mortality (interquartile odds ratio (OR) = 5.42, 4.23-6.95; p < 0.001) and a significant decrease in ventilator (- 7.27; p < 0.001), ICU (- 4.38; p < 0.001), and hospital (- 7.00; p < 0.001) free days. Agitation was also associated with higher mortality (OR = 39.9, 6.53-243, p < 0.001). The most commonly used sedatives were opioids and benzodiazepines (9259 and 8453 patient days respectively), and the latter were associated with a 41% higher mortality in participants with a higher cumulative dose (75th vs 25th percentile, interquartile OR = 1.41, 1.12-1.77; p < 0.01). The overall cumulative dose of benzodiazepines and opioids was high, 774.5 mg and 16.8 g, respectively, by day 7 and by day 28; these doses approximately doubled. Haloperidol was only used in 3% of ICU days; however, the use of it was associated with a 70% lower mortality (interquartile OR = 0.3, 0.22-0.44, p < 0.001).
Conclusions: Deep sedation, agitation, and cumulative dose of benzodiazepines were all independently associated with higher 90-day mortality. Additionally, deep sedation was associated with less ventilator-, ICU-, and hospital-free days. In contrast, haloperidol was associated with lower mortality in our study.
Keywords: Clinical outcomes; Critical illness; Sedation.
Conflict of interest statement
Ethics approval and consent to participate
We received ethics approval from the Institutional Review Boards at Hospital Nacional Edgardo Rebagliati Martins, Hospital Nacional Guillermo Almenara Irigoyen, Hospital Nacional Arzobispo Loayza and Hospital de Emergencias Casimiro Ulloa in Lima, Peru; and at the Johns Hopkins School of Medicine, Baltimore, USA. All internal review boards provided a waiver of consent for this study.
Consent for publication
Specific permission to use anonymized data for scientific purposes was obtained from all internal review boards.
Competing interests
The authors declare that they have no competing interests.
Publisher’s Note
Springer Nature remains neutral with regard to jurisdictional claims in published maps and institutional affiliations.
Figures
References
-
- Hager DN, Dinglas VD, Subhas S, Rowden AM, Neufeld KJ, Bienvenu OJ, Touradji P, Colantuoni E, Reddy DR, Brower RG, et al. Reducing deep sedation and delirium in acute lung injury patients: a quality improvement project. Crit Care Med. 2013;41(6):1435–1442. doi: 10.1097/CCM.0b013e31827ca949. - DOI - PubMed
Publication types
MeSH terms
Substances
Grants and funding
LinkOut - more resources
Full Text Sources
