. 2019 Jun 15;79(12):3034-3049.
doi: 10.1158/0008-5472.CAN-19-0789. Epub 2019 Apr 17.

tRNA Fragments Show Intertwining with mRNAs of Specific Repeat Content and Have Links to Disparities

Affiliations

tRNA Fragments Show Intertwining with mRNAs of Specific Repeat Content and Have Links to Disparities

Aristeidis G Telonis et al. Cancer Res. .

Abstract

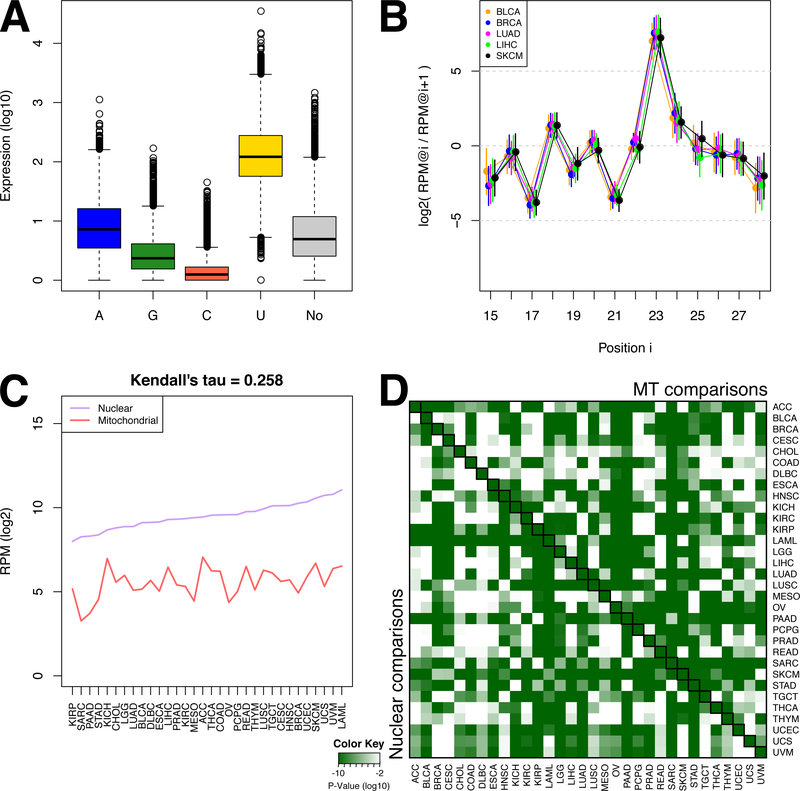
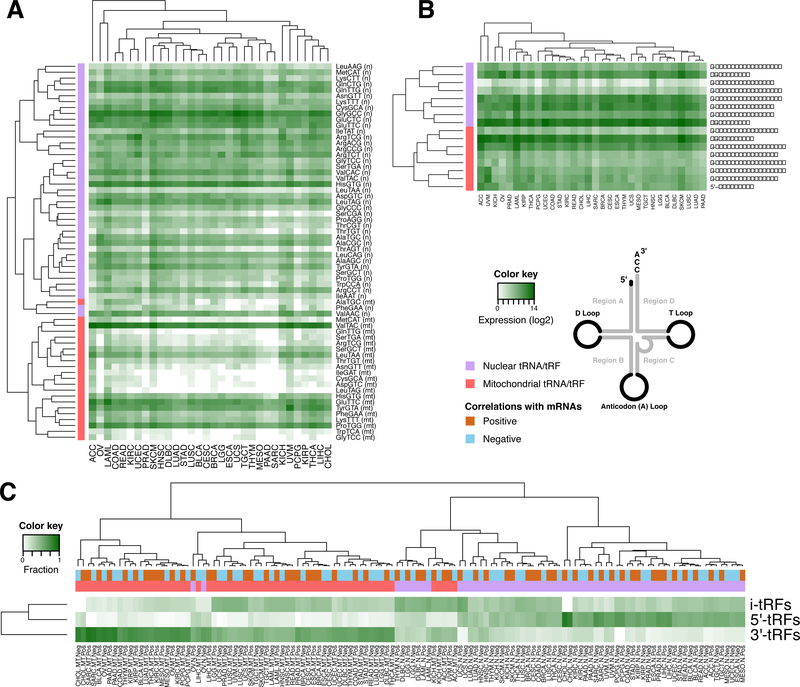
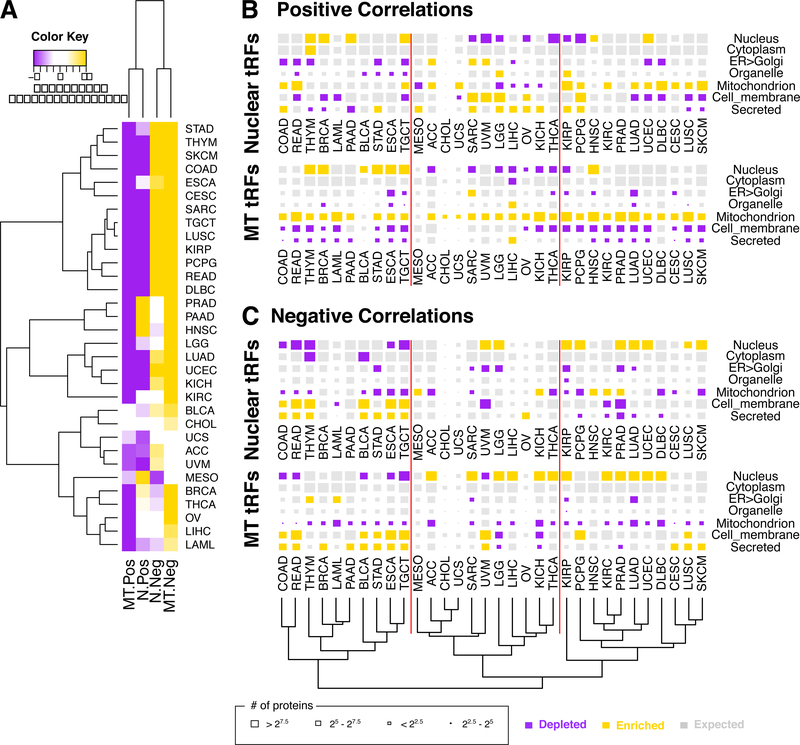
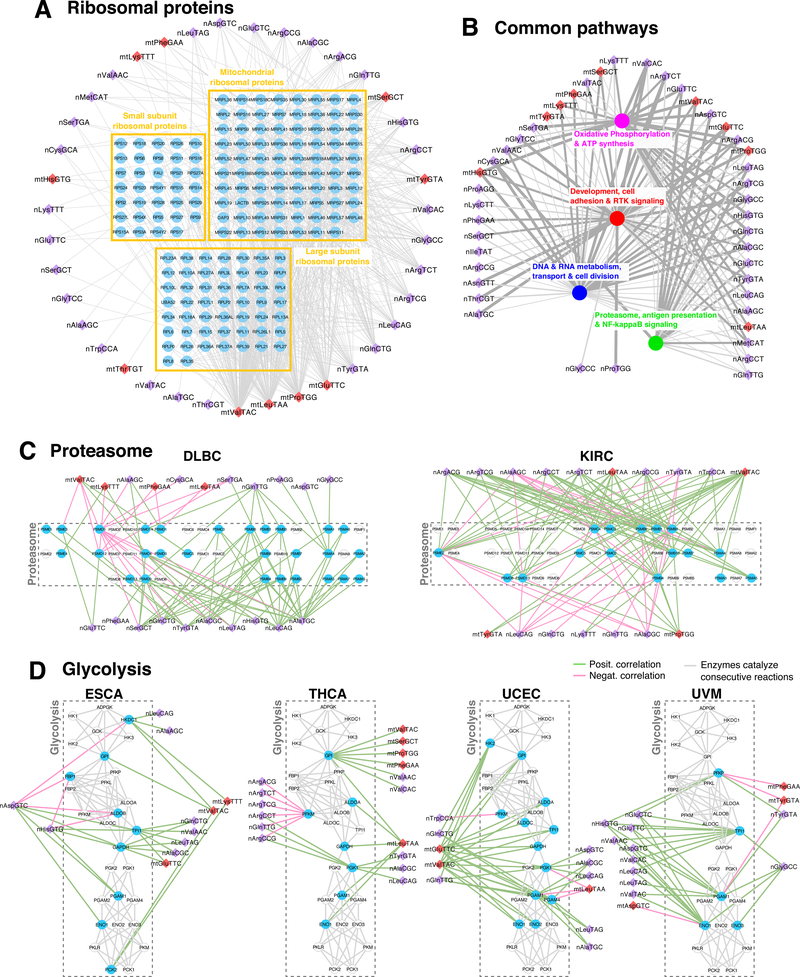
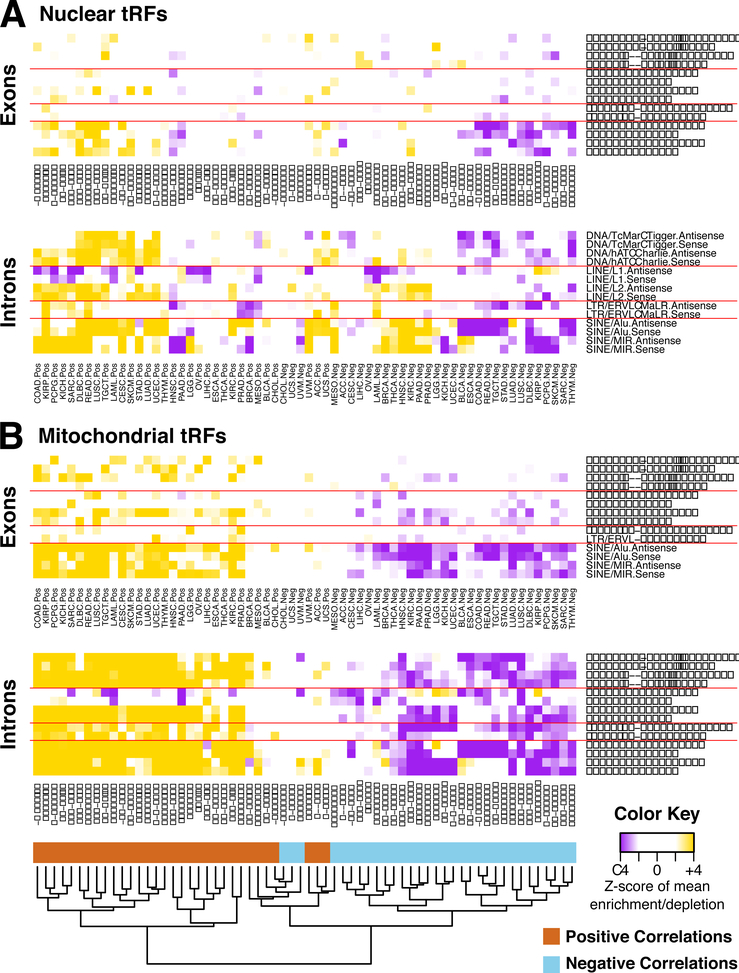
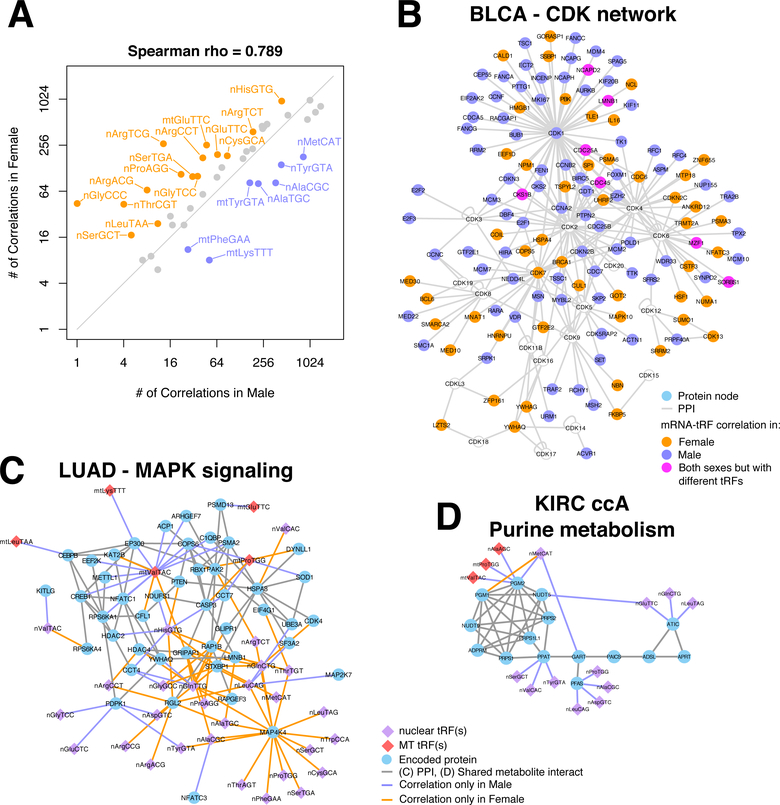
tRNA-derived fragments (tRF) are a class of potent regulatory RNAs. We mined the datasets from The Cancer Genome Atlas (TCGA) representing 32 cancer types with a deterministic and exhaustive pipeline for tRNA fragments. We found that mitochondrial tRNAs contribute disproportionally more tRFs than nuclear tRNAs. Through integrative analyses, we uncovered a multitude of statistically significant and context-dependent associations between the identified tRFs and mRNAs. In many of the 32 cancer types, these associations involve mRNAs from developmental processes, receptor tyrosine kinase signaling, the proteasome, and metabolic pathways that include glycolysis, oxidative phosphorylation, and ATP synthesis. Even though the pathways are common to multiple cancers, the association of specific mRNAs with tRFs depends on and differs from cancer to cancer. The associations between tRFs and mRNAs extend to genomic properties as well; specifically, tRFs are positively correlated with shorter genes that have a higher density in repeats, such as ALUs, MIRs, and ERVLs. Conversely, tRFs are negatively correlated with longer genes that have a lower repeat density, suggesting a possible dichotomy between cell proliferation and differentiation. Analyses of bladder, lung, and kidney cancer data indicate that the tRF-mRNA wiring can also depend on a patient's sex. Sex-dependent associations involve cyclin-dependent kinases in bladder cancer, the MAPK signaling pathway in lung cancer, and purine metabolism in kidney cancer. Taken together, these findings suggest diverse and wide-ranging roles for tRFs and highlight the extensive interconnections of tRFs with key cellular processes and human genomic architecture. SIGNIFICANCE: Across 32 TCGA cancer contexts, nuclear and mitochondrial tRNA fragments exhibit associations with mRNAs that belong to concrete pathways, encode proteins with particular destinations, have a biased repeat content, and are sex dependent.


Conflict of interest statement

Conflicts of interest: The authors declare no conflicts of interest.

Figures

Figure 1.
Figure 1.. The noteworthy case of tRNAHisGTG.
(A) Barplot showing the relative expression of the 5´-tRFs of tRNAHisGTG grouped based on their starting nucleotide at the −1 position (see text). “No” corresponds to 5´-tRFs that begin at position +1 and have no post-transcriptional additions. (B) Ratios of abundances between His(−1U) 5´-tRFs that end at positions i and i+1 respectively of tRNAHisGTG, for primary tumors from selected cancer types. The X axis represents ending positions i within the mature tRNAHisGTG. Vertical bars represent standard deviation. The ratios of abundances for all 32 cancer types as well as normal tissues are included in Supplemental Table S2 and Supplemental Fig. S2. (C) The median abundance of the nuclear and the MT tRNAHisGTG genes. The abundance is calculated as the sum of the abundances of the tRFs each tRNA produces. This is a simplified version of the bar-plots of Supplemental Fig. S1E-F. Cancer types are sorted based on the abundance of the nuclear tRNA. (D) Heatmap representing the P values (Mann-Whitney U-test) when comparing the abundances of the nuclear- and MT tRNAHisGTG-derived fragments within the same cancer type (the diagonal of the matrix), or when comparing the abundance of the MT (upper triangle) or the nuclear (bottom triangle) tRNAHisGTG among cancer types. P values are log10-scaled.
Figure 2.
Figure 2.. Distinct characteristics between nuclear and mitochondrial tRFs.
(A) Heatmap showing the mean isoacceptor abundance (see Methods). Hierarchical clustering (metric: Kendall’s tau distance) groups mitochondrial (MT) and nuclear (N) isoacceptors into separate clusters. (B) Heatmaps and hierarchical clustering (metric: Kendall’s tau distance) of the mean abundance of each structural category per genome (nuclear or MT). The i-tRFs are split into sub-categories based on their the location of the 5´ terminus. Note the separation of nuclear and MT tRFs. (C) Heatmap and hierarchical clustering (metric: Euclidean distance) of the distribution of tRFs participating in correlations with mRNAs, for three structural categories. The values represent number of tRFs normalized to the number of i-tRFs 5´-tRFs and 3´-tRFs.
Figure 3.
Figure 3.. tRFs are preferentially positively correlated with shorter mRNAs and context-specific cellular destinations of the encoded proteins.
(A) Heatmap and hierarchical clustering (metric: Euclidean distance) on the Z-scores of the mean length of a gene’s mRNA-space (i.e. the union of the exons) for mRNAs participating in tRF-mRNA correlations, compared to the observed length distribution of the transcribed mRNAs. Purple color indicates statistically significant depletion whereas gold means statistically significant enrichment. (B-C) The localization of the protein products whose mRNAs are statistically-significantly correlated either positively (B), or negatively (C), with nuclear (top row in each group) and mitochondrial (MT) (bottom row in each group) tRFs. The size of the shown rectangles corresponds to the number of protein products that localize in the shown compartment. The color of the block represents enrichment (gold) or depletion (purple) compared to the expected distribution (P < 0.001; χ2 test). The shown dendrogram results from the hierarchical clustering (metric: Euclidean distance) of cancer types on the residual scores, as computed by the χ2 test, of all panels. The vertical red lines separate the three main cancer groupings as defined by the dendrogram and serve as visual reference points within the figure.
Figure 4.
Figure 4.. tRFs correlate with universal processes in a context-dependent manner.
(A) Ribosomal proteins as an example of a core pathway comprising genes whose mRNAs are correlated with tRFs in at least three different cancer types. The mRNAs are grouped based on the complexes in which the encoded proteins participate. (B) Network of tRFs and groups of enriched biological processes are linked if they appear in at least 10 cancer types. The thickness and gray tone of the edge is proportional to the number of average correlations of the tRF-mRNA pairs across cancers. The GO terms and their groupings are shown in Supplemental Fig. S8-S9. (C-D) Examples of context-specific wiring of core pathways with nuclear and mitochondrial tRFs. The proteasome (C) genes are grouped based on subunit identity. For the glycolysis network (D), we connected genes if the encoded enzymes catalyze consecutive reactions. Gene nodes are colored cyan if they are correlated with tRFs in that cancer, otherwise they are shown as cyclical contours. For both the proteasome (C) and the glycolysis (D) networks, the mRNAs are arranged in exactly the same manner: note how, in different cancer types, the tRFs are correlated with different mRNAs within these networks.
Figure 5.
Figure 5.. tRFs are correlated with genes of specific repeat element content.
Heatmaps of the Z-scores of the mean density of each repeat element category with reference to the background density distribution of mean repeat content in genes correlated with nuclear (A) and MT (B) tRFs. The enrichments/depletions were calculated separately for the exons (top panel) and the introns (bottom panel) of the genes whose mRNAs are correlated with the tRFs. The repeat categories (rows) are ordered in the same way for all four panels. The shown dendrogram at the bottom of the figure results from the hierarchical clustering (metric: Manhattan distance) on the matrix of the Z-scores of all shown panels. Details about the overlap of repeat families with the genes whose mRNAs are correlated with tRFs can be found at Supplemental Table S8 for each of the cancer types.
Figure 6.
Figure 6.. Sex disparities in the correlation of tRFs with mRNAs in bladder, lung and kidney cancers.
(A) Plot showing the number of correlations that the tRFs from different isoacceptors have with mRNAs in each sex in primary tumors of BLCA. Isoacceptors are colored and labeled if the tRFs that originate in them participate in correlations with mRNAs that are at least twice as many in one of the two sexes compared to the other. Note that this is a log2-log2 plot. (B) Protein-Protein interaction network of CDKs and the proteins that interact with CDKs. Nodes are colored based on the mRNAs’ sex-specific correlation patterns in BLCA. Specifically, nodes are colored green if the mRNA is correlated with tRFs exclusively in male subjects and orange if it is respectively found in female subjects only. If the mRNA is differentially co-expressed with different tRFs in each sex, then the node is colored magenta. CDKs that are not differentially co-expressed with tRFs are colored cyan. (C) Protein-protein interaction network of the MAPK signaling network and the proteins that interact with them. The nodes are connected to isoacceptors if the corresponding mRNAs are correlated with the corresponding tRFs in only one sex. (D) Metabolic network of IMP biosynthesis. Nodes are connected if the encoded proteins catalyze consecutive reactions in purine metabolism. The nodes are connected to isoacceptors if the corresponding mRNAs are correlated with the corresponding tRFs in only one sex. All analyzed samples in this Figure correspond to donors of one race/ethnicity (White).

References

    1. Keam SP, Hutvagner G. tRNA-Derived Fragments (tRFs): Emerging New Roles for an Ancient RNA in the Regulation of Gene Expression. Life (Basel) 2015;5:1638–51 - PMC - PubMed
    1. Shigematsu M, Kirino Y. tRNA-Derived Short Non-coding RNA as Interacting Partners of Argonaute Proteins. Gene Regul Syst Bio 2015;9:27–33 - PMC - PubMed
    1. Kumar P, Anaya J, Mudunuri SB, Dutta A. Meta-analysis of tRNA derived RNA fragments reveals that they are evolutionarily conserved and associate with AGO proteins to recognize specific RNA targets. BMC Biol 2014;12:78. - PMC - PubMed
    1. Pliatsika V, Loher P, Magee R, Telonis AG, Londin E, Shigematsu M, et al. MINTbase v2.0: a comprehensive database for tRNA-derived fragments that includes nuclear and mitochondrial fragments from all The Cancer Genome Atlas projects. Nucleic Acids Res 2018;46:D152–D9 - PMC - PubMed
    1. Telonis AG, Loher P, Honda S, Jing Y, Palazzo J, Kirino Y, et al. Dissecting tRNA-derived fragment complexities using personalized transcriptomes reveals novel fragment classes and unexpected dependencies. Oncotarget 2015;6:24797–822 - PMC - PubMed

Publication types