. 2019 Apr 17;11(488):eaav0936.
doi: 10.1126/scitranslmed.aav0936.

Resistance to neoadjuvant chemotherapy in triple-negative breast cancer mediated by a reversible drug-tolerant state

Affiliations

Resistance to neoadjuvant chemotherapy in triple-negative breast cancer mediated by a reversible drug-tolerant state

Gloria V Echeverria et al. Sci Transl Med. .

Abstract

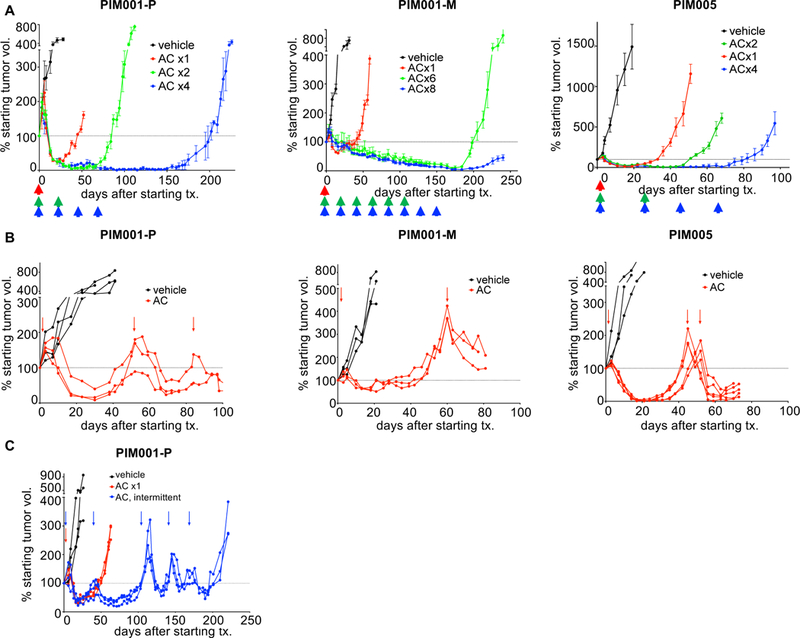
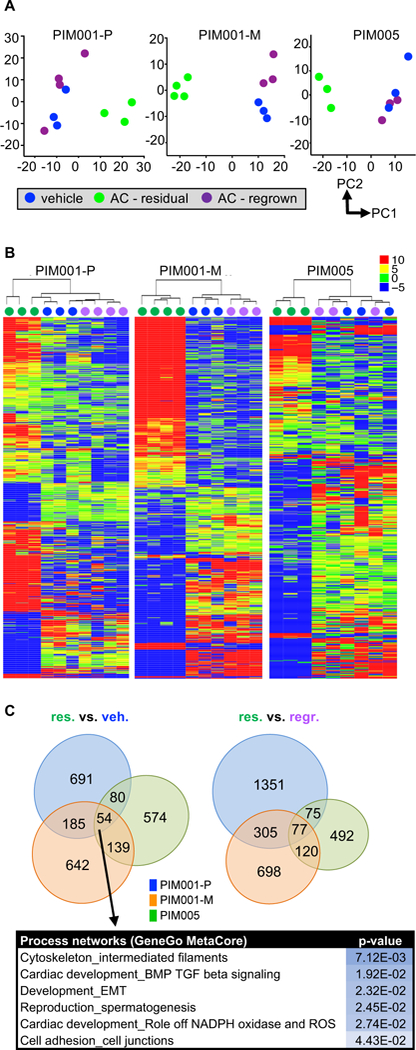
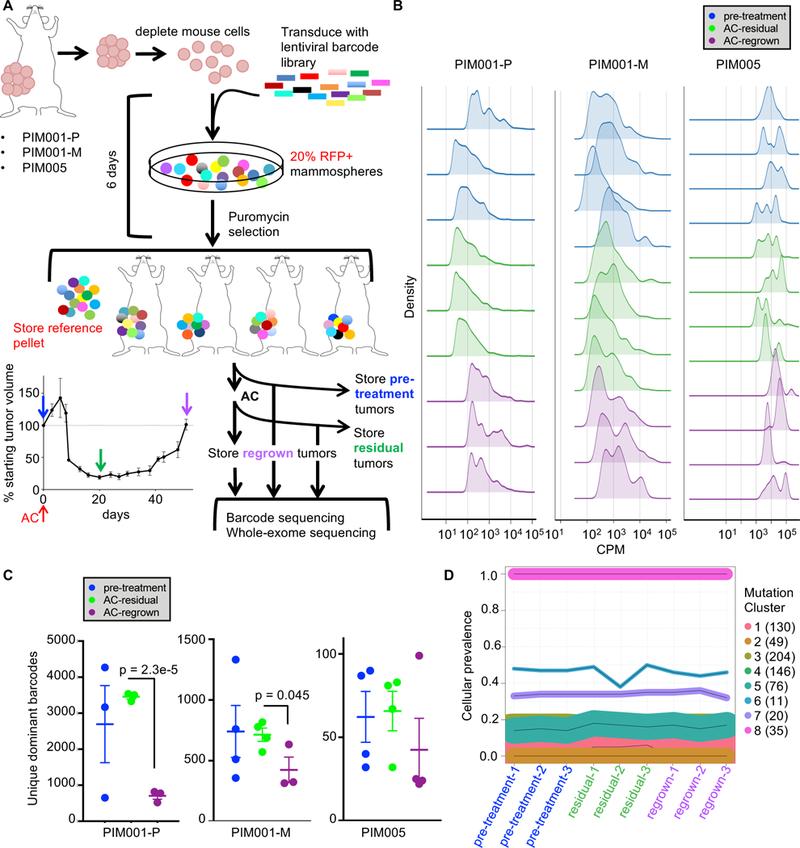
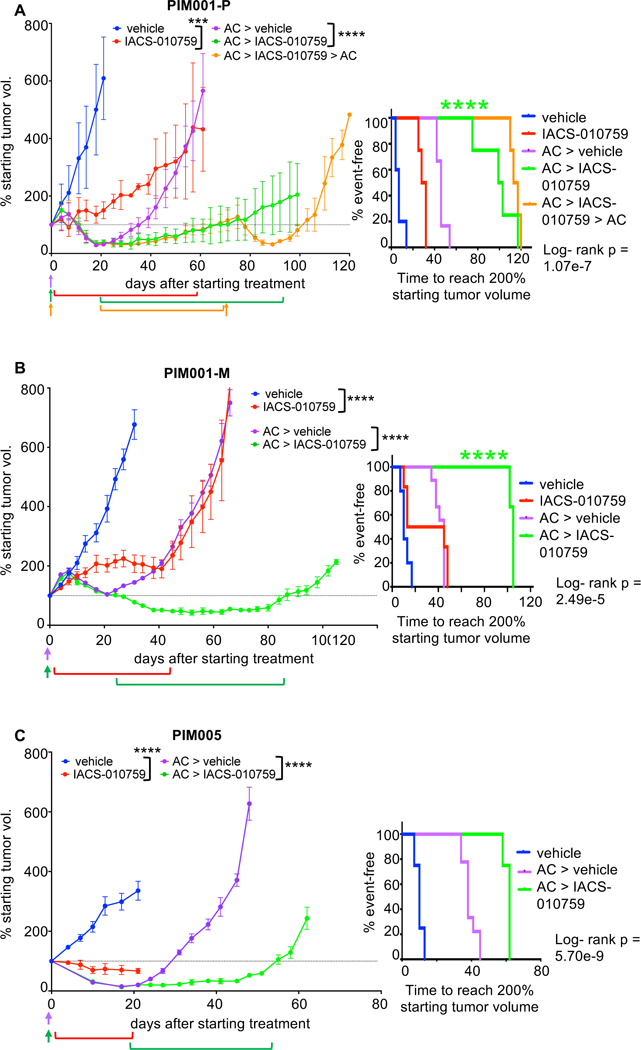
Eradicating triple-negative breast cancer (TNBC) resistant to neoadjuvant chemotherapy (NACT) is a critical unmet clinical need. In this study, patient-derived xenograft (PDX) models of treatment-naïve TNBC and serial biopsies from TNBC patients undergoing NACT were used to elucidate mechanisms of chemoresistance in the neoadjuvant setting. Barcode-mediated clonal tracking and genomic sequencing of PDX tumors revealed that residual tumors remaining after treatment with standard frontline chemotherapies, doxorubicin (Adriamycin) combined with cyclophosphamide (AC), maintained the subclonal architecture of untreated tumors, yet their transcriptomes, proteomes, and histologic features were distinct from those of untreated tumors. Once treatment was halted, residual tumors gave rise to AC-sensitive tumors with similar transcriptomes, proteomes, and histological features to those of untreated tumors. Together, these results demonstrated that tumors can adopt a reversible drug-tolerant state that does not involve clonal selection as an AC resistance mechanism. Serial biopsies obtained from patients with TNBC undergoing NACT revealed similar histologic changes and maintenance of stable subclonal architecture, demonstrating that AC-treated PDXs capture molecular features characteristic of human TNBC chemoresistance. Last, pharmacologic inhibition of oxidative phosphorylation using an inhibitor currently in phase 1 clinical development delayed residual tumor regrowth. Thus, AC resistance in treatment-naïve TNBC can be mediated by nonselective mechanisms that confer a reversible chemotherapy-tolerant state with targetable vulnerabilities.


Conflict of interest statement

Competing interests

S.L.M. receives research funding as principal investigator for ongoing clinical trials at her institution from Novartis, EMD Serono, Roche/Genentech Seattle Genetics. Oncothyreon, Pfizer, Bayer, and Lily. MJA is chief scientific officer and shareholder of DarwinHealth, Inc. ACalifano is founder, equity holder, consultant, and director of DarwinHealth Inc., a company that has licensed some of the algorithms used in this manuscript from Columbia University. Columbia University is also an equity holder in DarwinHealth Inc. All other authors declare they have no competing interests.

Figures

Figure 1.
Figure 1.. PDX models of treatment-naïve TNBC exhibit diverse responses to AC.
One or two cycles of AC were administered to PDX models of treatment-naïve TNBC starting on day zero (arrows). All PDXs were derived from primary tumors with the exception of PIM001-M, which was derived from the dermal metastasis to the chest wall of the same patient from whom PIM001-P (primary tumor) was derived. Data shown are mean +/− standard error of the mean (SEM; n=3 per group).
Figure 2.
Figure 2.. Residual and regrown tumors cannot be eliminated by continued chemotherapy treatment.
A. To model the schedule of AC treatments administered to patients, AC was administered to mice in regular 21-day intervals (arrows). To enable prolonged dosing without toxic side effects, we used NRG mice for these long-term treatment studies. The horizontal dotted line denotes 100% of the starting tumor volume (measured on day 0). Data shown are mean +/− SEM (n=4 per group). B. NOD/SCID mice were treated with AC on day 0 and were only re-dosed with AC when tumors regrew to the starting tumor size (arrows). Data shown are mean +/− SEM. C. NRG mice bearing PIM001-P tumors were treated with a total of 5 cycles of AC, and each subsequent dose was administered only when tumors re-grew to the starting tumor size (arrows). Data shown are mean +/− SEM.
Figure 3.
Figure 3.. Residual tumors adopt a distinct histologic state that is reverted in regrown tumors.
A. Replicate FFPE tumor samples were assembled into TMAs (triplicate 1 mm punches), and stained with H&E. B. FFPE primary tumor samples obtained from a TNBC patient (ART-57) before, during, and after completion of NACT were stained with H&E and imaged. An image of her metastatic relapse to the chest wall is shown in the bottom panel. Chemotherapy effects on fibrosis and tumor cell morphology are shown with arrows. PaCT, panitumumab + carboplatin + paclitaxel (Taxol). RCB, residual cancer burden assessed by examination of the surgical biopsy. No tx, no treatment was administered between surgery and metastatic relapse. Volumetric reduction after AC treatment was assessed by ultrasound. Scale bars are 200 µm for parts A&B.
Figure 4.
Figure 4.. Shifts in the transcriptome of residual tumors are reversible.
Vehicle (blue; day 0), residual (green; AC-treated day 21), and regrown (purple; AC-treated day 50) tumors were subjected to RNAseq. A. RNA-seq data were analyzed by principal component analysis, and the first two principal components (PC1&2) are plotted for each PDX model. Principal components were calculated using log2-transformed TPM values for the 500 genes with the highest variance between samples, considering only genes with at least 20 reads in at least one sample. The mean was set as zero. B. Within each PDX model, genes significantly altered (log2FC≥0.5, FDR<0.05, Benjamini-Hochberg test, sum of TPMs across all samples ≥100) in any pairwise comparison (vehicle-vs-regrown, residual-vs-vehicle, residual-vs-regrown) are displayed in a heat map organized by hierarchical clustering. The color scale refers to TPMs. C. Genes significantly differentially expressed, as defined in B, in residual tumors compared to vehicle-treated tumors were compared between three PDX models. The list includes significantly altered process networks (GeneGo Metacore) regulated by the 54 genes significantly differentially expressed in residual tumors compared to vehicle-treated tumors across all three PDX models.
Figure 5.
Figure 5.. Residual tumors maintain the clonal architecture and genomic complexity of pre-treatment tumors.
A. Lentiviral barcodes were introduced into freshly dissociated tumor cells from three PDX models, then after brief ex vivo culture engrafted into the MFPs of NOD/SCID mice. DNA extracted from tumors was subjected to high-throughput barcode sequencing. B. Density plots show the overall distribution of the top 95% most frequent barcodes in each sample. CPM, counts per million. C. The top 95% most abundant barcodes were quantified in each sample, thus excluding barcodes detected at extremely low frequencies (two-tailed T-tests comparing residual to regrown). Data shown are mean +/− SEM. D. Line plots of estimated cellular prevalence of mutation clusters in PIM001-P as modeled by PyClone analysis of WES data are shown. Each line represents a mutation cluster, and the thickness of the line is proportional to the number of mutations within that cluster. The number of mutations comprising each cluster is shown in parentheses.
Figure 6.
Figure 6.. Subclone analysis of serially biopsied human TNBCs reveals lack of subclone enrichment after AC.
A. Serial biopsies from two TNBC patients were analyzed by WES. The tumors’ volumetric changes in response to four cycles of AC treatment are indicated. PDT, atezolizumab + Abraxane. PaCT, panitumumab + carboplatin + paclitaxel (Taxol). B. Line plots of estimated cellular prevalence of mutation clusters modeled by PyClone are shown. Each line represents a mutation cluster, and the thickness of the line is proportional to the number of mutations within the cluster. The number of mutations comprising each cluster is shown in parentheses. C. These plots display the prevalence of subclones throughout treatment. Subclonal architecture was reconstructed based on PyClone results.
Figure 7.
Figure 7.. The residual tumor state is targetable by inhibition of oxidative phosphorylation.
A. NOD/SCID mice bearing PIM001-P tumors were treated with an inhibitor of oxidative phosphorylation (IACS-010759, per os [p.o.], quaque die [q.d.]) or vehicle in the treatment-naïve or in the residual setting after AC treatment (> in the figure indicates sequential treatments). Days of IACS-010759 treatment are indicated by brackets. Days of AC treatment are indicated by arrows. ***ANOVA p-value <0.001 (day 21), ****ANOVA p-value <0.0001 (day 61). Data shown are mean +/− SEM (n=4–6 per group). The right panel is a Km curve of the time for each mouse’s tumor to reach 200% of the starting tumor volume (measured on day 0), and the log-rank p-value is shown. Testing for interaction of treatment effects using a hazards model (data file S9) shows synergy in the AC + IACS-010759 sequential combination (****p<0.0001). B. As above, mice bearing PIM001-M tumors were treated with the indicated agents. ****ANOVA p-value <0.0001 (day 31 & day 66). Data shown are mean +/− SEM (n=3–9 per group). Testing for interaction of treatment effects using a hazards model (data file S9) shows synergy in the AC + IACS-010759 sequential combination (****p<0.0001). C. As above, mice bearing PIM005 tumors were treated with the indicated agents. ****ANOVA p-value <0.0001 (day 21 & day 48). Data shown are mean +/− SEM (n=4–8 per group).

References

    1. Liedtke C, Mazouni C, Hess KR, André F, Tordai A, Mejia JA, Symmans WF, Gonzalez-Angulo AM, Hennessy B, Green M, Cristofanilli M, Hortobagyi GN, Pusztai L, Response to Neoadjuvant Therapy and Long-Term Survival in Patients With Triple-Negative Breast Cancer. J Clin Oncol 26, 1275–1281 (2008). - PubMed
    1. Cortazar P, Zhang L, Untch M, Mehta K, Costantino JP, Wolmark N, Bonnefoi H, Cameron D, Gianni L, Valagussa P, Swain SM, Prowell T, Loibl S, Wickerham DL, Bogaerts J, Baselga J, Perou C, Blumenthal G, Blohmer J, Mamounas EP, Bergh J, Semiglazov V, Justice R, Eidtmann H, Paik S, Piccart M, Sridhara R, Fasching PA, Slaets L, Tang S, Gerber B, Geyer CE Jr., Pazdur R, Ditsch N, Rastogi P, Eiermann W, von Minckwitz G, Pathological complete response and long-term clinical benefit in breast cancer: the CTNeoBC pooled analysis. Lancet 384, 164–172 (2014). - PubMed
    1. von Minckwitz G, Untch M, Blohmer JU, Costa SD, Eidtmann H, Fasching PA, Gerber B, Eiermann W, Hilfrich J, Huober J, Jackisch C, Kaufmann M, Konecny GE, Denkert C, Nekljudova V, Mehta K, Loibl S, Definition and impact of pathologic complete response on prognosis after neoadjuvant chemotherapy in various intrinsic breast cancer subtypes. Journal of clinical oncology : official journal of the American Society of Clinical Oncology 30, 1796–1804 (2012). - PubMed
    1. Symmans WF, Wei C, Gould R, Yu X, Zhang Y, Liu M, Walls A, Bousamra A, Ramineni M, Sinn B, Hunt K, Buchholz TA, Valero V, Buzdar AU, Yang W, Brewster AM, Moulder S, Pusztai L, Hatzis C, Hortobagyi GN, Long-Term Prognostic Risk After Neoadjuvant Chemotherapy Associated With Residual Cancer Burden and Breast Cancer Subtype. J Clin Oncol 35, 1049–1060 (2017). - PMC - PubMed
    1. Yates LR, Gerstung M, Knappskog S, Desmedt C, Gundem G, Van Loo P, Aas T, Alexandrov LB, Larsimont D, Davies H, Li Y, Ju YS, Ramakrishna M, Haugland HK, Lilleng PK, Nik-Zainal S, McLaren S, Butler A, Martin S, Glodzik D, Menzies A, Raine K, Hinton J, Jones D, Mudie LJ, Jiang B, Vincent D, Greene-Colozzi A, Adnet PY, Fatima A, Maetens M, Ignatiadis M, Stratton MR, Sotiriou C, Richardson AL, Lonning PE, Wedge DC, Campbell PJ, Subclonal diversification of primary breast cancer revealed by multiregion sequencing. Nat Med 21, 751–759 (2015). - PMC - PubMed

Publication types