. 2019 Apr 30;116(18):9020-9029.
doi: 10.1073/pnas.1818210116. Epub 2019 Apr 17.

Cancer stemness, intratumoral heterogeneity, and immune response across cancers

Affiliations

Cancer stemness, intratumoral heterogeneity, and immune response across cancers

Alex Miranda et al. Proc Natl Acad Sci U S A. .

Abstract

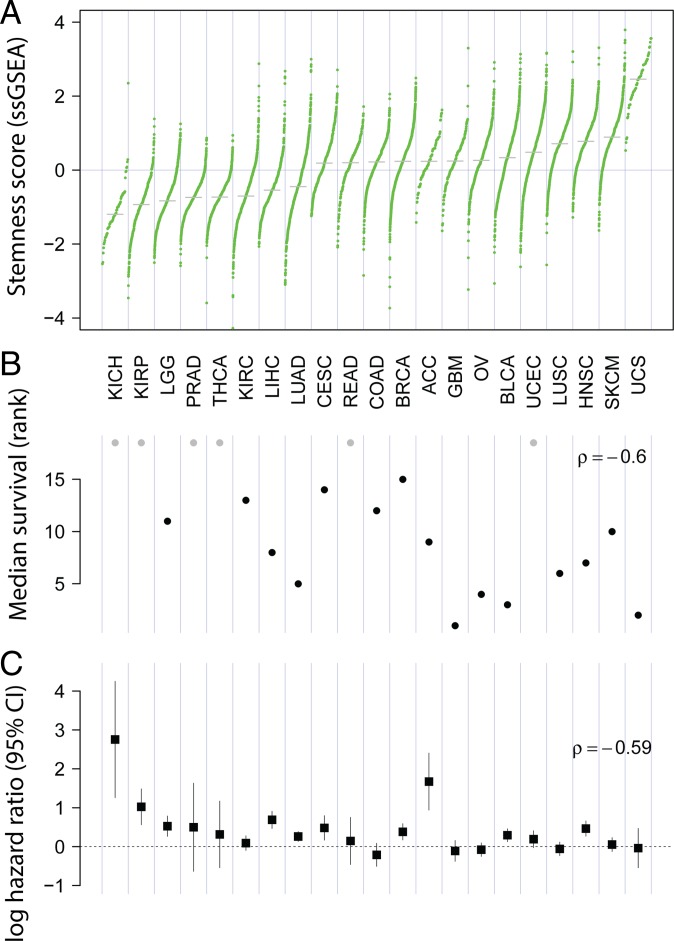
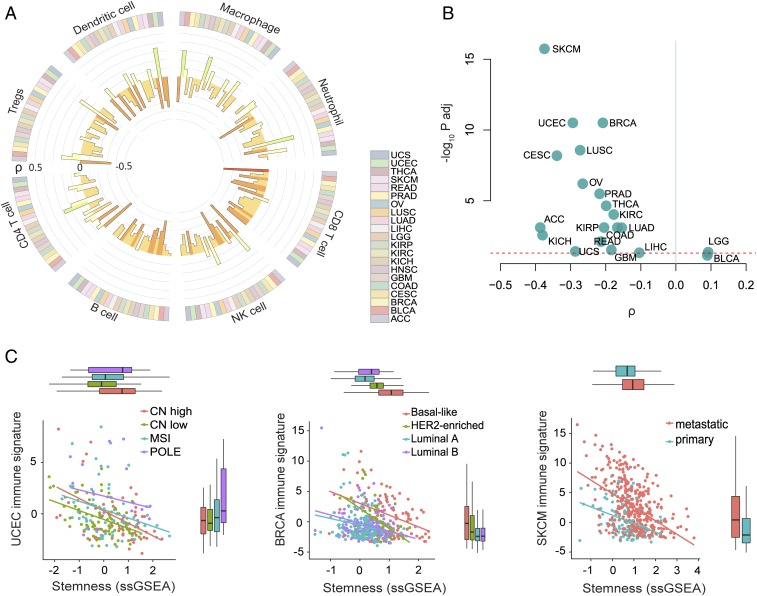
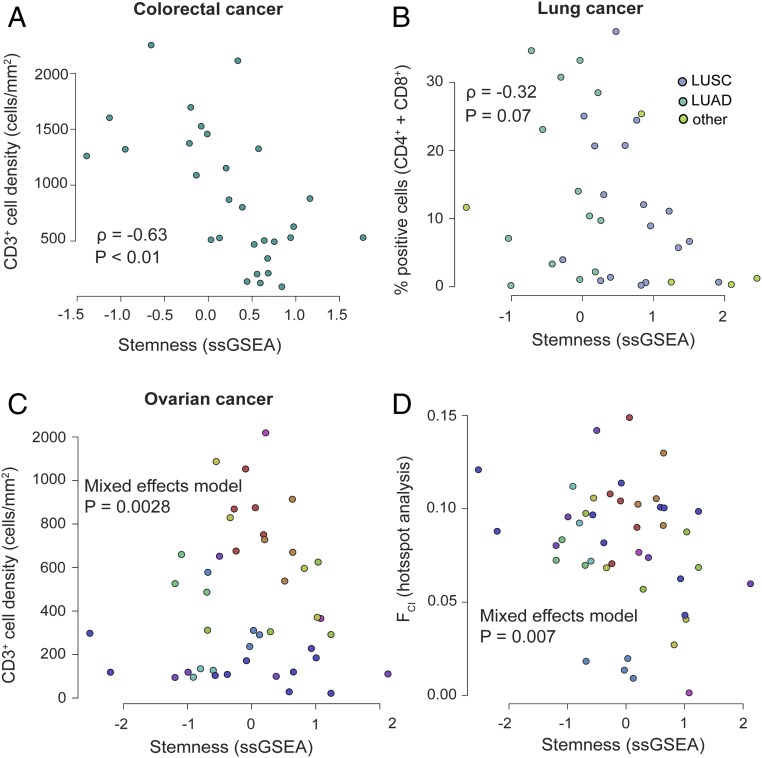
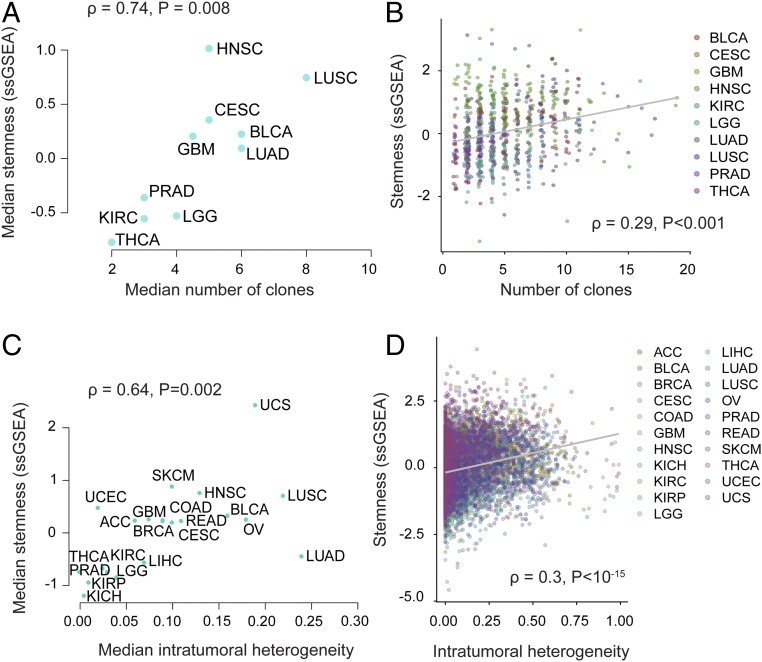
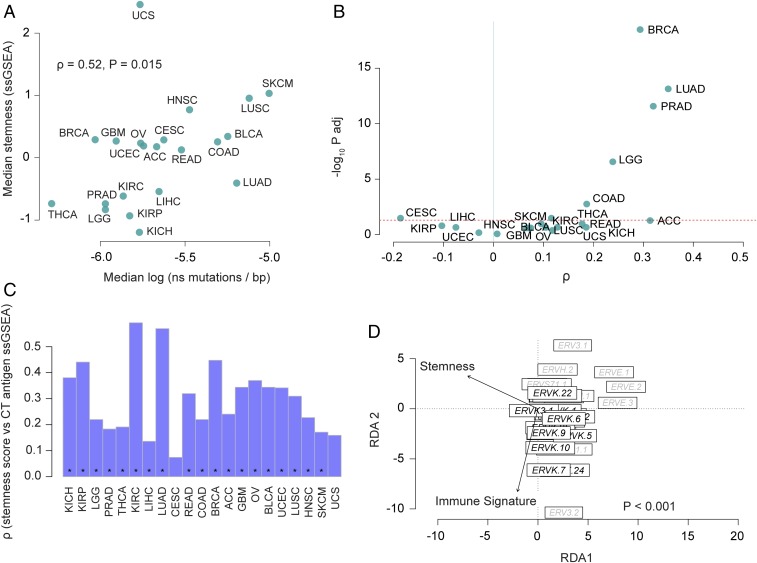
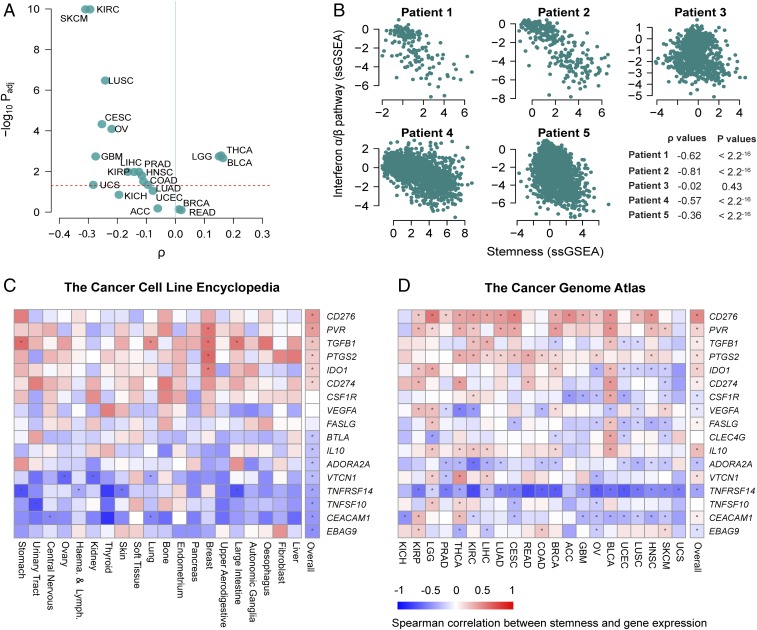
Regulatory programs that control the function of stem cells are active in cancer and confer properties that promote progression and therapy resistance. However, the impact of a stem cell-like tumor phenotype ("stemness") on the immunological properties of cancer has not been systematically explored. Using gene-expression-based metrics, we evaluated the association of stemness with immune cell infiltration and genomic, transcriptomic, and clinical parameters across 21 solid cancers. We found pervasive negative associations between cancer stemness and anticancer immunity. This occurred despite high stemness cancers exhibiting increased mutation load, cancer-testis antigen expression, and intratumoral heterogeneity. Stemness was also strongly associated with cell-intrinsic suppression of endogenous retroviruses and type I IFN signaling, and increased expression of multiple therapeutically accessible immunosuppressive pathways. Thus, stemness is not only a fundamental process in cancer progression but may provide a mechanistic link between antigenicity, intratumoral heterogeneity, and immune suppression across cancers.

Keywords: antitumor immunity; cancer stemness; intratumoral heterogeneity.


Conflict of interest statement

The authors declare no conflict of interest.

Figures

Fig. 1.
Fig. 1.
Stemness and survival across cancers. (A) Stemness score varies widely across 21 solid cancers from TCGA. Each point represents an individual case, and cancer types are ordered by median stemness score (z-scored ssGSEA). (B) Median survival decreases with increasing median stemness (P = 0.004). Gray points represent cancers in which median overall survival times were not evaluable. (C) Stemness associates with poor outcome within cancers. Log hazard ratio (±95% CI) for the association of stemness with overall survival is shown. Hazard decreases with increasing average stemness of cancers (P = 0.008). Cox models control for patient age and tumor purity. Cancer acronyms are used as defined by TCGA (https://portal.gdc.cancer.gov).
Fig. 2.
Fig. 2.
Stemness negatively associates with immune cell signatures. (A) Circos plot showing the association between stemness score and the presence of 8 inferred immune cell types across 21 cancer types (colored bars in outer ring). The color and height of the inner bars represent the Spearman correlation ρ values for each cell type and cancer type. (B) Volcano plot showing the association between stemness score and immune signature (sum of z-scored signatures of CD8+ T cells, NK cells, and B cells) for each cancer. The dashed line indicates Padj = 0.05. (C) Association between stemness score and immune signature in the different molecular subtypes of endometrial (UCEC) and breast (BRCA) cancer, and within primary and metastatic melanoma (SKCM) samples (Padj < 10−7). Each point represents one case. Colors indicate the different molecular subtypes of UCEC and BRCA, or sample types for SKCM. CN, copy number; MSI, microsatellite instable; POLE, polymerase epsilon.
Fig. 3.
Fig. 3.
Relationship between stemness and immune cell infiltrates in different cancer cohorts scored via IHC. (A) Stemness score negatively associates with tumor-infiltrating CD3+ T cells in colorectal cancer (P < 0.01; n = 33; data from ref. 29). Each point represents one patient sample. (B) Stemness negatively associates with tumor-infiltrating T cells (in this case the sum of CD4+ and CD8+ cells) in lung cancer (P = 0.07; n = 35; data from ref. 30). Colors denote adeno versus squamous cell lung cancers. (C) Stemness is significantly associated with tumor-infiltrating CD3+ T cells in a multisite dataset of high-grade ovarian cancer (P = 0.028; n = 44 samples from 12 patients; data from ref. 15). Colors represent individual patients. (D) By hotspot analysis, the fraction of tissue area occupied by colocalizing tumor and immune cells (FCI) is negatively associated with stemness in a multisite dataset from high grade ovarian cancer (P < 0.01; 44 samples from 12 patients; data from ref. 15). Colors represent individual patients.
Fig. 4.
Fig. 4.
Stemness associates with intratumoral heterogeneity within and across cancers. (A) Median stemness and median clonality [inferred by Andor et al. (32)] are strongly correlated across cancers (n = 11; P = 0.008). (B) Stemness score and clonality [inferred by Andor et al. (32)] are correlated across patients while controlling for cancer type (n = 935; P = 0.0002). Colored points represent different tumor sites. (C) Median stemness score and median intratumoral heterogeneity score [inferred by Thorsson et al. (26)] are strongly correlated across cancers (n = 20; P = 0.002). (D) Stemness score and intratumoral heterogeneity [inferred by Thorsson et al. (26)] are correlated across patients while controlling for cancer type (n = 6,791; P < 10−15). Colored points represent different tumor sites. Spearman ρ values are shown.
Fig. 5.
Fig. 5.
Mutation load, CT antigen expression and ERV associations with stemness. (A) Median stemness and median mutation load are positively correlated across cancers (n = 21; P = 0.015). Mutation load is represented as log-transformed nonsynonymous mutations per base (log10 ns mutations per base pair). (B) Volcano plot reveals stemness score and mutation load correlate within some cancers (upper right quadrant). The x axis represents Spearman correlation ρ values, and the y axis represents −log10-adjusted P values (Padj). Dashed red line indicates the significance threshold, Padj value = 0.05. (C) Stemness score and CT antigen expression (ssGSEA of CT antigen gene set) positively correlate in most cancers. Bar plots show the Spearman ρ values for each cancer type, and asterisks denote Padj < 0.05. (D) Redundancy analysis triplot reveals stemness negatively associates with multivariate ERV expression (P < 0.001; 33 ERVs evaluated in 4,252 samples, analysis conditioned by cancer type).
Fig. 6.
Fig. 6.
Cell-intrinsic stemness score associates with decreased type I IFN signaling and increased expression of CD276 and PVR. (A) Volcano plot reveals that stemness score and type I IFN signaling (reactome IFN α/β pathway ssGSEA) are negatively correlated in most cancers (upper left quadrant). The x axis represents Spearman correlation ρ values, and the y axis represents −log10 adjusted P values (Padj). Dashed red line indicates the significance threshold, Padj = 0.05. (B) Stemness score is negatively associated with type I IFN signaling (reactome IFN α/β pathway ssGSEA) in tumor cells from four of five lung cancer patients, based on scRNA-seq data from ref. . Each point represents a single tumor cell. (C and D) Heatmaps showing Spearman correlations for stemness and select immunosuppressive genes based on data from the CCLE (C) and TCGA (D). Spearman correlations were calculated within tissues represented in the CCLE by more than 10 cell lines. Genes are ranked according to the final column (“overall”), which represents the correlation across all samples, irrespective of cell line or tumor type. Red-blue intensities reflect the correlation ρ values. Asterisks denote Benjamini–Hochberg-corrected significant associations (Padj < 0.05).

Comment in

References

    1. Gajewski TF. The next hurdle in cancer immunotherapy: Overcoming the non-T-cell-inflamed tumor microenvironment. Semin Oncol. 2015;42:663–671. - PMC - PubMed
    1. Batlle E, Clevers H. Cancer stem cells revisited. Nat Med. 2017;23:1124–1134. - PubMed
    1. Nassar D, Blanpain C. Cancer stem cells: Basic concepts and therapeutic implications. Annu Rev Pathol. 2016;11:47–76. - PubMed
    1. O’Brien CA, Pollett A, Gallinger S, Dick JE. A human colon cancer cell capable of initiating tumour growth in immunodeficient mice. Nature. 2007;445:106–110. - PubMed
    1. Al-Hajj M, Wicha MS, Benito-Hernandez A, Morrison SJ, Clarke MF. Prospective identification of tumorigenic breast cancer cells. Proc Natl Acad Sci USA. 2003;100:3983–3988. - PMC - PubMed

Publication types

MeSH terms

LinkOut - more resources