. 2019 Apr 17;9(1):6223.
doi: 10.1038/s41598-019-42682-0.

Enigmatic incongruence between mtDNA and nDNA revealed by multi-locus phylogenomic analyses in freshwater snails

Affiliations

Enigmatic incongruence between mtDNA and nDNA revealed by multi-locus phylogenomic analyses in freshwater snails

Takahiro Hirano et al. Sci Rep. .

Abstract

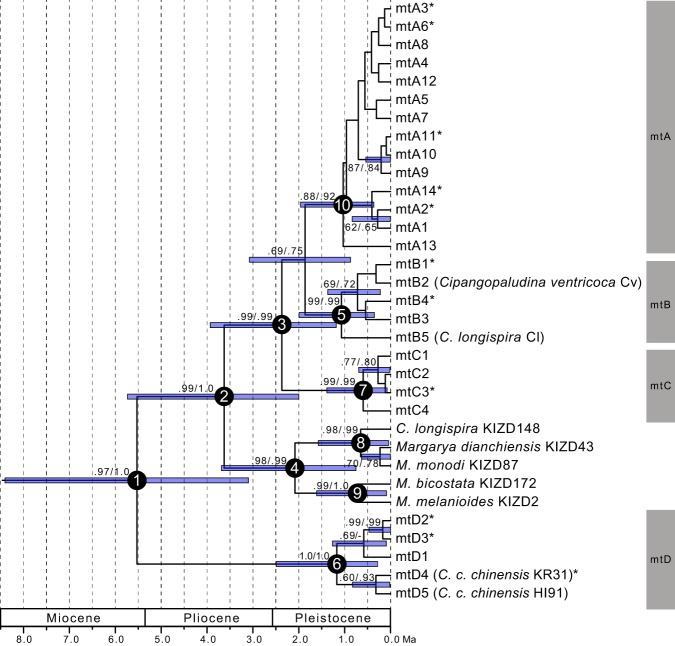
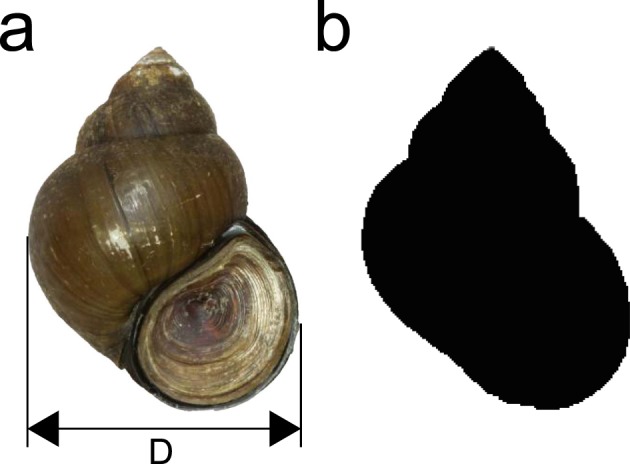
Phylogenetic incongruence has frequently been encountered among different molecular markers. Recent progress in molecular phylogenomics has provided detailed and important information for evolutionary biology and taxonomy. Here we focused on the freshwater viviparid snails (Cipangopaludina chinensis chinensis and C. c. laeta) of East Asia. We conducted phylogenetic analyses and divergence time estimation using two mitochondrial markers. We also performed population genetic analyses using genome-wide SNPs. We investigated how and which phylogenetic patterns reflect shell morphology. The results showed these two species could be separated into four major mitochondrial clades, whereas the nuclear clusters supported two groups. The phylogenetic patterns of both mtDNA and nDNA largely reflected the geographical distribution. Shell morphology reflected the phylogenetic clusters based on nDNA. The findings also showed these two species diversified in the Pliocene to early Pleistocene era, and occurred introgressive hybridisation. The results also raise the taxonomic issue of the two species.


Conflict of interest statement

The authors declare no competing interests.

Figures

Figure 1
Figure 1
Maximum likelihood consensus tree of East Asian viviparids based on combined sequences from the 16S and COI genes. Each operational taxonomic unit (OTU) label represents the haplotype number in Table S1. Samples from GenBank are indicated each species/subspecies name followed by the specimen ID. The numbers in brackets next to the specimen ID indicate the sampling site number in Fig. 2. Each clade was differentiated by a grey colour. Numbers on branches indicate maximum likelihood bootstrap values followed by Bayesian posterior probabilities. Scale bar indicates 0.04 substitutions per site. The asterisk next to the OTU label indicates a haplotype shared by some other individuals.
Figure 2
Figure 2
Map showing the sampling sites. Site numbers 1–39 are in Japan including the Ryukyu Islands; site 40 is in South Korea; 41 and 42 are in China; 43 is in Taiwan; and 44 is in Vietnam. See Table S1 for details. The map was created using the software Adobe Illustrator CS6, Macintosh version, (https://www.adobe.com/jp/) and “Map data: Google, DigitalGlobe”.
Figure 3
Figure 3
Maximum clade credibility tree generated with the BEAST2 analysis from the combined sequences from the 16S and COI genes. The outgroups (Anularya, Cipangopaludina japonica, Heterogen, Sinotaia, and Tchangmargarya) are not shown. Each operational taxonomic unit (OTU) label represents the haplotype number in Table S1. Samples from GenBank are indicated each species/subspecies name followed by the specimen ID. Each clade was differentiated by a grey colour. Numbers on branches indicate Bayesian posterior probabilities of UL model followed by Bayesian posterior probabilities of SC model. Node bars indicate a 95% CI for the divergence times by UL model analysis. The principal nodes are named with nominal numbers. The asterisk next to the OTU label indicates a haplotype shared by some other individuals.
Figure 4
Figure 4
Results of the population genetic analyses. (a) Results of the STRUCTURE analyses for K = 2–5. The grey bars and numbers above the results of the STRUCTURE indicate each mitochondrial clade and distribution area, and sampling site number in Fig. 2, respectively. The green and blue colours indicate the two different genetic clusters. (b) Plots of results from the principal component analyses (PCA) based on MIG-seq SNPs. The green and blue, and grey symbols under the plots indicate the two genetic clusters and the mixed genetic individuals of STRUCTURE for K = 2, respectively.
Figure 5
Figure 5
Simulated nine scenarios. Pop1 is Sasebo (V1263–1265), Pop2 is Tanegashima Island (V632, V1416, V1417), and Pop3 is Sapporo (V983, V984). N1, N2 N3 and NA is population size. t1 and t2 is generation time for merging of population.
Figure 6
Figure 6
Results of canonical discriminant analysis (CDA). Green and blue indicate laeta and chinensis, respectively. (a) Plots of results from the first CDA based on shell width – D and PCs. The symbols under the plots indicate the taxa of each mitochondrial clade. (b) Histogram of results of the second CDA. The photographs on the left indicate each shell morphology. N indicates the number of individuals.
Figure 7
Figure 7
Examples of figure data for the morphological analysis. (a) Shell morphology and shell width (D). (b) The entire outline of the shell.

References

    1. Sun Z, et al. Rapid and recent diversification patterns in Anseriformes birds: Inferred from molecular phylogeny and diversification analyses. PLoS One. 2017;12:e0184529. doi: 10.1371/journal.pone.0184529. - DOI - PMC - PubMed
    1. Walther AC, Lee T, Burch JB, Ó Foighil D. Confirmation that the North American ancylid Ferrissia fragilis (Tryon, 1863) is a cryptic invader of European and East Asian freshwater ecosystems. Journal of Molluscan Studies. 2006;72:318–321. doi: 10.1093/mollus/eyl009. - DOI
    1. Haase M, Zielske S. Five new cryptic freshwater gastropod species from New Caledonia (Caenogastropoda, Truncatelloidea, Tateidae) ZooKeys. 2015;523:63–87. doi: 10.3897/zookeys.523.6066. - DOI - PMC - PubMed
    1. Joly S, McLenachan PA, Lockhart PJ. A statistical approach for distinguishing hybridization and incomplete lineage sorting. American Naturalist. 2009;174:54–70. doi: 10.1086/600082. - DOI - PubMed
    1. Parham JF, et al. Genetic introgression and hybridization in Antillean freshwater turtles (Trachemys) revealed by coalescent analyses of mitochondrial and cloned nuclear markers. Molecular Phylogenetics and Evolution. 2013;67:176–187. doi: 10.1016/j.ympev.2013.01.004. - DOI - PubMed

Publication types

Substances