. 2019 Apr 17;9(1):6232.
doi: 10.1038/s41598-019-42552-9.

Impact of slow breathing on the blood pressure and subarachnoid space width oscillations in humans

Affiliations

Impact of slow breathing on the blood pressure and subarachnoid space width oscillations in humans

Magdalena K Nuckowska et al. Sci Rep. .

Abstract

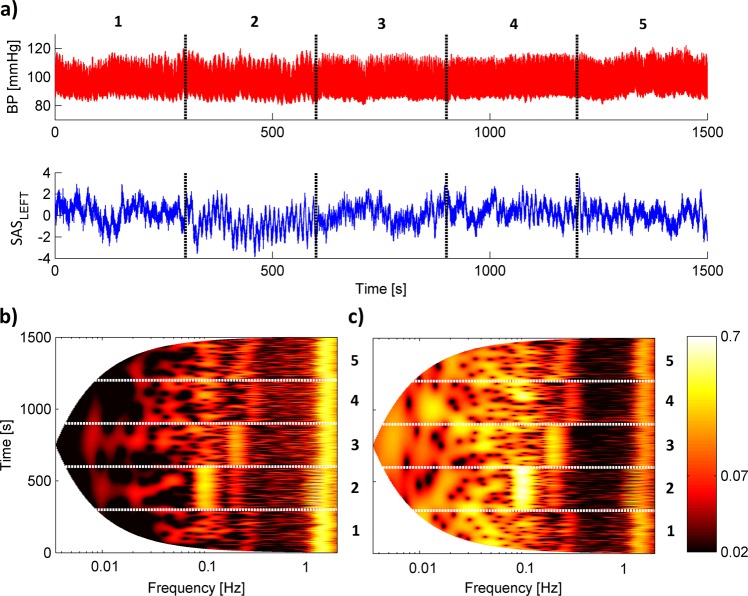
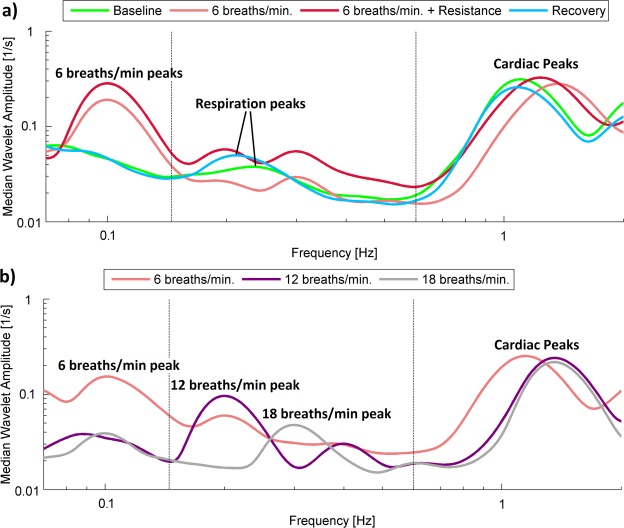
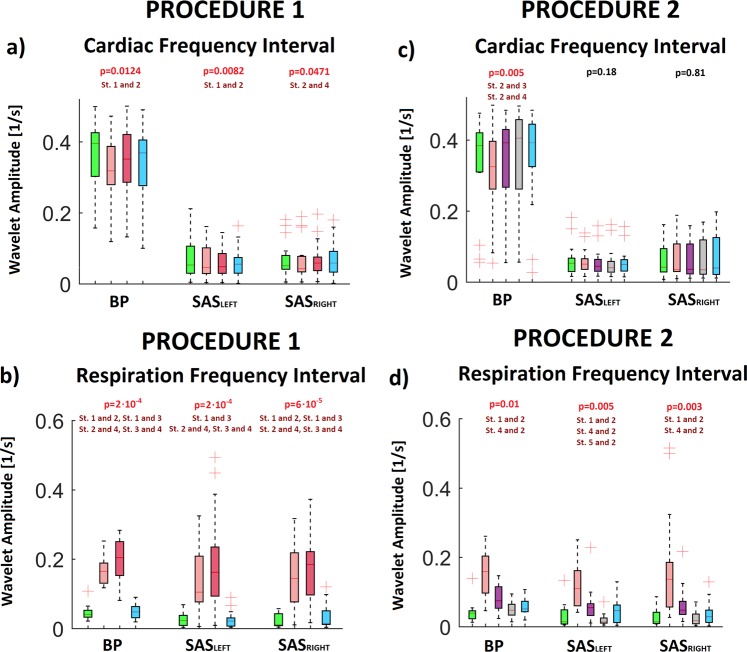
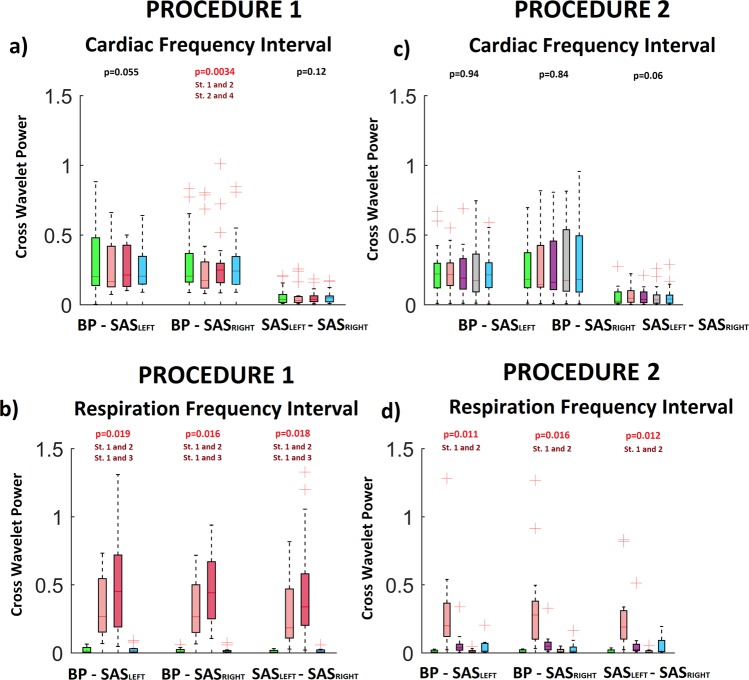
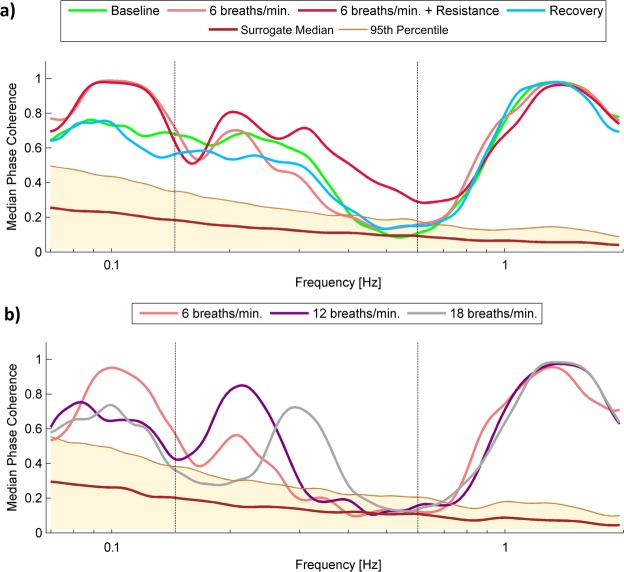
The aim of the study was to assess cardiac and respiratory blood pressure (BP) and subarachnoid space (SAS) width oscillations during the resting state for slow and fast breathing and breathing against inspiratory resistance. Experiments were performed on a group of 20 healthy volunteers (8 males and 12 females; age 25.3 ± 7.9 years; BMI = 22.1 ± 3.2 kg/m2). BP and heart rate (HR) were measured using continuous finger-pulse photoplethysmography. SAS signals were recorded using an SAS monitor. Oxyhaemoglobin saturation (SaO2) and end-tidal CO2 (EtCO2) were measured using a medical monitoring system. Procedure 1 consisted of breathing spontaneously and at controlled rates of 6 breaths/minute and 6 breaths/minute with inspiratory resistance for 10 minutes. Procedure 2 consisted of breathing spontaneously and at controlled rates of 6, 12 and 18 breaths/minute for 5 minutes. Wavelet analysis with the Morlet mother wavelet was applied for delineation of BP and SAS signals cardiac and respiratory components. Slow breathing diminishes amplitude of cardiac BP and SAS oscillations. The overall increase in BP and SAS oscillations during slow breathing is driven by the respiratory component. Drop in cardiac component of BP amplitude evoked by slow-breathing may be perceived as a cardiovascular protective mechanism to avoid target organ damage. Further studies are warranted to assess long-term effects of slow breathing.


Conflict of interest statement

Drs Andrzej F. Frydrychowski, Wojciech Guminski and Pawel J. Winklewski are stakeholders in NIRTI SA. Drs Jacek Wolf, and Krzysztof Narkiewicz received fees for lectures on sleep apnoea from ResMed.

Figures

Figure 1
Figure 1
(a) Simultaneous recordings of (top panel) blood pressure and (bottom panel) SAS width (left hemisphere) signals measured for one subject. (b,c) Wavelet transforms of the whole recording for (b) blood pressure and (c) SAS width signal. Four numbers correspond to different stages of procedure: (1) baseline spontaneous breathing, (2) breathing at controlled rates of 6 breaths/minute, (3) breathing at controlled rates of 6 breaths/minute with inspiratory resistance and (4) recovery spontaneous breathing.
Figure 2
Figure 2
(a) Simultaneous recordings of (top panel) blood pressure and (bottom panel) SAS width (left hemisphere) signals measured for one subject. (b,c) Wavelet transforms of the whole recording for (b) blood pressure and (c) SAS width signal. Five numbers correspond to different stages of procedure: (1) baseline spontaneous breathing, (3) breathing at controlled rates of 6 breaths/minute, (3) breathing at controlled rates of 12 breaths/minute, (4) breathing at controlled rates of 18 breaths/minute and (5) recovery spontaneous breathing.
Figure 3
Figure 3
(a,b) Median of the time-averaged wavelet transforms of blood pressure signals recorded in all subjects for (a) procedure 1 and (b) procedure 2. Various line colours correspond to different stages of procedure.
Figure 4
Figure 4
The results of the analysis for all collected signals: BP, SASLEFT and SASRIGHT. The a and c (b and d) panels correspond to the WT amplitudes from cardiac (respiration) frequency interval. The a and b (c,d) panels correspond to first (second) procedure. The values of “p” was estimated using Friedman test. Post hoc test comparison (Tukey test) was used to find differences between stages of procedure. Symbol “St.1 and 2” means that stages 1 differ significantly from stages 2.
Figure 5
Figure 5
(a) Cross Wavelet Power (CWP) of procedure 1 for one of the volunteer. Four numbers correspond to different stages of procedure (see Fig. 1). (b) Cross Wavelet Power of procedure 2 for one of the volunteer. Five numbers correspond to different stages of procedure (see Fig. 2). The CWP was estimated for BP and SASLEFT signals.
Figure 6
Figure 6
Median of the time-averaged CWP of BP and SASLEFT signals recorded in all subjects for (a) procedure 1 and (b) procedure 2. Various line colours correspond to different stages of procedure.
Figure 7
Figure 7
The results of the statistical analysis for CWP for all combinations between collected signals: BP - SASLEFT, BP - SASRIGHT and SASLEFT -SASRIGHT. The top (bottom) panels correspond to the CWP peaks from cardiac (respiration) frequency interval. The left (right) panels correspond to first (second) procedure. Various box colours correspond to different stages of procedure (see legend of Fig. 6).
Figure 8
Figure 8
(a,b) Median of the time-averaged WPCO of BP and SASLEFT signals recorded in all subjects for (a) procedure 1 and (b) procedure 2. Various line colours correspond to different stages of procedure.
Figure 9
Figure 9
The results of the statistical analysis for WPCO for all combinations between collected signals: BP - SASLEFT, BP - SASRIGHT and SASLEFT -SASRIGHT. The top (bottom) panels correspond to the WPCO peaks from cardiac (respiration) frequency interval. The left (right) panels correspond to first (second) procedure. Various box colours correspond to different stages of procedure (see legend of Fig. 7).

References

    1. Russo MA, Santarelli DM, O’Rourke D. The physiological effects of slow breathing in the healthy human. Breathe. 2012;13:298–309. doi: 10.1183/20734735.009817. - DOI - PMC - PubMed
    1. Brown RP, Gerbarg PL. Sudarshan Kriya yogic breathing in the treatment of stress, anxiety, and depression: part I-neurophysiologic model. J. Altern. Complement. Med. 2005;11:189–201. doi: 10.1089/acm.2005.11.189. - DOI - PubMed
    1. Jerath R, Edry JW, Barnes VA, Jerath V. Physiology of long pranayamic breathing: neural respiratory elements may provide a mechanism that explains how slow deep breathing shifts the autonomic nervous system. Med. Hypotheses. 2006;67:566–71. doi: 10.1016/j.mehy.2006.02.042. - DOI - PubMed
    1. Bernardi L, Gabutti A, Porta C, Spicuzza L. Slow breathing reduces chemoreflex response to hypoxia and hypercapnia, and increases baroreflex sensitivity. J. Hypertens. 2001;19:2221–9. doi: 10.1097/00004872-200112000-00016. - DOI - PubMed
    1. Joseph CN, et al. Slow breathing improves arterial baroreflex sensitivity and decreases blood pressure in essential hypertension. Hypertension. 2005;46:714–8. doi: 10.1161/01.HYP.0000179581.68566.7d. - DOI - PubMed

Publication types