. 2019 Apr;568(7752):336-343.
doi: 10.1038/s41586-019-1099-1. Epub 2019 Apr 17.

Restoration of brain circulation and cellular functions hours post-mortem

Affiliations

Restoration of brain circulation and cellular functions hours post-mortem

Zvonimir Vrselja et al. Nature. 2019 Apr.

Abstract

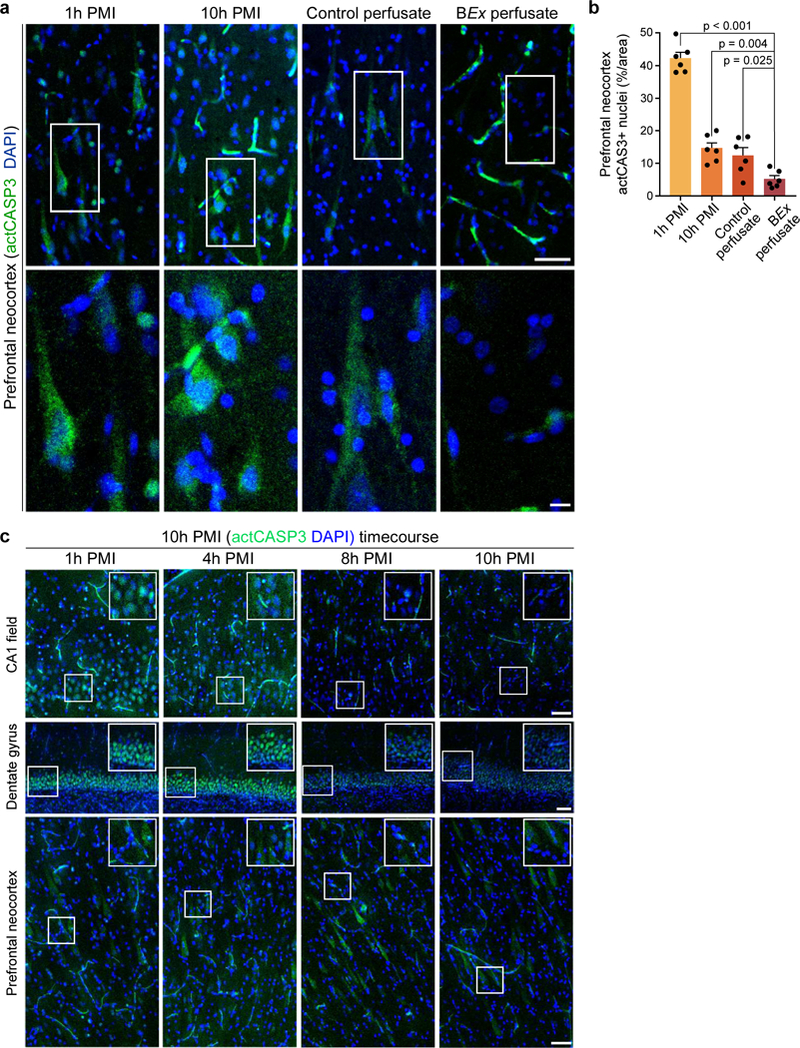
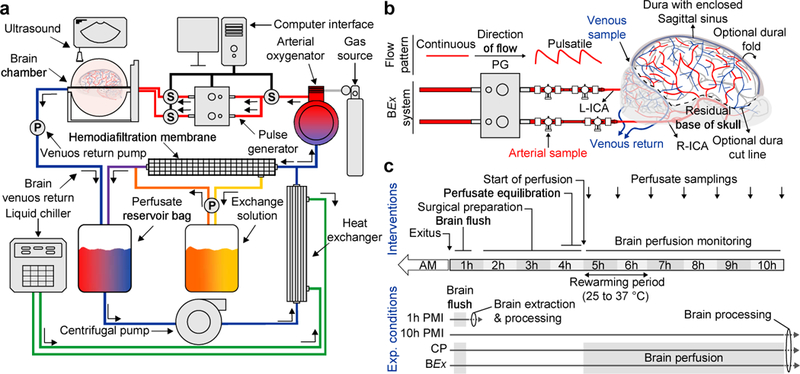
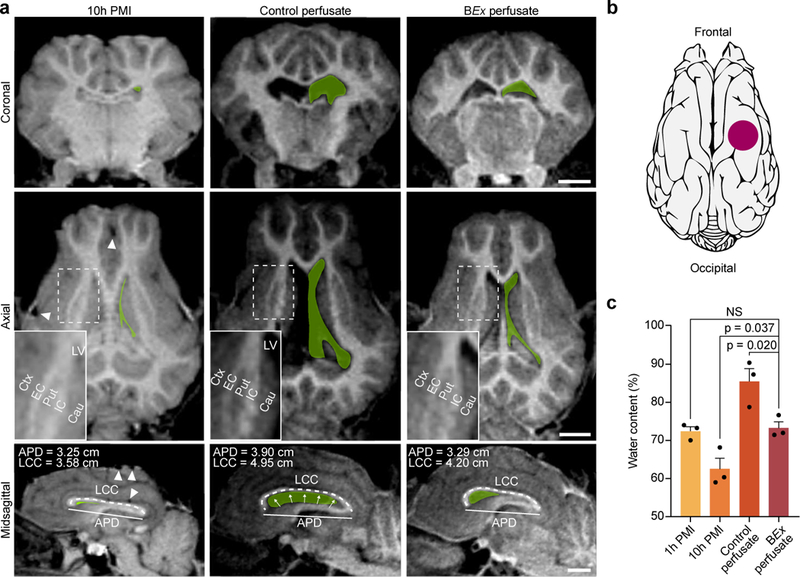
The brains of humans and other mammals are highly vulnerable to interruptions in blood flow and decreases in oxygen levels. Here we describe the restoration and maintenance of microcirculation and molecular and cellular functions of the intact pig brain under ex vivo normothermic conditions up to four hours post-mortem. We have developed an extracorporeal pulsatile-perfusion system and a haemoglobin-based, acellular, non-coagulative, echogenic, and cytoprotective perfusate that promotes recovery from anoxia, reduces reperfusion injury, prevents oedema, and metabolically supports the energy requirements of the brain. With this system, we observed preservation of cytoarchitecture; attenuation of cell death; and restoration of vascular dilatory and glial inflammatory responses, spontaneous synaptic activity, and active cerebral metabolism in the absence of global electrocorticographic activity. These findings demonstrate that under appropriate conditions the isolated, intact large mammalian brain possesses an underappreciated capacity for restoration of microcirculation and molecular and cellular activity after a prolonged post-mortem interval.


Conflict of interest statement

Competing Interests. All other authors declare no competing interests.

Figures

Extended Data Figure 1 |
Extended Data Figure 1 |. Detailed schematic of the perfusion circuit.
Complete blueprint of the perfusion circuitry and system. Individual components are listed on the right-hand column and in Supplementary Table 3.
Extended Data Figure 2 |
Extended Data Figure 2 |. Schematic representation of brain and vascular isolation procedure with connection to the perfusion system.
a, Diagram depicting the process for initially reducing the porcine skull after decapitation at the C3 vertebra. Dotted orange lines represent bone cuts through the naso-frontal suture, extending ventrally through the mandible (1); through the zygomatic process of the temporal bone and malar bone (2, 3); and, through the supraorbital process (4). Dotted maroon lines represent disarticulation of the temporomandibular and atlanto-occipital joints. Basilar artery (BA); vertebral artery (VA); occipital artery (OA); common carotid artery (CCA); external carotid artery (ECA); internal carotid artery (ICA); rete mirabile (RM); ophthalmic artery (OphA). Smaller vessels such as the ramus anastomoticus, arteria anastomotica, and variable branches originating from the ascending pharyngeal artery are not depicted. b, Arterial dissection, ligation, and removal of cranial soft tissue. To prevent vascular shunting, the VAs, BA, OAs, ECAs, and OphAs were ligated with sutures and/or cauterized along with the ramus anastomoticus, arteria anastomotica, and smaller branches originating from the ascending pharyngeal artery, while the ICAs were left patent. c, Neurocranial opening and reduction. Dark orange dots represent burr holes that are connected with dashed lines; orange shaded area represents area of the skull that is entirely removed at the end of the procedure. d, Mainly ex cranio whole brain connected to the BEx machine. e, Schematic representation of the components used for the connection of the porcine brain to the arterial ends of the BEx system.
Extended Data Figure 3 |
Extended Data Figure 3 |. Perfusion dynamics.
a, Traces of the waveform cycle (systole and diastole) from each of the 4 phases observed under control perfusate conditions. Each phase occurs in chronological order during the experimental timeline, revealing a progressive deterioration of the low-resistance pressure waveform structure. In each phase, there is a corresponding decrease in the relative mean flow velocity (MFV), culminating in negligible net forward flow (reverberated pattern) in Phase 4 (6h LOP). Phase 1 is defined by a normal, low-resistance waveform; phase 2 displayed an increase in PSV, narrowed systole, and decreased EDV; phase 3 demonstrates decreased PSV and loss of EDV; phase 4 exhibits a reverberated “no-flow” phenomenon. Intervening in Phase 3 with an increase in mean arterial pressure resulted in a transient increase in flow (red trace vs pink trace) that reverted back to negligible forward flow soon after in Phase 4 (red and blue trace vs pink and sky blue). PSV: Peak Systolic Velocity; EDV: End Diastolic Velocity. Traces are from a representative brain; the experiment was repeated in n=3 independent brains with similar results. b, Power waveform analysis from a representative control perfusate brain during Phase 3 with corresponding trace (right) evidencing a MFV of 3 cm/s. c, Power waveform analysis from a representative control perfusate brain at 6h LOP demonstrating Phase 4 dynamics with corresponding trace (right) depicting MFV of 0 cm/s. Contrastingly, power waveform analysis from a representative BEx perfusate brain taken at 6h LOP demonstrates that at this time point BEx perfusion exhibits Phase 1 dynamics. (b, c) Traces are from representative brains; the experiment was repeated in n=3 independent brains for each condition with similar results. d, Plot of resistance index (RI) during the course of experimentation in control and BEx perfusate conditions. RI was calculated via Doppler ultrasound measurement and utilizing the formula RI = (PSV-EDV) / PSV. Intervention period is included above control perfusate curve to delineate the time period in which mean arterial pressures were increased during control perfusate conditions. n=3 measurements taken from 3 independent brains per condition. e, Quantification of the RI at normothermia under control-perfusion and BEx perfusate conditions. Two-tailed unpaired t-test (t=5.638, df=28) for mean values obtained during normothermic conditions; n=15 collapsed measurements across n=3 brains per condition while the brains were at normothermia (hours 2–6). All data are means ± SEM.
Extended Data Figure 4 |
Extended Data Figure 4 |. Serial coronal sections of 3D renderings of micro-computed tomography angiogram.
Each inlet box depicts a maximum intensity projection of a 1cm coronal section at the plane indicated in the model (upper-left corner). Micro-computed tomography angiogram (CTA) demonstrates patency of major arterial vessels as well as arterioles (left). Corresponding gross anatomical structures along with arterial supply areas were traced and mapped onto each micro-CTA rendering (right). Legend provides abbreviations for anatomical structures and vascular vessels. Scale bar, 1 cm. Data are from a representative rendering; the experiment was repeated in n=3 independent brains with similar results.
Extended Data Figure 5 |
Extended Data Figure 5 |. Restoration and maintenance of microcirculation and capillary integrity.
a, 3D rendering of high-resolution specimen-CTA of the hippocampus of BEx-perfused brain revealing extensive vascular network (left). Scale bar, 1mm. Enlarged area (right) of the red box with three examples (numbered red lines) of pre-capillary arterioles of varying size. Scale bar, 50 μm. Relative scale of microcirculatory vessels with the corresponding vessel diameters measured in the far-right. 25 μm represents the technical limit of the high-resolution specimen-CTA. Image is from a representative brain; the experiment was repeated in n=3 independent brains with similar results b, Intravascular hemoglobin fluorescent in the CA1 field across all experimental conditions. In comparison to 1h PMI and control perfusate conditions, fluorescent signal is found in precapillary arterioles (arrowhead) and capillaries (arrow) of both 10h PMI controls and BEx perfusate, indicating that the BEx perfusate reperfuses cerebral microcirculation. Images are from a representative brain per condition; the experiment was repeated in n=3 independent brains per condition with similar results c, Representative capillary EM microphotographs from the hippocampal CA1 zone after BEx perfusion. Blood vessel lumen (bl) is filled with electron-dense material (*), which represents the hemoglobin-based BEx perfusate. Pericytes and endothelial cells (highlighted semitransparent green and blue, respectively) demonstrate normal ultrastructure and contain cell nuclei (N), mitochondria (m), and cisterns of rough endoplasmic reticulum (rer). Adherence junctions between endothelial cells (aj) are visible. Scale bar, 1μm. Image is from a representative capillary; a total of 54 capillaries were identified across n=3 independent brains. d, Quantification of examined capillaries that are filled with the BEx perfusate evidences that the vast majority of capillaries are patent and perfused. A total of 54 capillaries were examined across n=3 independent brains. All data are means ± SEM.
Extended Data Figure 6 |
Extended Data Figure 6 |. Restoration of microvascular reperfusion in the prefrontal neocortex.
a, Intravascular hemoglobin fluorescent signal in the prefrontal neocortex across all conditions. In comparison to 1h PMI and control perfusate conditions, the fluorescent signal is found in precapillary arterioles (arrowhead) and capillaries (arrow) of both 10h PMI controls and BEx perfusate. Images are from a representative brain per condition; the experiment was repeated in n=3 independent brains with similar results. b, Capillary EM microphotographs from the prefrontal neocortex after BEx perfusion. Blood vessel lumen (bl) is filled with electron-dense material, which represents the hemoglobin-based BEx perfusate. Image is from a representative capillary; a total of 41 capillaries were identified across n=3 independent brains. c, Quantification of the number of examined prefrontal neocortical capillaries filled with BEx perfusate. A total of 41 capillaries across n=3 independent brains were analyzed.
Extended Data Figure 7 |
Extended Data Figure 7 |. Microvascular reperfusion and cytoarchitectonics in the occipital neocortex and cerebellar cortex.
a, Micro-CT Angiography demonstrates patency of major arterial vessels as well as arterioles in both the occipital lobe as well as cerebellum. OL, occipital lobe; V, vermis; LC, lateral cortex; CP, choroid plexus; L, left; R, right. b, c, Intravascular hemoglobin fluorescent signal in the occipital neocortex and cerebellar cortex, respectively, demonstrating perfused precapillary arterioles (arrowhead) and capillaries (arrow) in both 10h PMI controls and BEx perfusion. Images are from a representative brain from each condition; experiments were repeated in n=3 independent brains per group. d, Nissl stains (top) with higher magnification of boxed area (below) of the occipital neocortex demonstrating preserved regional cytoarchitectonics as well as neuronal structure in BEx perfused brains. Pyramidal-shaped cell bodies as well as apical and basal dendrites are present in both 1h PMI and BEx perfused brains. An inverted pyramidal neuron structure is also appreciable under BEx perfusion (arrow). Scale bar, 350 μm (top), 100 μm (bottom). Images are from a representative brain from each condition; experiments were repeated in n=3 independent brains per group. e, Representative Nissl stains of the cerebellar cortex reveal preserved Purkinje cell structure in 1h PMI and BEx perfusion brains, when compared to 10h PMI and control perfusate conditions (arrows). Images are from a representative brain from each condition; experiments were repeated in n=3 independent brains per group.
Extended Data Figure 8 |
Extended Data Figure 8 |. Analysis of neuronal cell morphology and density in the neocortex.
a, Nissl stains (top) with higher magnification of boxed area (below) of the prefrontal neocortex demonstrating preserved neuronal structure and anatomical cytoarchitecture in BEx perfused brains. Scale bar, 350 μm (top), 100 μm (bottom). Images are from a representative brain from each condition; experiments were repeated in n=6 independent brains per group with similar results. b, Nissl stains of the primary motor cortex reveal preserved Betz cell (arrows) structure under BEx perfusion conditions, despite these cells having been axotomized following decapitation. Images are from a representative brain from each condition; experiments were repeated in n=3 independent brains per group with similar results. c, Confocal tile scans of immunohistochemical stains for the pan-neuronal marker RBFOX3 (NeuN; green) in the prefrontal neocortex. Scale bar, 50 μm. Images are from a representative brain from each condition; experiments were repeated in n=6 independent brains per group with similar results. d, Maximum intensity confocal projections of NeuN staining. Note that neurons exhibit a swollen morphology in 1h PMI, and significant cellular destruction in 10h PMI and control perfusate conditions (arrowheads), while neurons in the BEx perfusion condition display typical elongated morphology (arrows). Scale bar, 50 μm. Images are from a representative brain from each condition; experiments were repeated in n=6 independent brains per group with similar results. e, Maximum intensity projections of the excitatory neuron marker, Neurogranin (NRGN; green), show a preservation of typical morphology of cortical pyramidal neurons under BEx perfusion (arrows), with swollen morphology under 1h PMI conditions (arrow). There is evidence of clear cell destruction and the presence of enlarged vacuoles under 10h PMI and control perfusate conditions (arrowheads). Scale bar, 50 μm. Images are from a representative brain from each condition; experiments were repeated in n=6 independent brains per group with similar results. f, Maximum intensity projections of the inhibitory interneuron marker, GAD1 (red). In 10h PMI and control perfusate specimens, GAD1 staining reveals contracted cell bodies (arrows) with a loss of GAD1-positive somal contacts as compared to 1h PMI and BEx perfusion. Scale bar, 50 μm. Images are from a representative brain from each condition; experiments were repeated in n=6 independent brains per group with similar results. g, Quantification of the number of neuronal cells present in the prefrontal neocortex. Data is computed from Nissl stains. One-way ANOVA (P<0.001, F[3,20] = 224.6) with post-hoc Dunnett’s adjustment; n=6 brains per condition; NS, not significant. h, Quantification of the percentage of cells that exhibit a swollen, ellipsoid morphology. Data is analyzed from Nissl stains. One-way ANOVA (P<0.001, F[3,20] = 16.33) with post-hoc Dunnett’s adjustment; n=6 brains per group. All data are means ± SEM. i, j, Quantification of the total number of NRGN- and GAD1-positive cells, respectively, in the neocortex. One-way ANOVA (NRGN+: P=0.002, F[3,20] = 7.018; GAD1+: P<0.001, F[3,20] = 9.153) with post-hoc Dunnett’s adjustment. n=6 brains per group. All data are means ± SEM.
Extended Data Figure 9 |
Extended Data Figure 9 |. Ultrastructure of ependymal cells and hippocampal CA1 white matter.
a, Representative EM microphotographs of hippocampal ependymal cells. In 1h PMI controls, certain mitochondria display normal ultrastructure and electron-dense matrix (m), while others exhibit a more swollen morphology (yellow). Contrastingly, in 10h PMI conditions ependymal cells demonstrate lightened cytoplasm with numerous vacuoles (v) and swollen mitochondria (yellow). Although adherence junctions (aj) are preserved, the cell membrane is destroyed in several positions. Similarly, some moderately damaged, yet visibly intact, cells under control perfusate conditions make contact with entirely destroyed adjacent cells (pink), indicating a destruction of the continuum of the ependymal layer. However, ependymal cells from BEx-perfused brains, show ultrastructure characteristic of normal cells, such as continuity of the cell membrane that covers cilia (c) and produces filopodia (f), tight junctions between adjacent cells, and intact mitochondria with electron dense matrix. Boxed area (top) are enlarged in corresponding high-power image (below). b, In the hippocampal white matter of 1h PMI, 10h PMI, and control perfusate conditions, numerous cells contain segments of destroyed cytoplasm (pink), while oligodendrocytes have light cytoplasm with numerous vacuoles and swollen mitochondria (yellow); in 10h PMI samples, mitochondria may not be visible due to extensive destruction. In BEx perfusate conditions, oligodendrocytes demonstrate normal ultrastructure with numerous cisterns of rough endoplasmic reticulum (rer), and mitochondria have electron-dense matrix and many cristae. Overall myelinated axons (MA) exhibit similar morphology across all experimental groups. Boxed areas (top) are depicted in corresponding high-power images (below). N, cell nucleus. Scale bar, 1 μm. For both (a & b), images are from a representative brain from each condition; experiments were repeated in n=3 independent brains per group with similar results.
Extended Data Figure 10 |
Extended Data Figure 10 |. Dynamics of caspase 3 activation in the perfused and unperfused brain.
a, Confocal maximum intensity projection of immunofluorescent staining for the cleaved, activated form of the apoptotic execution protein, caspase 3 (actCASP3; green). (Bottom) Enlargement of the boxed area above. Scale bar, 50 μm (top); 10 μm (bottom). Images are from a representative brain from each condition; experiments were repeated in n=6 independent brains per group with similar results. b, Quantification of normalized actCASP3-positive nuclei. One-way ANOVA (P<0.001, F[3,20] = 82.3) with post-hoc Dunnett’s adjustment. n=6 brains per condition. All data are means ± SEM. c, Time-course analysis of activated caspase-3 localization in the unperfused brain at various post-mortem intervals in the CA1 field, dentate gyrus, and prefrontal neocortex. At 1h PMI there is robust nuclear localization of cleaved caspase-3 across all brain regions; however, this signal decreases with increased post-mortem intervals. Images are from representative brains for each brain region; experiments were repeated in n=3 independent brains per group with similar results.
Extended Data Figure 11 |
Extended Data Figure 11 |. Orientation and fiber bundle density of myelinated neocortical axons.
a, Immunohistochemical staining for myelin basic protein (MBP) in the prefrontal neocortex (top) with high-magnification images depicting fiber orientation and bundles (bottom). Scale bar, 100 μm (top); 50 μm (bottom). Images are from a representative brain from each condition; experiments were repeated in n=6 independent brains per group with similar results. b, Analysis of individual axonal angles in relation to the pial surface across all experimental conditions. BEx and 10h PMI conditions demonstrate an increase in number of axons orthogonally oriented to the pial surface, while 1h PMI and control perfusate specimens exhibit an increase in axons oriented in more acute angles. Pairwise comparisons by two-tailed Chi-square analysis with Yates correction with df=1 and n=786 axons were analyzed per pairwise comparison; P-values specified within; n=3 brains per condition. BEx vs. 1H - χ2=6.403 for 0–30°, χ2=4.341 for 30–60°, χ2=18.09 for 60–90°; BEx vs. CP - χ2=4.341 for 30–60°, χ2=11.39 for 60–90°; NS, not significant. c, Quantification of the density of myelinated fiber bundles across experimental conditions. One-way ANOVA (P<0.001, F[3,20] = 10.78) with post-hoc Dunnett’s adjustment; P-values specified within; n=6 animals per group. All data are means ± SEM.
Extended Data Figure 12 |
Extended Data Figure 12 |. Glial cell structure in the hippocampus.
a, b, Confocal maximum intensity projections of immunohistochemical stains for astrocytes (GFAP; red) and microglia (IBA-1; green) with DAPI (blue) counterstain in the CA1 and Dentate gyrus regions of the hippocampus evidences preservation of glial cell structure under BEx perfusion conditions. As compared to 1h PMI controls, microglia display a more phagocytic morphology with shortened cellular processes. Scale bar, 50 μm. Images are from a representative brain from each condition; experiments were repeated in n=3 independent brains per group with similar results.
Figure 1 |
Figure 1 |. BEx perfusion system and experimental workflow.
a, Simplified schematic of the closed-circuit perfusion system. S, Sensor; P, Pump. b, Connection of the porcine brain to the perfusion system via the arterial lines. The pulse generator transforms continuous flow to pulsatile perfusion. Ports for arteriovenous sampling are delineated. In this preparation, the dura can be carefully cut and flapped medially to access brain for experimentation; surgical care is taken to ensure cortical bridging veins remain intact. Right (R)- and left (L)-internal carotid arteries (ICA); PG, Pulse Generator. c, Schematic depicting the experimental workflow and conditions. AM, ante-mortem.
Figure 2 |
Figure 2 |. Ex vivo restoration of microcirculation and vascular dilatory functionality.
a-c, Composite Doppler ultrasound demonstrating perfusion of large cerebral arteries: ICA, Internal Carotid Artery; PCoA, Posterior Communicating Artery; ACA, Anterior Cerebral Artery; PA, Pericallosal Artery; MCA, Middle Cerebral Artery; PCA, Posterior Cerebral Artery; BA, Basilar Artery. d, Power waveform analysis of the PA. PSV, Peak Systolic Velocity; EDV, End Diastolic Velocity; RI, Resistance Index. Data are from the representative brain in (a-c). e, Gross anatomical inspection of the cortical vessels before central vein compression (precompression; arrow) and swift venous refilling (arrowhead) after release. f-h, Maximum intensity projections of global computed tomography angiography in BEx conditions. Scale bar, 1 cm. i, Color Doppler analysis demonstrating flow increase in PA after administration of nimodipine (0.3 mg). j, Quantification of relative percentage flow change pre- and post-nimodipine administration from brains in (i). Ratio paired t-test; (*P=0.034); t=5.275; df=2. n=3 independently run brains. Data are means ± SEM. Reproducibility information is found in Methods.
Figure 3 |
Figure 3 |. Magnetic resonance imaging of brains.
a, T1-weighted MRI scans of perfused and unperfused porcine brains. In all three planes, the contours of the lateral ventricles (LV) are traced in green. Arrowheads indicate drop-out signals due to gas accumulation. Insets depict subcortical anatomical landmarks as well as gray-white matter contrast. Length of Corpus Callosum (LCC) and Anterior-Posterior Diameter (APD) are measured as proxies for brain swelling and ventricular morphology. Cau, caudate; Ctx, cerebral cortex; EC, external capsule; IC, internal capsule; Put, putamen. Scale bar, 1 cm. b, Schematic representing the location of tissue sampling for wet-to-dry mass analysis. c, Quantification of tissue water content across experimental groups. One-way ANOVA (P=0.001, F[3,8]=14.55) with post-hoc Dunnett’s adjustment; n=3 brains per condition; All data are means ± SEM. Reproducibility information is found in Methods.
Figure 4 |
Figure 4 |. Analysis of neuronal cell morphology, density, and caspase 3 activation.
a, Hippocampal Nissl stains depicting regional cytoarchitectural integrity. Insets display an example of a vessel filled with BEx perfusate, as compared to control perfusate conditions. b, Representative fields of view (left), with a higher magnification field (right) corresponding to the boxed area of the CA1 and dentate gyrus regions. Scale: 200 μm (left), 50 μm (right). c, d, Quantification of neuronal cell density in both the CA1 and dentate gyrus. One-way ANOVA (CA1 P<0.001, F[3,20] = 65.03; Dentate gyrus P<0.001, F[3,20] = 49.7) with post-hoc Dunnett’s adjustment; P-values specified within; n=6 brains per condition. e, Quantification of the percentage of cells that exhibit swollen morphology in the CA1 region. One-way ANOVA (P<0.001, F[3,20] = 113.6) with post-hoc Dunnett’s adjustment; P-values specified within; n=6 brains per condition. f, Confocal images of immunofluorescent staining for the pan-neuronal marker NeuN (green) and activated caspase 3 (actCASP3; green) with DAPI counterstain (blue), in the CA1 field (left) and dentate gyrus (right). For actCASP3 images, the right image depicts an enlargement of the boxed area. Scale bar, 50 μm (NeuN DAPI), 50 μm (actCASP3 DAPI; left), 10 μm (actCASP3 DAPI; right). g, h, Normalized quantification of the percentage of actCASP3 positive nuclei in the CA1 and dentate gyrus. CA1: One-way ANOVA (P<0.001, F[3,20] = 117.1) with post-hoc Dunnett’s adjustment; P-values specified within; n=6 brains per condition. Dentate gyrus: One-way ANOVA (P<0.001, F[3,20] = 31.19) with post-hoc Dunnett’s adjustment; P-values specified within; n=6 brains per condition. All data are means ± SEM. Reproducibility information is found in Methods.
Figure 5 |
Figure 5 |. Analysis of glial cells and inflammatory response.
a, Confocal tile scans of immunofluorescent stains for astrocytes (GFAP; red) and microglia (IBA1; green) in the prefrontal neocortex. L1, layer 1; L2–6, layers 2–6; WM, white matter. Scale bar: 200 μm. b, Confocal maximum intensity projections of GFAP- and IBA1-positive cells. Scale bar: 50 μm. c, d, Quantification of IBA1+ and GFAP+ cell density, respectively. One-way ANOVA (IBA1+; P<0.001, F[3,20]=38.77; GFAP+; P<0.001, F[3,20]=28.09) with post-hoc Dunnett’s adjustment. P-values are specified within; n=6 brains per group. e, Schematic representing the location of LPS injection. f, Multiplex inflammatory cyto/chemokine profile analysis in the prefrontal neocortex following intracortical LPS injection. One-way ANOVA (IL-8 P=0.016, F[2,6]=8.793; IL-6 P=0.013, F[2,6]=9.709; IL-1β P=0.015, F[2,6]=9.312) with post-hoc Dunnett’s adjustment; P-values are specified within. Kruskal-Wallis (IL-1α P=0.036; KW = 6.563) with post-hoc two-stage step-up method of Benjamini, Krieger, and Yekutieli; P-values are specified within; n=3 brains per group. All data are means ± SEM. Reproducibility information is found in Methods.
Figure 6 |
Figure 6 |. Analysis of neurons and global cerebral metabolism.
a, EM microphotographs of the synapses within stratum oriens of the hippocampal CA1 field. Arrows represent the post-synaptic density while orange shading depicts the presynaptic terminal. Scale bar, 1μm. b, Quantification of the number of synaptic vesicles present in presynaptic terminal. One-way ANOVA (P<0.001, F[3,8]=27.13) with post-hoc Dunnett’s adjustment, P-values specified within; each data point is a mean of n=9 synapses per brain; 3 brains per condition; NS, not significant. All data are means ± SEM. c-e, Electrophysiological properties of pyramidal neurons following 6h LOP with BEx perfusate after 4h LPP. c, Representative sub- and supra-threshold voltage traces in response to hyperpolarizing and depolarizing rectangular pulses of current from a resting potential of −70 mV. Stimulus size is indicated on the left. d, Family of inward and outward currents mediated by voltage-dependent sodium and potassium channels. e, Representative traces of spontaneous excitatory postsynaptic currents (sEPSCs) recorded at a holding potential of −70mV. f, Electrocorticograph (ECoG) recording traces of BEx-perfused brain, representative isoelectric signals presented from the designated surface electrodes are displayed to the right. g, Arteriovenous gradients and cerebral rate of oxygen consumption from BEx-perfused brains. n=4 brains; n=4 paired measurements per time-point per arterial and venous sample. Two-tailed paired t-test with df=3 for each time point; *P<0.05, **P<0.01, ***P<0.001. CMRO, One-way ANOVA (P=0.014, F[2,9]=7.185) with post-hoc Dunnett’s adjustment. *P=0.008. All data are means ± SEM. Further statistics and reproducibility information are found in Methods.

Comment in

References

    1. Kety SS Circulation and metabolism of the human brain. Brain Res Bull 50, 415–416 (1999). - PubMed
    1. Sokoloff L. Energetics of functional activation in neural tissues. Neurochem Res 24, 321–329 (1999). - PubMed
    1. Kisler K., Nelson AR, Montagne A. & Zlokovic BV Cerebral blood flow regulation and neurovascular dysfunction in Alzheimer disease. Nat Rev Neurosci 18, 419–434, doi:10.1038/nrn.2017.48 (2017). - DOI - PMC - PubMed
    1. Wagner S. R. t. & Lanier WL Metabolism of glucose, glycogen, and high-energy phosphates during complete cerebral ischemia. A comparison of normoglycemic, chronically hyperglycemic diabetic, and acutely hyperglycemic nondiabetic rats. Anesthesiology 81, 1516–1526 (1994). - PubMed
    1. Hoxworth JM, Xu K., Zhou Y., Lust WD & LaManna JC Cerebral metabolic profile, selective neuron loss, and survival of acute and chronic hyperglycemic rats following cardiac arrest and resuscitation. Brain Res 821, 467–479 (1999). - PubMed

Supplemental Discussion References

    1. Gilboe DD, Cotanch WW & Glover MB Extracorporeal Perfusion of the Isolated Head of a Dog. Nature 202, 399–400 (1964). - PubMed
    1. White RJ, Albin MS & Verdura J. Preservation of Viability in the Isolated Monkey Brain Utilizing a Mechanical Extracorporeal Circulation. Nature 202, 1082–1083 (1964). - PubMed
    1. von Bohlen und Halbach O. The isolated mammalian brain: an in vivo preparation suitable for pathway tracing. Eur J Neurosci 11, 1096–1100 (1999). - PubMed
    1. Muhlethaler M., de Curtis M., Walton K. & Llinas R. The isolated and perfused brain of the guinea-pig in vitro. Eur J Neurosci 5, 915–926 (1993). - PubMed
    1. de Curtis M., Pare D. & Llinas RR The electrophysiology of the olfactory-hippocampal circuit in the isolated and perfused adult mammalian brain in vitro. Hippocampus 1, 341–354, doi:10.1002/hipo.450010402 (1991). - DOI - PubMed

MeSH terms