Label-free target identification reveals oxidative DNA damage as the mechanism of a selective cytotoxic agent
- PMID: 30996934
- PMCID: PMC6438152
- DOI: 10.1039/c8sc05465g
Label-free target identification reveals oxidative DNA damage as the mechanism of a selective cytotoxic agent
Abstract
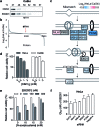
Phenotypic screening can not only identify promising first-in-class drug candidates, but can also reveal potential therapeutic targets or neomorphic functions of known proteins. In this study, we identified target proteins of SB2001, a cytotoxic agent that acts specifically against HeLa human cervical cancer cells. Because SB2001 lacks chemical modification sites, label-free target identification methods including thermal stability shift-based fluorescence difference in two-dimensional gel electrophoresis (TS-FITGE) and thermal proteome profiling (TPP) were applied to characterize its mechanism of action. Owing to their differences, the two label-free target identification methods uncovered complementary target candidates. Candidates from both methods were prioritized according to their selective lethality upon the knockdown of those genes in HeLa cells, compared to CaSki cells which were used as a negative control cell line from the human cervix. LTA4H was identified only by TS-FITGE, but not by TPP, because only one isoform was stabilized by SB2001. Furthermore, it was implied that a non-canonical function of LTA4H was involved in the SB2001 activity. MTH1 was identified by both TS-FITGE and TPP, and SB2001 inhibited the function of MTH1 in hydrolyzing oxidized nucleotides. Compared to CaSki cells, HeLa cells displayed downregulated DNA mismatch repair pathways, which made HeLa cells more susceptible to the oxidative stress caused by SB2001, resulting in increased 8-oxoG concentrations, DNA damage, and subsequent cell death.
Figures


Similar articles
-
Targeting human MutT homolog 1 (MTH1) for cancer eradication: current progress and perspectives.Acta Pharm Sin B. 2020 Dec;10(12):2259-2271. doi: 10.1016/j.apsb.2020.02.012. Epub 2020 Mar 30. Acta Pharm Sin B. 2020. PMID: 33354500 Free PMC article. Review.
-
CETSA and thermal proteome profiling strategies for target identification and drug discovery of natural products.Phytomedicine. 2023 Jul 25;116:154862. doi: 10.1016/j.phymed.2023.154862. Epub 2023 May 20. Phytomedicine. 2023. PMID: 37216761 Review.
-
Label-free target identification using in-gel fluorescence difference via thermal stability shift.Chem Sci. 2017 Feb 1;8(2):1127-1133. doi: 10.1039/c6sc03238a. Epub 2016 Sep 22. Chem Sci. 2017. PMID: 28451252 Free PMC article.
-
Phenotype-based discovery of a HeLa-specific cytotoxic molecule that downregulates HPV-mediated signaling pathways via oxidative damage.Org Biomol Chem. 2019 Aug 7;17(31):7388-7397. doi: 10.1039/c9ob01341e. Org Biomol Chem. 2019. PMID: 31342041
-
Callyspongiolide kills cells by inducing mitochondrial dysfunction via cellular iron depletion.Commun Biol. 2021 Sep 23;4(1):1123. doi: 10.1038/s42003-021-02643-8. Commun Biol. 2021. PMID: 34556786 Free PMC article.
Cited by
-
Construction of a self-directed replication system for label-free and real-time sensing of repair glycosylases with zero background.Chem Sci. 2019 Nov 26;11(2):587-595. doi: 10.1039/c9sc04738g. eCollection 2020 Jan 14. Chem Sci. 2019. PMID: 32206275 Free PMC article.
-
Targeting human MutT homolog 1 (MTH1) for cancer eradication: current progress and perspectives.Acta Pharm Sin B. 2020 Dec;10(12):2259-2271. doi: 10.1016/j.apsb.2020.02.012. Epub 2020 Mar 30. Acta Pharm Sin B. 2020. PMID: 33354500 Free PMC article. Review.
-
Redox regulation: mechanisms, biology and therapeutic targets in diseases.Signal Transduct Target Ther. 2025 Mar 7;10(1):72. doi: 10.1038/s41392-024-02095-6. Signal Transduct Target Ther. 2025. PMID: 40050273 Free PMC article. Review.
-
Inflachromene ameliorates Parkinson's disease by targeting Nrf2-binding Keap1.Chem Sci. 2024 Feb 2;15(10):3588-3595. doi: 10.1039/d3sc06997d. eCollection 2024 Mar 6. Chem Sci. 2024. PMID: 38455026 Free PMC article.
-
Targeting the nucleic acid oxidative damage repair enzyme MTH1: a promising therapeutic option.Front Cell Dev Biol. 2024 Jan 31;12:1334417. doi: 10.3389/fcell.2024.1334417. eCollection 2024. Front Cell Dev Biol. 2024. PMID: 38357002 Free PMC article. Review.
References
-
- Swinney D. C., Anthony J. Nat. Rev. Drug Discovery. 2011;10:507–519. - PubMed
-
- Wagner B. K. Expert Opin. Drug Discovery. 2016;11:121–125. - PubMed
-
- Moffat J. G., Vincent F., Lee J. A., Eder J., Prunotto M. Nat. Rev. Drug Discovery. 2017;16:531–543. - PubMed
-
- Ito T., Ando H., Suzuki T., Ogura T., Hotta K., Imamura Y., Yamaguchi Y., Handa H. Science. 2010;327:1345–1350. - PubMed
LinkOut - more resources
Full Text Sources
Molecular Biology Databases
Miscellaneous

