. 2019 Feb 14;10(12):3654-3670.
doi: 10.1039/c8sc05593a. eCollection 2019 Mar 28.

Ultraspecific live imaging of the dynamics of zebrafish neutrophil granules by a histopermeable fluorogenic benzochalcone probe

Affiliations

Ultraspecific live imaging of the dynamics of zebrafish neutrophil granules by a histopermeable fluorogenic benzochalcone probe

Emma Colucci-Guyon et al. Chem Sci. .

Abstract

Neutrophil granules (NGs) are key components of the innate immune response and mark the development of neutrophilic granulocytes in mammals. However, there has been no specific fluorescent vital stain up to now to monitor their dynamics within a whole live organism. We rationally designed a benzochalcone fluorescent probe (HAB) featuring high tissue permeability and optimal photophysics such as elevated quantum yield, pronounced solvatochromism and target-induced fluorogenesis. Phenotypic screening identified HAB as the first cell- and organelle-specific small-molecule fluorescent tracer of NGs in live zebrafish larvae, with no labeling of other cell types or organelles. HAB staining was independent of the state of neutrophil activation, labeling NGs of both resting and phagocytically active neutrophils with equal specificity. By high-resolution live imaging, we documented the dynamics of HAB-stained NGs during phagocytosis. Upon zymosan injection, labeled NGs were rapidly recruited to the forming phagosomes. Despite being a reversible ligand, HAB could not be displaced by high concentrations of pharmacologically relevant competing chalcones, indicating that this specific labeling was the result of the HAB's precise physicochemical signature rather than a general feature of chalcones. However, one of the competitors was discovered as a promising interstitial fluorescent tracer illuminating zebrafish histology, similarly to BODIPY-ceramide. As a yellow-emitting histopermeable vital stain, HAB functionally and spectrally complements most genetically incorporated fluorescent tags commonly used in live zebrafish biology, holding promise for the study of neutrophil-dependent responses relevant to human physiopathology such as developmental defects, inflammation and infection. Furthermore, HAB intensely labeled isolated live human neutrophils at the level of granulated subcellular structures consistent with human NGs, suggesting that the labeling of NGs by HAB is not restricted to the zebrafish model but also relevant to mammalian systems.


Figures
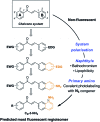
Fig. 1
Fig. 1. Stepwise design of a minimal cytopermeable chalcone fluorophore (EWG, electron withdrawing group; EDG, electron donating group; R, any substituent).
Fig. 2
Fig. 2. Synthesis of representative compounds in the 3-aminobenzochalcone, 5-aminobenzochalcone and 2-aminochalcone series and SFRs in the 3-aminobenzochalcone series. (A) Reagents and conditions: (a) HNO3 (40 equiv.), H2SO4 (1.5 equiv.), AcOH, r. t., 13% 2; (b) substituted acetophenone (1 equiv.), NaOH (0.75–2 equiv.), EtOH, r. t.; (c) SnCl2 (5–10 equiv.) or cat. Pd–C (10%), H2, AcOH, r. t., 38% 3, 31% 4, 26% 5, 37% 6, 18% 7, 69% 8; (d) HNO3 (1.25 equiv.), Ac2O, r. t., 11% 10; (e) SeO2 (2 equiv.), neat, 150 °C, 28% 11 (45% based on conversion); (f) 4-hydroxyacetophenone (1 equiv.), NaOH (2 equiv.), EtOH, r. t.; (g) Fe (10 equiv.), AcOH, reflux, 56% 12; (h) acetophenone (1 equiv.), NaOH (0.75 equiv.), EtOH, r. t.; (i) Pd–C (10%), H2, AcOH, r. t., 12% 14 (yields of chalcones indicated for two-step, “one-pot” reactions). See ESI for all synthetic procedures. (B) Semi-quantitative emission spectra of 3-aminobenzochalcones 3–8 (50 μM) in toluene at 20 °C.
Fig. 3
Fig. 3. SFRs and log D7.4 values at 20 °C in the 3-aminobenzochalcone, 5-aminobenzochalcone and 2-aminochalcone series (colours indicative of fluorescence emissions).
Fig. 4
Fig. 4. HAB shows strong solvatochromism and protein-dependent fluorogenesis. (a and b) Semi-quantitative emission spectra of 3-aminobenzochalcone 6 (a) and HAB (b) in various solvents (50 μM). (A) H2O; (B) Tris buffer 10 mM, pH 7, NaCl 100 mM, MgCl2 5 mM; (C) AcOH; (D) DMSO; (E) MeCN; (H) CHCl3; (I) AcOEt; (J) 1,4-dioxane; (K) benzene; (L) toluene. Dissimilar solvent lettering between the figures is (F) n-hexane; (G) n-octane (a) and (F) n-butanol; (G) n-heptanol (b). (c and d) Normalized excitation spectra (purple lines) and fluorescence emission spectra (blue or orange lines) of HAB (50 μM) in TRIS buffer pH 7.0 (Tris·HCl 10 mM, NaCl 100 mM, MgCl2 5 mM) (c) or DMF (d). (e) Fluorescence emission spectra of HAB (50 μM) titrated with BSA (0 to 1 mg mL–1) in TRIS buffer with an excitation wavelength of 360 nm. (f) Fluorescence emission spectra of HAB (50 μM) titrated with BSA (1 to 10 mg mL–1) in TRIS buffer with an excitation wavelength of 420 nm. Arrows indicate the decrease or increase in fluorescence following the addition of BSA. UVA-irradiated cuvettes in the corresponding conditions are shown as insets in (c), (d) and (f).
Fig. 5
Fig. 5. HAB labels specific cells in live zebrafish from 32 hpf. Confocal fluorescence imaging of HAB labeling (10 μM) in live wild-type zebrafish embryos (32 and 48 hpf) and swimming larvae (72 hpf) following excitation at 488 nm and detection in the 550–650 nm range. The yellow-orange color is indicative of the fluorescence seen with the naked eye. Maximum intensity Z-projection images (2 μm serial optical sections) are shown. Arrows point to the HAB label; asterisks mark pigment cells. A, artery; N, notochord; V, vein.
Fig. 6
Fig. 6. HAB labels zebrafish neutrophil granules. (a–l) Confocal fluorescence imaging of HAB (10 μM) in live transgenic 72 hpf zebrafish larvae following excitation at 448 nm under equilibrium conditions. Detection parameters were as follows: for HAB/mCherry: λex 448 nm, λem 550–650 nm, mCherry: λex 552 nm, λem 660–750 nm using sequential modes of acquisition. For GFP/HAB: GFP λex 448 nm, λem 500–520 nm, HAB: λex 448 nm, λem 550–650 nm using sequential modes of acquisition. Maximum intensity Z-projection images (2 μm serial optical sections) are shown. (m–p) High-resolution DIC and confocal fluorescence imaging of HAB (10 μM) in live 72 hpf zebrafish larvae harbouring red neutrophils. Arrows point to HAB-labeled granules according to the DIC images in neutrophils. A single 0.4 μm optical section is shown. Boxes in (c), (g) and (k) indicate the regions magnified in the insets (d), (h) and (l) respectively. Abbreviations used: A (aorta); N (notochord); V (vein); asterisk = nucleus. See ESI for Videos S5 and S6 related to (m–p).
Fig. 7
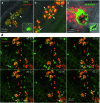
Fig. 7. HAB reveals the dynamics of neutrophil granules upon phagocytosis of zymosan particles in live zebrafish. (a and b) Confocal live imaging of HAB-labeled neutrophil granules upon phagocytosis of subcutaneously injected zymosan in a live 72 hpf zebrafish larva under diffusion conditions. HAB is recruited to the forming phagosomes (arrows). Inset: HAB labeling of a resting neutrophil. (c) Sudan Black (SB) staining of myeloperoxidase-containing neutrophil granules showing granule recruitment to the phagosome upon zymosan phagocytosis in fixed zebrafish larvae. Inset: SB staining of a resting neutrophil; a single 1 μm optical section is shown. (d) Frames extracted from an in vivo time-lapse confocal imaging sequence (time step = 1 min). Arrows point to HAB-labeled neutrophil granules that are recruited to the nascent zymosan containing phagosome. Three neutrophils (pointed with number 1 to 3) were tracked during the time lapse sequence. Maximum intensity Z-projection (1 μm serial optical sections). See ESI for Video S8 related to (d).
Fig. 8
Fig. 8. HAB does not target zebrafish neutrophil myeloperoxidase, and its binding to neutrophil granules is not a general feature of chalcones. (a and c) Merged confocal fluorescence and bright-field imaging of HAB (10 μM) in live wild-type (a) or “Spotless” (NL 144_01 mutant: null mpx allele) (c) 72 hpf zebrafish larvae following excitation at 488 nm and detection in the 550–650 nm range under diffusion conditions. (b and d) SB staining of myeloperoxidase-containing neutrophil granules in bright-field imaging. (e–j) Merged confocal fluorescence and bright-field imaging of HAB (10 μM) in live wild-type 72 hpf zebrafish larvae co-treated with chalcones 15, 16 (flavokawain A), 17 (cardamonin), 18 or 19 (100 μM) following excitation at 488 nm and detection in the 550–650 nm range under diffusion conditions. The yellow-orange color is indicative of the fluorescence seen with the naked eye. Single 2 μm optical sections are shown. Abbreviations used: A (aorta); N (notochord); UGO (urogenital opening); V (vein).
Fig. 9
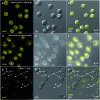
Fig. 9. HAB selectively labels live human primary neutrophils over other blood cell types. (a–c and d–f) confocal fluorescence and DIC imaging of HAB (10 μM) in live human neutrophils following excitation at 448 nm and detection in the 550–650 nm range. Single 0.4 μm optical sections are shown. (a–c) show resting, non-activated, non-adherent neutrophils. (d–f) show activated, adherent neutrophils: note HAB staining of neutrophils granules (g–i): confocal fluorescence and DIC imaging of HAB (10 μM) in live human lymphocytes (lc), erythrocytes (ec), monocytes (mc) and thrombocytes (tc) using the same settings as in (a–c) and (d–f). Single 0.4 μm optical sections are shown. The yellow-orange color is indicative of the fluorescence seen with the naked eye. Asterisk = nucleus.

Similar articles

Cited by

References

    1. Masud S., Torraca V., Meijer A. H. Curr. Top. Dev. Biol. 2017;124:277–329. - PubMed
    1. Lieschke G. J., Oates A. C., Crowhurst M. O., Ward A. C., Layton J. E. Blood. 2001;98:3087–3096. - PubMed
    1. Traver D., Herbomel P., Patton E. E., Murphey R. D., Yoder J. A., Litman G. W., Catic A., Amemiya C. T., Zon L. I., Trede N. S. Adv. Immunol. 2003;81:253–330. - PubMed
    1. Herbomel P., Thisse B., Thisse C. Development. 1999;126:3735–3745. - PubMed
    1. Le Guyader D., Redd M. J., Colucci-Guyon E., Murayama E., Kissa K., Briolat V., Mordelet E., Zapata A., Shinomiya H., Herbomel P. Blood. 2008;111:132–141. - PubMed