. 2019 Jun;23(6):3808-3823.
doi: 10.1111/jcmm.14071. Epub 2019 Apr 17.

LncRNA KCNQ1OT1 enhanced the methotrexate resistance of colorectal cancer cells by regulating miR-760/PPP1R1B via the cAMP signalling pathway

Affiliations

LncRNA KCNQ1OT1 enhanced the methotrexate resistance of colorectal cancer cells by regulating miR-760/PPP1R1B via the cAMP signalling pathway

Di Xian et al. J Cell Mol Med. 2019 Jun.

Abstract

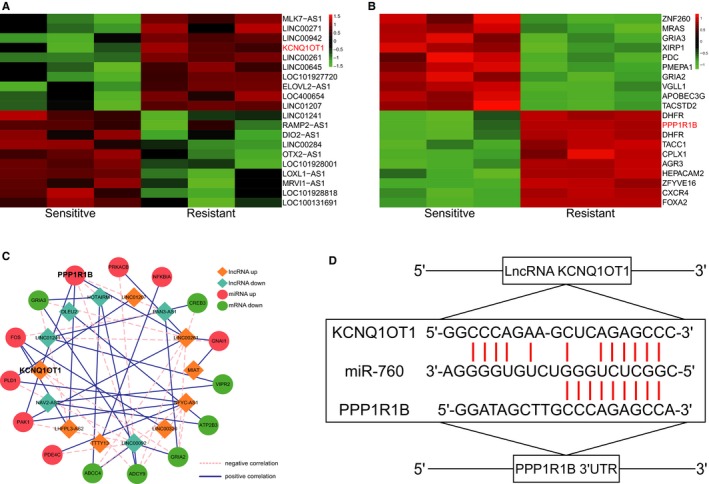
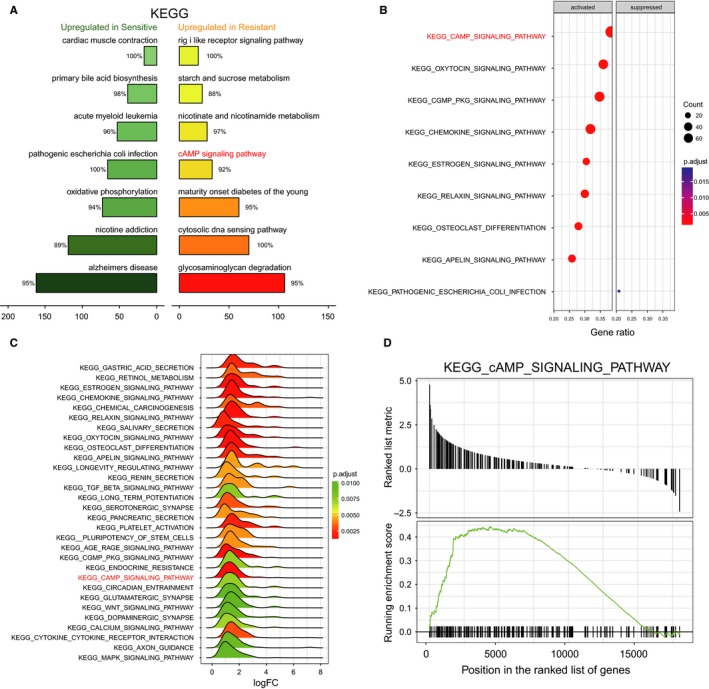
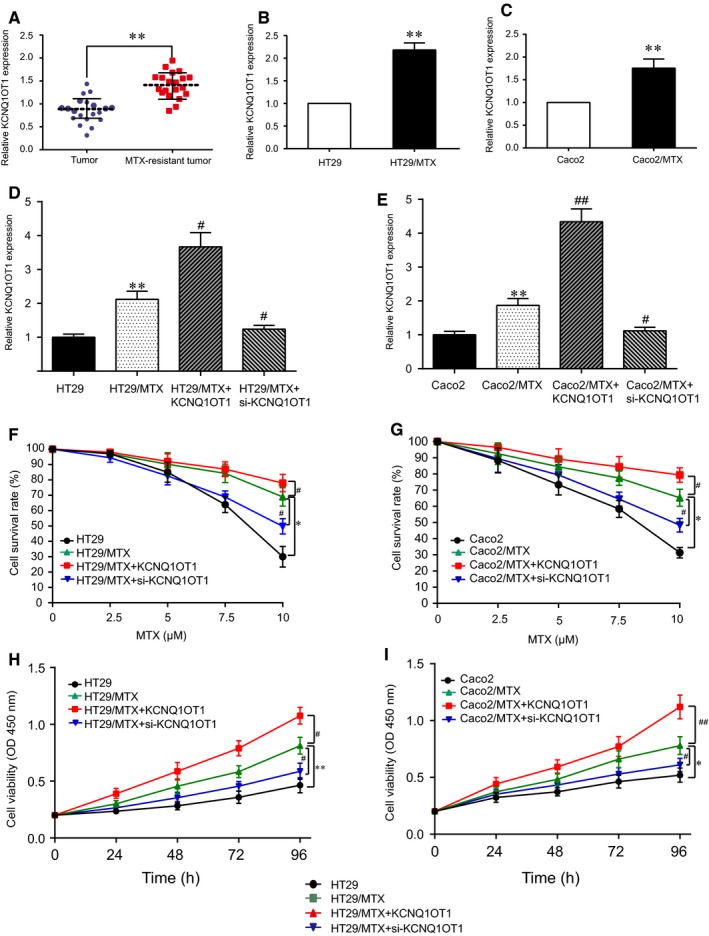
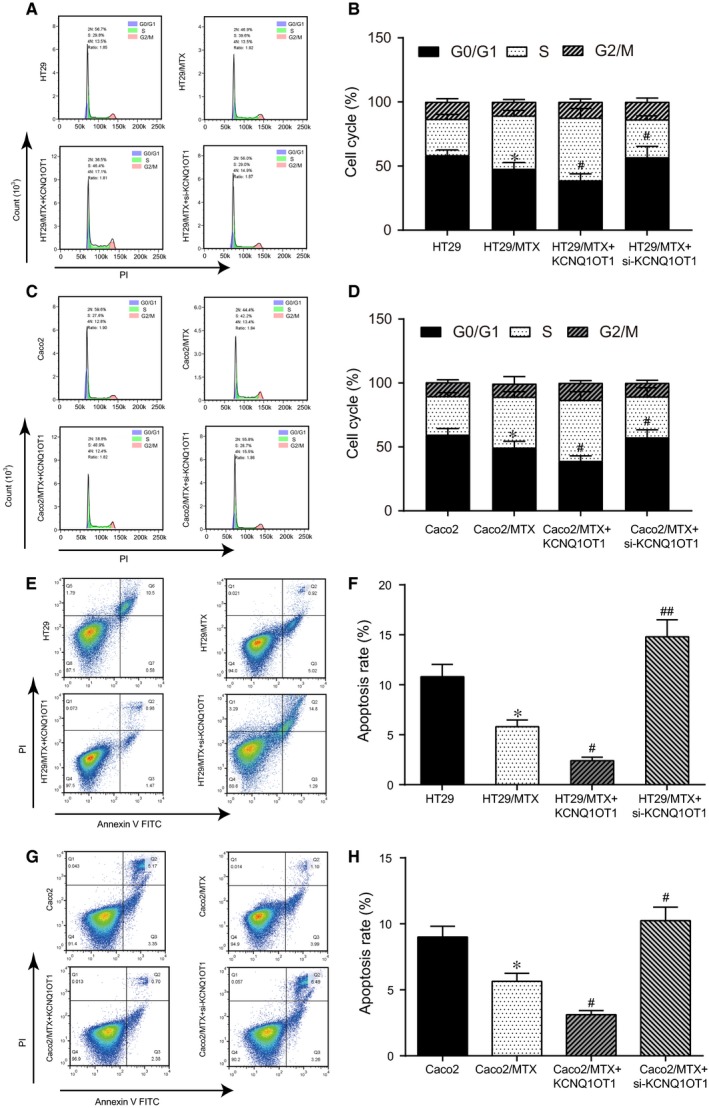
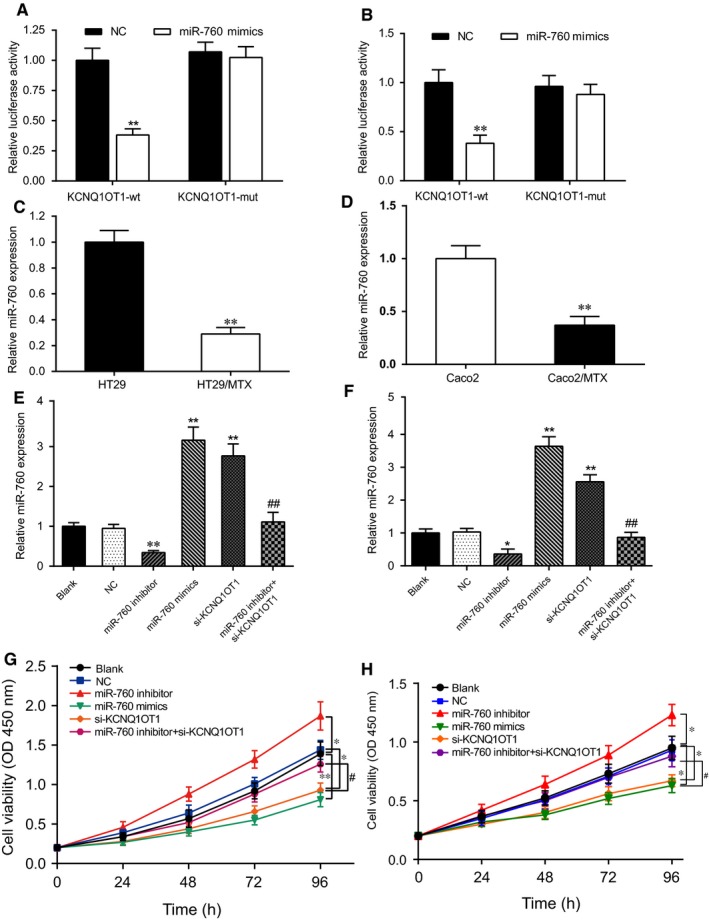
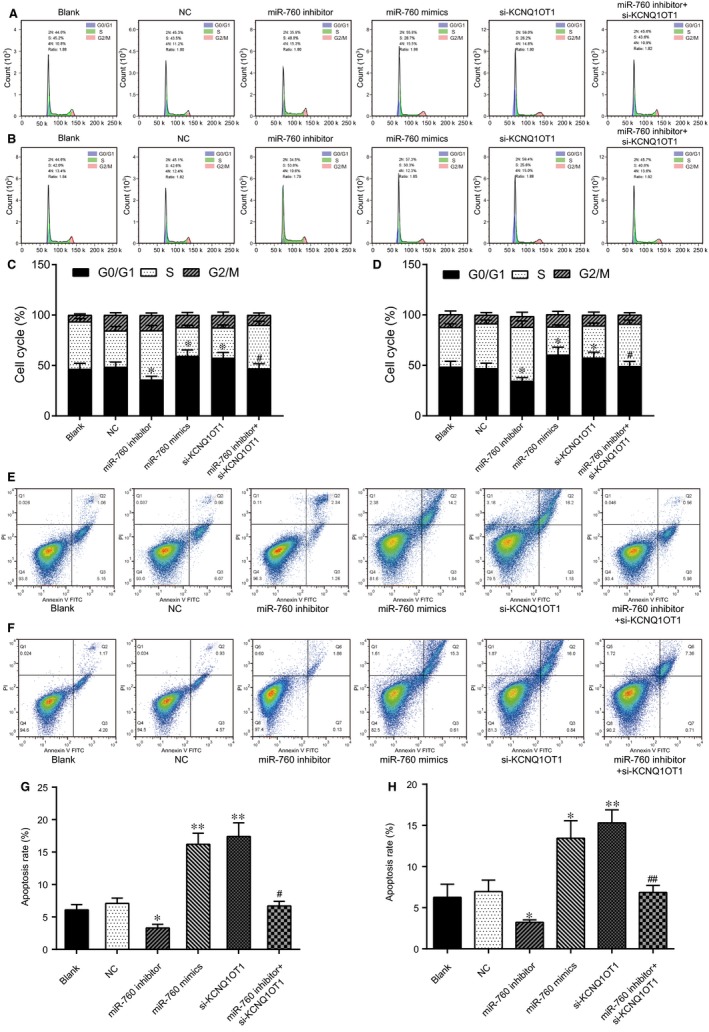
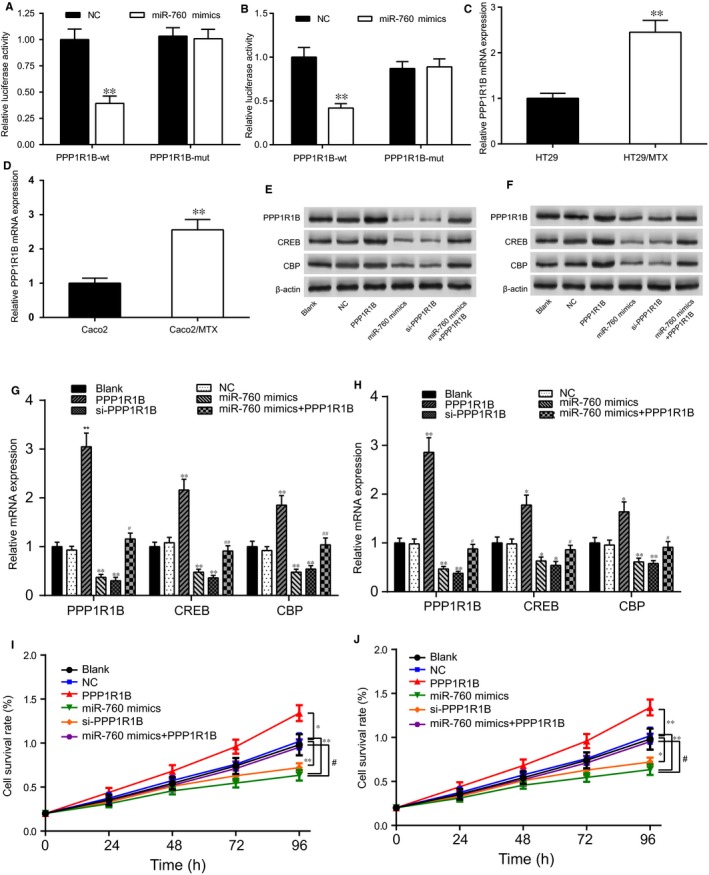
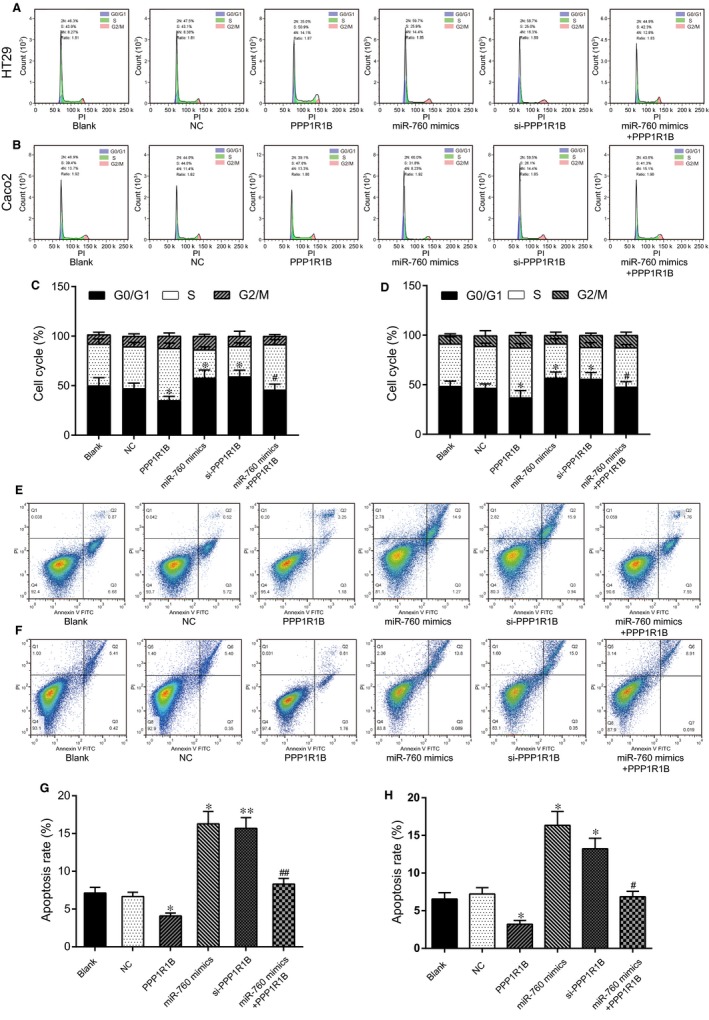
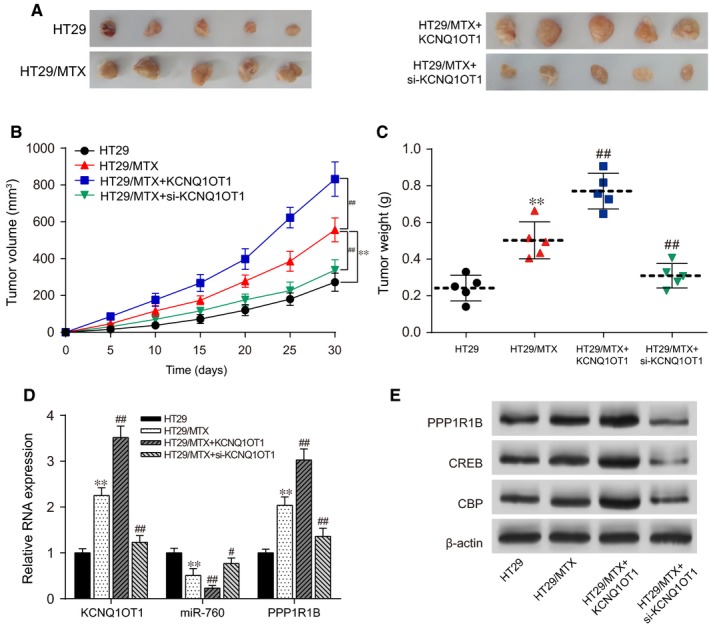
We aimed to explore the mechanism of the KCNQ1OT1/miR-760/PPP1R1B axis acting to regulate methotrexate (MTX) resistance of colorectal cancer (CRC). Differentially expressed mRNAs and lncRNAs in MTX-sensitive CRC cell lines and MTX-resistant cell lines were determined through microarray analysis. Application of bioinformatics analysis was aimed to uncover the relationships among the lncRNAs/miRNAs/mRNAs, and to demonstrate the effects of cAMP signalling pathway in MTX-resistant CRC. The expression level of RNA and proteins was, respectively, detected using qRT-PCR and Western blot assays, whereas the dual-luciferase reporter gene assay was implemented to verify the targeted relationship. The influence of the lncRNA/miRNA/mRNA axis on biological functions of MTX-resistant cells and on the growth of tumours determined through both vitro and vivo experiments. LncRNA KCNQ1OT1 and PPP1R1B mRNA were overexpressed in MTX-resistant CRC tumour cells. KCNQ1OT1 functioned as a sponge of miR-760, which targeted PPP1R1B. Knockdown of KCNQ1OT1 enhanced chemosensitivity towards MTX through the sponging of miR-760. MiR-760 expressed at low levels targeted PPP1R1B in the activated cAMP signalling pathway under MTX treatment. Knockdown of KCNQ1OT1 dampened the proliferation of MTX-resistant (HT29/MTX) cells by regulating the miR-760/PPP1R1B axis, which also induced cell cycle arrest together with apoptosis. KCNQ1OT1 regulated the expression of PPP1R1B and the downstream genes CREB and CBP in the cAMP signalling pathway. MTX showed a suppressive function on CRC progression. KCNQ1OT1 enhanced the MTX resistance of CRC cells by regulating miR-760-mediated PPP1R1B expression via the cAMP signalling pathway.

Keywords: bioinformatics analysis; cAMP signalling pathway; colorectal cancer; lncRNA; methotrexate.


Conflict of interest statement

No conflict of interest exits in the submission of this manuscript.

Figures

Figure 1
Figure 1
Differentially expressed lncRNAs and mRNAs in MTX‐resistant/sensitive CRC cells (A) The top 20 up‐ and down‐regulated lncRNAs were filtrated using microarray analysis. LncRNA KCNQ1OT1 was overexpressed in MTX‐resistant CRC cells compared with its expression in MTX‐sensitive cells, as shown in the heatmap. (B) The top 20 up‐ and down‐regulated mRNAs were selected through microarray analysis. PPP1R1B was up‐regulated in MTX‐resistant CRC cells compared with that in MTX‐sensitive cells, as shown in the heatmap. (C) Coexpression network of differentially expressed lncRNAs and mRNAs. KCNQ1OT1 was found to be correlated with PPP1R1B. (D) The binding sites of lncRNA KCNQ1OT1, PPP1R1B, and the specific miRNA (miR‐760) were determined with TargetScan and miRanda
Figure 2
Figure 2
The cAMP signalling pathway was significantly activated in MTX‐resistant CRC cells (A) A rank plot of the GSEA results showing the top 9 significantly activated and inactivated signalling pathways, including the cAMP signalling pathway. P (adjusted) <0.05. (B) A dotplot of the GSEA results indicating that the cAMP signalling pathway was activated in MTX‐resistant CRC cells. P (adjusted) <0.05. (C) A ridgeplot based on the GSEA results indicating that the cAMP signalling pathway was activated. P (adjusted) <0.05. (D) A GSEAplot indicating that the NES value of the cAMP signalling pathway was greater than zero and that this pathway was significantly enriched in MTX‐resistant CRC cells
Figure 3
Figure 3
KCNQ1OT1 was overexpressed in MTX‐resistant CRC tissues and cells and influenced MTX‐resistant CRC cell survival and proliferation (A) LncRNA KCNQ1OT1 was highly expressed in MTX‐resistant CRC tissues compared with its expression in MTX‐sensitive tissues, as determined by qRTPCR. **P < 0.01 compared with the MTX‐sensitive tumour tissues. (B) LncRNA KCNQ1OT1 was significantly up‐regulated in MTX‐resistant HT29 cells (HT29/MTX) compared with that in HT29 cells, as determined by qRTPCR. *P < 0.01 compared with the HT29 cells. (C) LncRNA KCNQ1OT1 was significantly up‐regulated in MTX‐resistant Caco2 cells (Caco2/MTX) compared with the Caco2 cells, as determined by qRTPCR. **P < 0.01 compared with the Caco2 cells. (D) LncRNA KCNQ1OT1 expression was measured by qRTPCR after transfection with pcDNA3.1‐KCNQ1OT1/si‐KCNQ1OT1 in the HT29 cell line. **P < 0.01 compared with the HT29 cells, #P < 0.05 compared with the HT29/MTX cells. LncRNA KCNQ1OT1 expression was measured by qRTPCR after transfection of the Caco2 cell line. **P < 0.01 compared with that of the Caco2 cells, #P < 0.05 and ##P < 0.01 compared with the Caco2/MTX cells. (F) A cell survival assay was performed to determine the effects of MTX resistance and KCNQ1OT1 with increasing concentrations of MTX in HT29 cells. *P < 0.05 compared with the HT29 cells, #P < 0.05 compared with the HT29/MTX cells. (G) A cell survival assay was performed to determine the effects of MTX resistance and KCNQ1OT1 with increasing concentrations of MTX in Caco2 cells. *P < 0.05 compared with the Caco2 cells, #P < 0.05 compared with the Caco2/MTX cells. (H) A CCK‐8 assay was performed to confirm the effects of MTX resistance and KCNQ1OT1 on cell proliferation in HT29 cells. *P < 0.05 compared with the HT29 cells, #P < 0.05 compared with the HT29/MTX cells. (I) A CCK‐8 assay was performed to confirm the effects of MTX resistance and KCNQ1OT1 on cell proliferation in Caco2 cells. *P < 0.05 compared with the Caco2 cells, #P < 0.05 compared with the Caco2/MTX cells
Figure 4
Figure 4
KCNQ1OT1 influenced cell cycle progression and apoptosis in MTX‐resistant CRC cells (A, B) The cell cycle stage was detected by flow cytometry in HT29 and HT29/MTX cells to explore the effect of KCNQ1OT1. *P < 0.05 compared with the HT29 cells, #P < 0.05 compared with the HT29/MTX cells. (C, D) The cell cycle stage was detected by flow cytometry in Caco2 and Caco2/MTX cells to explore the effect of KCNQ1OT1. *P < 0.05 compared with the Caco2 cells, #P < 0.05 compared with the Caco2/MTX cells. (E, F) Cell apoptosis was detected by flow cytometry in HT29 and HT29/MTX cells to explore the effect of KCNQ1OT1. *P < 0.05 compared with the HT29 cells, #P < 0.05 and ##P < 0.01 compared with the HT29/MTX cells. (G, H) Cell apoptosis was detected by flow cytometry in Caco2 and Caco2/MTX cells to explore the effect of KCNQ1OT1. *P < 0.05 compared with the Caco2 cells, #P < 0.05 compared with the Caco2/MTX cells
Figure 5
Figure 5
Silencing of KCNQ1OT1 influenced the proliferation of MTX‐resistant CRC cells through the sponging of miR‐760. (A) The targeted relationship between KCNQ1OT1 and miR‐760 was determined with the dual‐luciferase reporter gene assay in HT29/MTX cells under the treatment with MTX. **P < 0.01 compared with the KCNQ1OT1 +  NC group. (B) The targeted relationship between KCNQ1OT1 and miR‐760 was determined with the dual‐luciferase reporter gene assay in Caco2/MTX cells under the treatment with MTX. **P < 0.01 compared with the KCNQ1OT1 +  NC group. (C) MiR‐760 was visibly down‐regulated in HT29/MTX cells compared with its levels in HT29 cells, as determined by qRTPCR. **P < 0.01 compared with the HT29 cells. (D) MiR‐760 was markedly down‐regulated in Caco2/MTX cells compared with its expression in Caco2 cells, as detected by qRTPCR. **P < 0.01 compared with the Caco2 cells. (E) qRTPCR was performed to measure miR‐760 expression after transfection in HT29/MTX cells. **P < 0.01 compared with the NC group, ##P < 0.01 compared with the miR‐760 inhibitor group. (F) qRTPCR was performed to measure miR‐760 expression after transfection in Caco2/MTX cells. *P < 0.05 and **P < 0.01 compared with the NC group, ##P < 0.01 compared with the miR‐760 inhibitor group. (G) Cell proliferation was measured with a CCK‐8 assay to explore the effect of the KCNQ1OT1/miR‐760 axis in HT29/MTX cells. *P < 0.05 and **P < 0.01 compared with the NC group, #P < 0.05 compared with the miR‐760 inhibitor group. (H) Cell proliferation was measured with a CCK‐8 assay to explore the effect of the KCNQ1OT1/miR‐760 axis in Caco2/MTX cells. *P < 0.05 compared with the NC group, #P < 0.05 compared with the miR‐760 inhibitor group
Figure 6
Figure 6
Silencing of KCNQ1OT1 influenced cell cycle progression and apoptosis in MTX‐resistant CRC cells through the sponging of miR‐760 (A, C) The cell cycle stage was determined by flow cytometry in HT29/MTX cells to explore the effect of the KCNQ1OT1/miR‐760 axis. *P < 0.05 compared with the NC group, #P < 0.05 compared with the miR‐760 inhibitor group. (B, D) The cell cycle stage was determined by flow cytometry in Caco2 and Caco2/MTX cells to explore the effect of the KCNQ1OT1/miR‐760 axis. *P < 0.05 compared with the NC group, #P < 0.05 compared with the miR‐760 inhibitor group. (E, G) Cell apoptosis was detected by flow cytometry in HT29/MTX cells to explore the effect of the KCNQ1OT1/miR‐760 axis. *P < 0.05 compared with the NC group, #P < 0.05 compared with the miR‐760 inhibitor group. (F, H) Cell apoptosis was detected by flow cytometry in Caco2/MTX cells to explore the effect of the KCNQ1OT1/miR‐760 axis. *P < 0.05 compared with the NC group, #P < 0.05 compared with the miR‐760 inhibitor group
Figure 7
Figure 7
MiR‐760 modulated PPP1R1B expression and the downstream proteins CREB and CBP in the cAMP signalling pathway. (A) The targeted relationship between miR‐760 and PPP1R1B was determined by dual‐luciferase reporter assay in HT29/MTX cells under the treatment with MTX. **P < 0.01 compared with the PPP1R1B + NC group. (B) The targeted relationship between miR‐760 and PPP1R1B was determined with the dual‐luciferase reporter assay in Caco2/MTX cells under the treatment with MTX. **P < 0.01 compared with the PPP1R1B + NC group. (C) PPP1R1B was overexpressed in HT29/MTX cells, as measured by qRTPCR. **P < 0.01 compared with the HT29 cells. (D) PPP1R1B was overexpressed in Caco2/MTX cells, as measured by qRTPCR. **P < 0.01 compared with the HT29 cells. (E) Western blot was used to examine the influence of miR‐760 on PPP1R1B and the related proteins CREB and CBP in the cAMP signalling pathway in HT29/MTX cells. (F) Western blot was used to examine the influence of miR‐760 on PPP1R1B and the related proteins CREB and CBP in the cAMP signalling pathway in Caco2/MTX cells. (G) The expression levels of PPP1R1B,CREB, and CBP were measured by qRTPCR to explore the effect of the PPP1R1B/miR‐760 axis in HT29/MTX cells. **P < 0.01 compared with the NC group, #P < 0.05 and ##P < 0.01 compared with the PPP1R1B group. (H) The expression levels of PPP1R1B,CREB and CBP were measured by qRTPCR to explore the effect of the PPP1R1B/miR‐760 axis in Caco2/MTX cells. *P < 0.05 and **P < 0.01 compared with the NC group, #P < 0.05 compared with the PPP1R1B group. (I) Cell viability was determined with a CCK‐8 assay to explore the effect of the PPP1R1B/miR‐760 axis in HT29/MTX cells. *P < 0.05 and **P < 0.01 compared with the NC group, #P < 0.05 compared with the PPP1R1B group. (H) Cell viability was determined with a CCK‐8 assay to explore the effect of the PPP1R1B/miR‐760 axis in Caco2/MTX cells. *P < 0.05 and **P < 0.01 compared with the NC group, #P < 0.05 compared with the PPP1R1B group
Figure 8
Figure 8
MiR‐760 induced cell cycle arrest and apoptosis by regulating PPP1R1B in MTX‐resistant CRC cells. (A, C) The cell cycle stage was detected by flow cytometry in HT29/MTX cells to explore the effect of the miR‐760/PPP1R1B axis. *P < 0.05 and **P < 0.01 compared with the NC group, #P < 0.05 compared with the PPP1R1B group. (B, D) The cell cycle stage was determined by flow cytometry in Caco2/MTX cells to explore the effect of the miR‐760/PPP1R1B axis. *P < 0.05 compared with the NC group, #P < 0.05 compared with the PPP1R1B group. (E, G) Cell apoptosis was detected by flow cytometry in HT29/MTX cells to explore the effect of the miR‐760/PPP1R1B axis. *P < 0.05 and **P < 0.01 compared with the NC group, ##P < 0.01 compared with the PPP1R1B group. (F, H) Cell apoptosis was detected by flow cytometry in Caco2/MTX cells to explore the effect of the miR‐760/PPP1R1B axis. *P < 0.05 compared with the NC group, #P < 0.05 compared with the PPP1R1B group
Figure 9
Figure 9
Silencing of KCNQ1OT1 impeded MTX‐resistant CRC tumour growth in vivo. (A) Images of tumour tissues. (B) The tumour volumes of nude mice injected with HT29/MTX cells in the KCNQ1OT1 group were significantly greater than those in the HT29/MTX group, whereas those in the si‐KCNQ1OT1 group were relatively smaller. (C) The tumour masses of nude mice injected with HT29/MTX cells in the KCNQ1OT1 group were significantly heavier than those in the HT29/MTX group, whereas those in the si‐KCNQ1OT1 group were relatively lighter. (D) The influence of KCNQ1OT1 on miR‐760 and PPP1R1B expression, as determined by qRTPCR. (E) The influence of KCNQ1OT1 on PPP1R1B expression and the expression of the related proteins CREB and CBP in the cAMP signalling pathway, as determined by Western blot. *P < 0.05 and **P < 0.01 compared with the HT29 group, #P < 0.05 and ##P < 0.01 compared with the HT29/MTX group

References

    1. Tao Y, Han T, Zhang T, et al. LncRNA CHRF‐induced miR‐489 loss promotes metastasis of colorectal cancer via TWIST1/EMT signaling pathway. Oncotarget. 2017;8:36410‐36422. - PMC - PubMed
    1. Jin J, Chu Z, Ma P, et al. Long non‐coding RNA SPRY4‐IT1 promotes proliferation and invasion by acting as a ceRNA of miR‐101‐3p in colorectal cancer cells. Tumour Biol. 2017;39:1010428317716250. - PubMed
    1. Yang P, Yang Y, An W, et al. The long noncoding RNA‐ROR promotes the resistance of radiotherapy for human colorectal cancer cells by targeting the p53/miR‐145 pathway. J Gastroenterol Hepatol. 2017;32:837‐845. - PubMed
    1. Bian Z, Jin L, Zhang J, et al. LncRNA‐UCA1 enhances cell proliferation and 5‐fluorouracil resistance in colorectal cancer by inhibiting miR‐204‐5p. Sci Rep. 2016;6:23892. - PMC - PubMed
    1. Han P, Li JW, Zhang BM, et al. The lncRNA CRNDE promotes colorectal cancer cell proliferation and chemoresistance via miR‐181a‐5p‐mediated regulation of Wnt/beta‐catenin signaling. Mol Cancer. 2017;16:9. - PMC - PubMed

MeSH terms