. 2019 Apr 18;5(11):e124510.
doi: 10.1172/jci.insight.124510.

Down syndrome mouse models have an abnormal enteric nervous system

Affiliations

Down syndrome mouse models have an abnormal enteric nervous system

Ellen M Schill et al. JCI Insight. .

Abstract

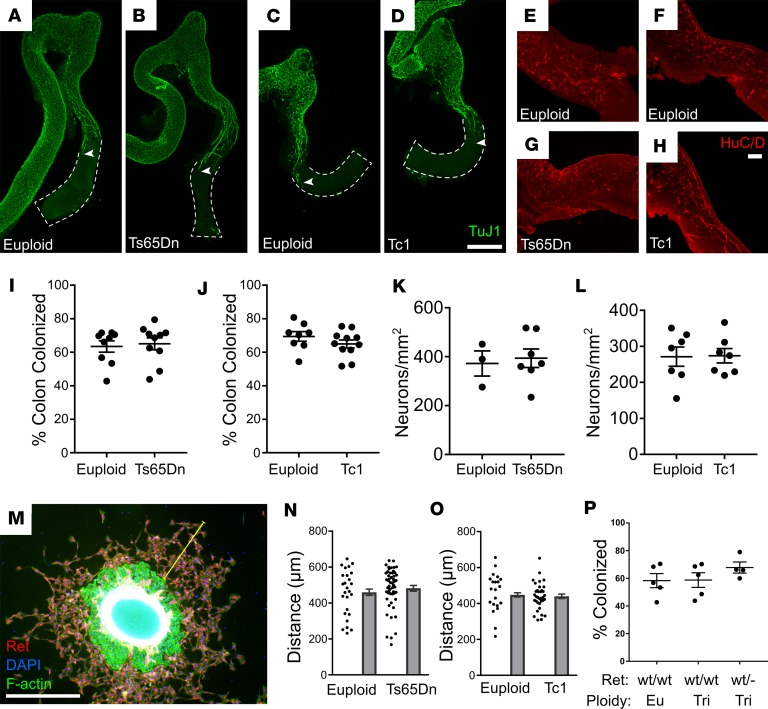
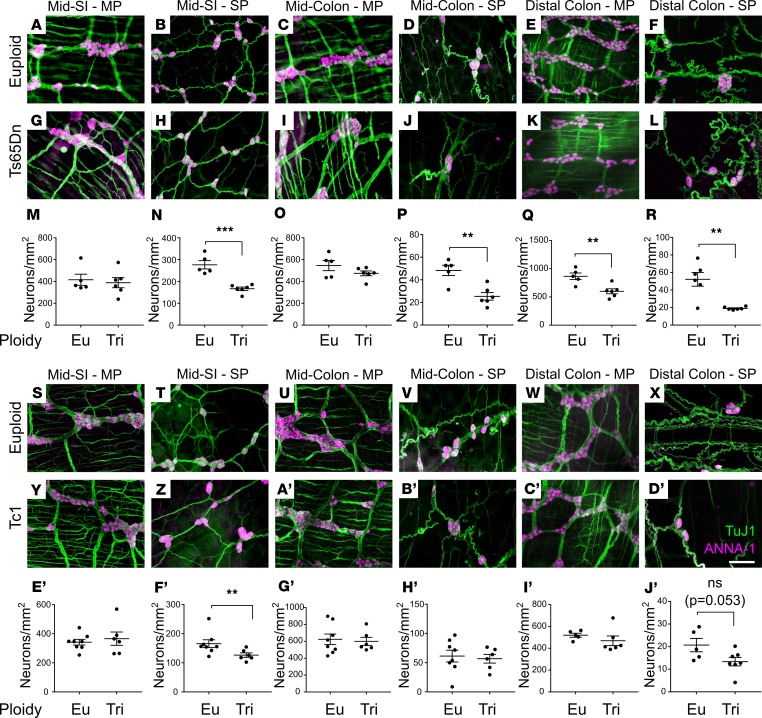
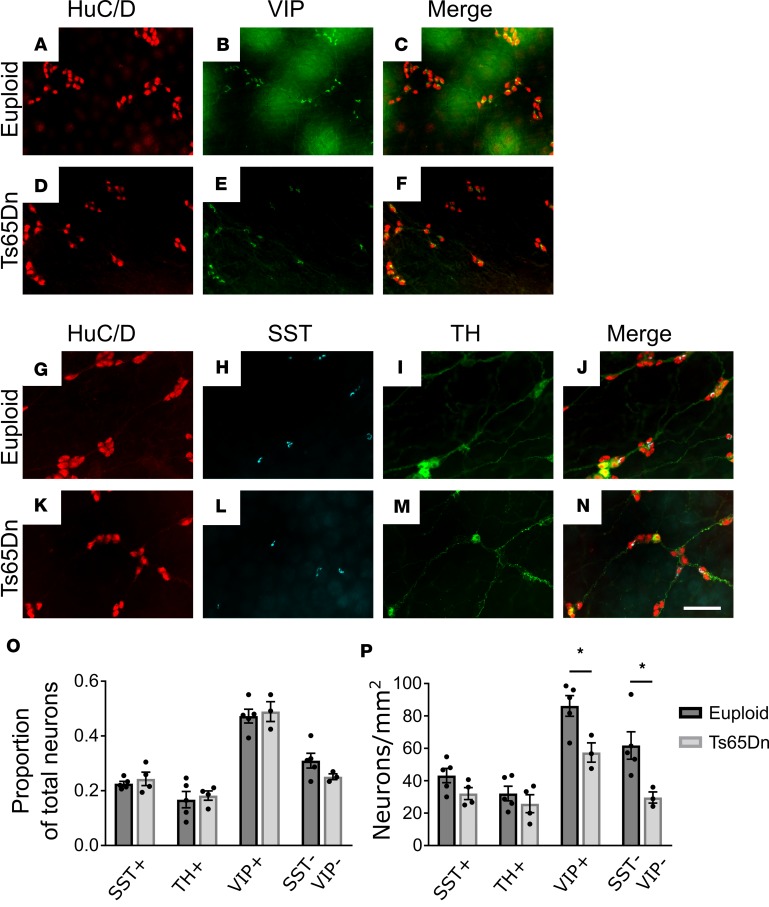
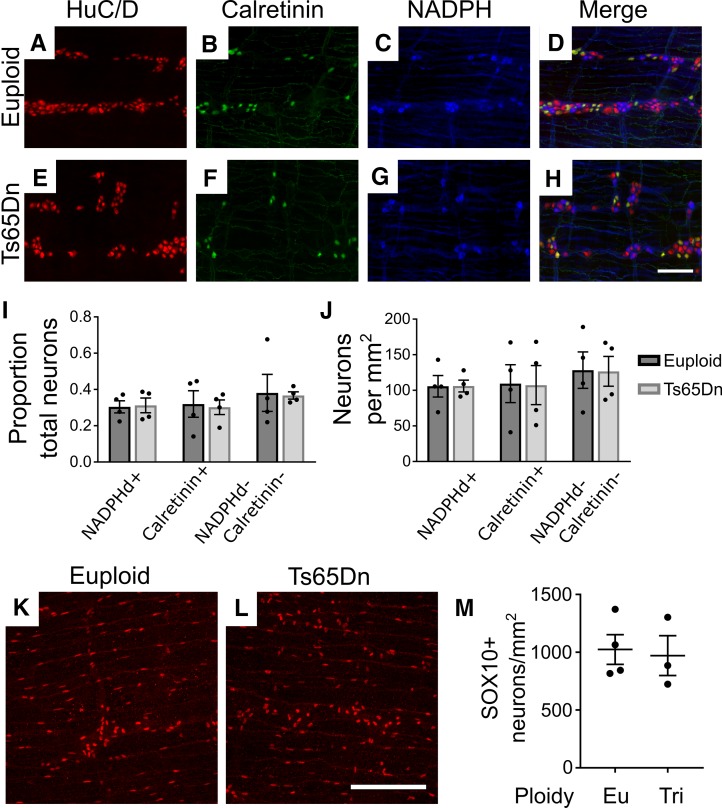
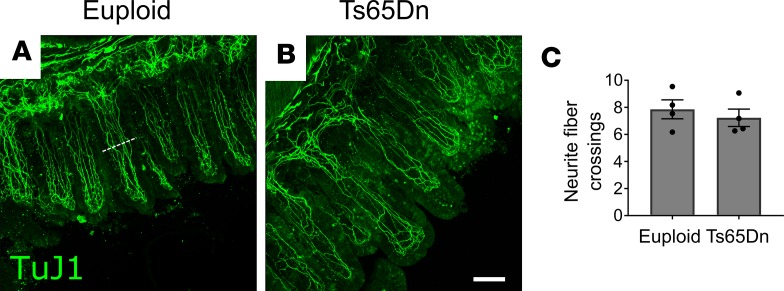
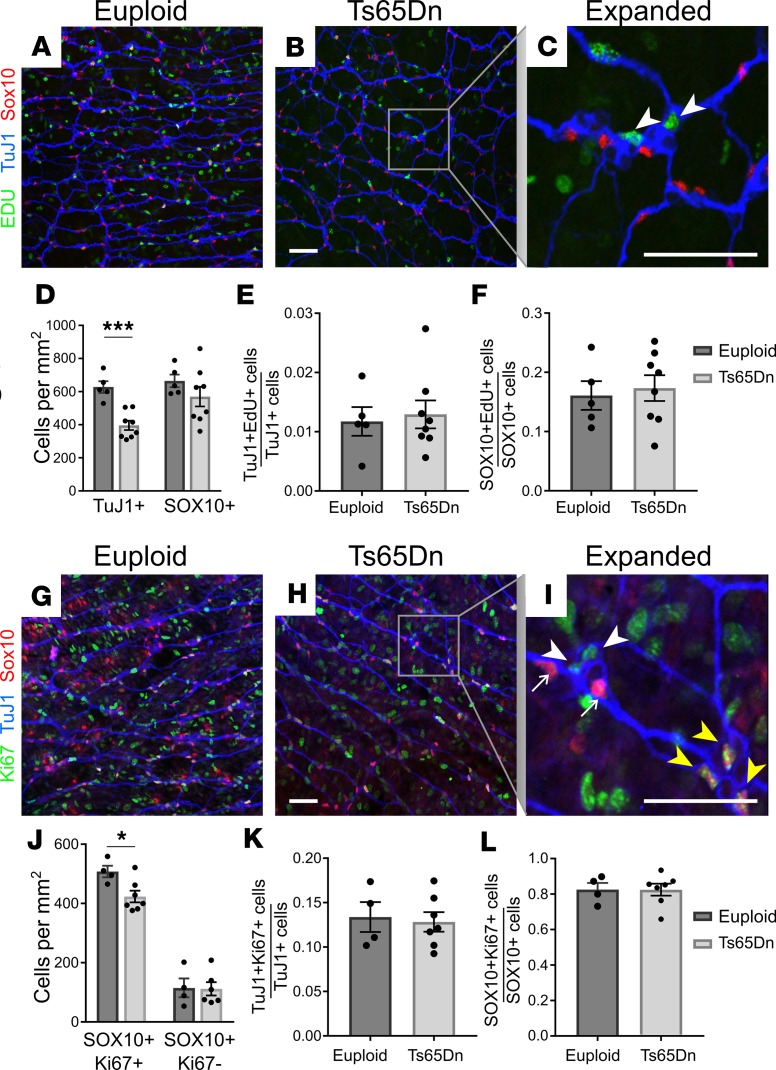
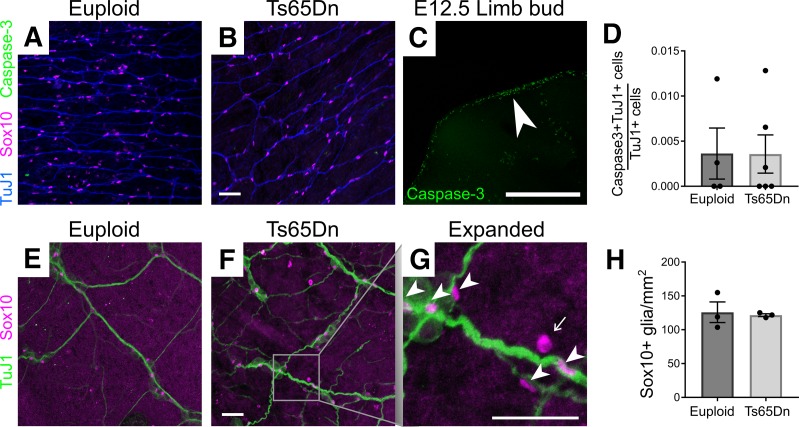
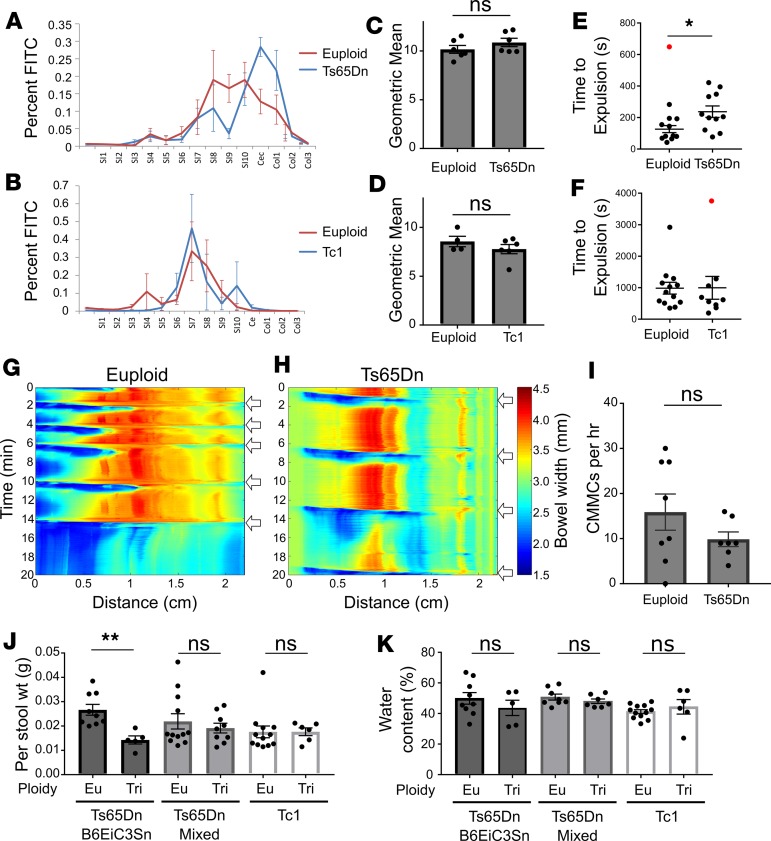
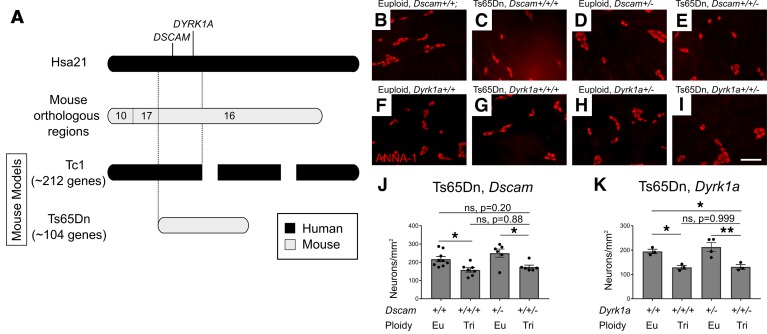
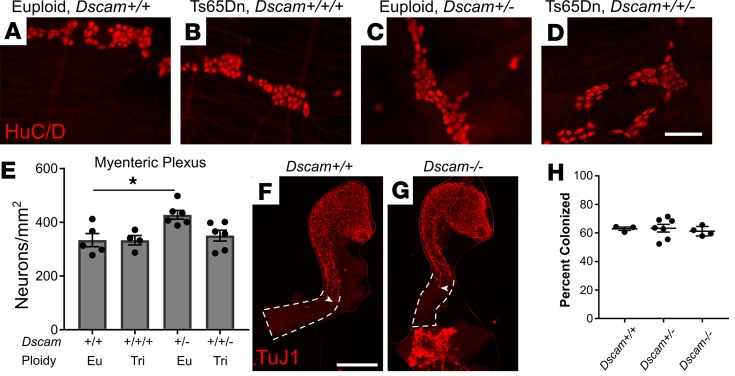
Children with trisomy 21 (Down syndrome [DS]) have a 130-fold increased incidence of Hirschsprung Disease (HSCR), a developmental defect where the enteric nervous system (ENS) is missing from distal bowel (i.e., distal bowel is aganglionic). Treatment for HSCR is surgical resection of aganglionic bowel, but many children have bowel problems after surgery. Post-surgical problems like enterocolitis and soiling are especially common in children with DS. To determine how trisomy 21 affects ENS development, we evaluated the ENS in two DS mouse models, Ts65Dn and Tc1. These mice are trisomic for many chromosome 21 homologous genes, including Dscam and Dyrk1a, which are hypothesized to contribute to HSCR risk. Ts65Dn and Tc1 mice have normal ENS precursor migration at E12.5 and almost normal myenteric plexus structure as adults. However, Ts65Dn and Tc1 mice have markedly reduced submucosal plexus neuron density throughout the bowel. Surprisingly, the submucosal neuron defect in Ts65Dn mice is not due to excess Dscam or Dyrk1a, since normalizing copy number for these genes does not rescue the defect. These findings suggest the possibility that the high frequency of bowel problems in children with DS and HSCR may occur because of additional unrecognized problems with ENS structure.

Keywords: Development; Embryonic development; Gastroenterology; Genetic diseases.


Conflict of interest statement

Conflict of interest: The authors have declared that no conflict of interest exists.

Figures

Figure 1
Figure 1. Tc1 and Ts65Dn mice have normal bowel colonization by ENS precursors at E12.5. (A–D) Ts65Dn and Tc1 euploid and trisomic E12.5 colon and distal small bowel were stained using Tuj1 antibody that marks early and mature neurons.
Maximum intensity projections of confocal Z-stacks are shown. White arrowheads indicate the position of most caudal TuJ1 immunoreactive neuronal process (green). Scale bar: 500 μm. (EH) High-resolution images show HuC/D+ cell bodies (red) in hindgut in Ts65Dn (E and F) and Tc1 (G and H) lineage mice. Scale bar: 100 μm. (I and J) Percentage of colon colonized by ENCDC relative to total colon length for Ts65Dn (I; P = 0.653, Mann-Whitney rank sum test [MWRST], n = 9 [WT] and 10 [Ts65Dn]) and Tc1 (J; P = 0.24, t test, n = 9 [WT] and 11 [Tc1]) mice. (K and L) Mean HuC/D+ neuron density in most distal 500 μm of colonized bowel for Ts65Dn (K, P = 0.76; t test, n = 3 [WT], n = 7 [Ts65Dn]) and Tc1 (L, P = 0.94, t test, n = 7 [WT], n = 8 [Tc1]) mice. (MO) Small bowel slices from E12.5 Ts65Dn and Tc1 mice were plated on fibronectin-treated chamber slides. GDNF was added 4 hours later. After an additional 16 hours in GDNF-containing media, slices were fixed and the distance from the farthest-migrated ENCDC to the slice edge (yellow line) was measured and averaged over 4 quadrants. (M) Representative image from slice culture after staining for RET (to identify ENCDC, red), phalloidin (which stains F-actin, green), and DAPI (nuclear stain, blue). (N and O) Ts65Dn (N, P = 0.436, MWRST, n = 26 [euploid] and 52 [Ts65Dn]) and Tc1 (O, P = 0.385, t test, n = 21 [euploid] and 35 [Tc1]) animals had similar ENCDC migration distance to euploid animals. (P) Ret heterozygosity did not affect migration of Ts65Dn ENCDC (P = 0.38, ANOVA, n = 5 [Euploid, Ret+/+], n = 5 [Ts65Dn, Ret+/+], and n = 4 [Ts65Dn, Ret+/–]).
Figure 2
Figure 2. Tc1 and Ts65Dn mice have hypoganglionosis, especially in submucosal plexus.
(AL) Ts65Dn and (SD’) Tc1 trisomic and euploid myenteric and submucosal plexuses were stained with TuJ1+ (green) and HuC/D+ (magenta) antibodies. (A, C, E, G, I, K, S, U, W, Y, A’, and C’) Myenteric plexus (MP). (B, D, F, H, J, L, T, V, X, Z, B’, and D’) Submucosal plexus (SP). (MR) Quantitative analysis of neuron density for euploid and Ts65Dn mice (see also Table 1 for quantitative data and statistical tests). (E’J’) Quantitative analysis of neuron density for euploid and Tc1 mice (see also Table 1 for quantitative data and statistical tests). Scale bar: 100 μm. **P < 0.01, ***P < 0.001.
Figure 3
Figure 3. Analysis of subtypes of submucosal neurons in Ts65Dn adult mice.
(AN) Euploid and Ts65Dn adult submucosal plexuses from small bowel were stained for HuC/D (red) and VIP (green) (AF) or HuC/D (red), SST (cyan), and TH (green) (GN). Scale bar: 100 μm. (O) Proportion of neuron subtypes relative to total HuC/D+ cells (SST: P = 0.477, t test, n = 5 [euploid] and n = 4 [Ts65Dn]; TH: P = 0.905, MWRST, n = 5 [euploid] and n = 3 [Ts65Dn]; VIP: P = 0.712, t test, n = 5 [euploid] and n = 3 [Ts65Dn]; SST-VIP: P = 0.164, t test, n = 5 [euploid] and n = 3 [Ts65Dn]). Note that TH+ neurons are a subset of VIP+ neurons. (P) Absolute neuron density per mm2 for neuron subtypes (SST: P = 0.104, t test, n = 5 [euploid] and n = 4 [Ts65Dn]; TH: P = 0.40, t test, n = 5 [euploid] and n = 3 [Ts65Dn]; VIP: P = 0.024, t test, n = 5 [euploid] and n = 3 [Ts65Dn]; SST-VIP: P = 0.032, t test, n = 5 [euploid] and n = 3 [Ts65Dn]). *P < 0.05.
Figure 4
Figure 4. Density of NADPH diaphorase+ neurons, calretinin+ neurons, and SOX10+ glia is normal in Ts65Dn adult small bowel.
Ts65Dn adult trisomic myenteric plexus from small bowel was stained with antibodies against HuC/D (A and E) and calretinin (B and F) and also stained using NADPH diaphorase histochemistry, which was pseudocolored blue to merge with fluorescent images (C and G). Merged images (D and H) show NADPHd+, calretinin+, and NADPHd/calretinin neurons. (I) Ts65Dn mice had normal ratios of specific neuron subtypes to total neurons (NADPH: P = 0.881, t test, n = 4 [euploid] and n = 4 [Ts65Dn]; calretinin: P = 0.839, t test, n = 4 [euploid] and n = 4 [Ts65Dn]; NADPHd/calretinin: P = 0.898, t test, n = 4 [euploid] and n = 4 [Ts65Dn]) and (J) absolute neuron density (NADPH: P = 0.986, t test, n = 4 [euploid] and n = 4 [Ts65Dn]; calretinin: P = 0.960, t test, n = 4 [euploid] and n = 4 [Ts65Dn]; NADPHd/calretinin: P = 0.961, t test, n = 4 [euploid] and n = 4 [Ts65Dn]). (K and L) Adult myenteric plexus from euploid and Ts65Dn mid-small intestine was stained with anti-SOX10 antibody and imaged using confocal Z-stacks. Maximum intensity projections are shown. (M) Ts65Dn and euploid animals did not differ in numbers of myenteric SOX10+ glia (P = 0.980, t test, n = 4 [euploid] and n = 3 [Ts65Dn]). Scale bar: 100 μM.
Figure 5
Figure 5. Neurite density within villi is normal in trisomic mice.
(A and B) Representative Z-projections of TuJ1+ nerve fibers in mid-small bowel villi from euploid (A) and Ts65Dn (B) mice. (C) Quantification of villus neurite fiber crossings shows no difference between euploid and Ts65Dn mice (P = 0.5366, t test, n = 4[euploid] and n = 4[Ts65Dn]). The white dotted line in A represents an example location where intersecting fibers were counted. Scale bar: 100 μM.
Figure 6
Figure 6. Neuronal and glial precursor proliferation were normal in Ts65Dn mice.
(A, B, G, and H) Euploid and Ts65Dn P1 submucosal plexuses from small bowel were labeled with EdU ClickIT chemistry (green) plus antibodies against SOX10 (red) and TuJ1 (blue) antibodies (A and B) or with antibodies to Ki67 (green), SOX10 (red), and TuJ1 (blue) (G and H). In higher-magnification images (C and I), white arrowheads indicate TuJ1+EdU+ (C) or TuJ1+Ki67+ (I) neuron precursors; yellow arrowheads indicate SOX10+Ki67+ cells (I); and small white arrows indicate SOX10+Ki67 glia (I). (D) TuJ1+ cell density was significantly reduced in P1 Ts65Dn submucosal plexus (P < 0.001, t test, n = 5 [euploid] and n = 8 [Ts65Dn]), while SOX10+ cell density was not significantly reduced in Ts65Dn animals (P = 0.267, t test; n = 5 [euploid] and n = 8 [Ts65Dn]). (E and F) The proportion TuJ1+EdU+ precursors relative to total TuJ1+ neurons (E), and the proportion SOX10+EdU+cells relative to total SOX10+ cells (F), was unchanged in P1 Ts65Dn submucosal plexus (TuJ1+EdU+ proportion: P = 0.747, t test, n = 5 [euploid] and n = 8 [Ts65Dn]; SOX10+EdU+ proportion: P = 0.719, t test; n = 5 [euploid] and n = 8 [Ts65Dn]). (J) P1 Ts65Dn mice had reduced SOX10+Ki67+ cell density but normal SOX10+Ki67 cell density (SOX10+Ki67+: P = 0.0214, t test, n = 4 [euploid] and n = 7 [Ts65Dn]; SOX10+Ki67: P = 0.748, t test, n = 4 [euploid], n = 4 [Ts65Dn]). (K and L) The proportion TuJ1+Ki67+ precursors relative to total TuJ1+ neurons (K), and the proportion SOX10+Ki67+ cells relative to total SOX10+ cells (L), was unchanged in P1 Ts65Dn submucosal plexus (TuJ1+Ki67+ proportion: P = 0.782, t test, n = 4 [euploid] and n = 7 [Ts65Dn]; SOX10+Ki67+ proportion: P = 0.992, t test; n = 4 [euploid] and n = 7 [Ts65Dn]). Scale bars: 50 μm. All images are confocal Z-stacks. *P < 0.05, ***P < 0.001.
Figure 7
Figure 7. Apoptosis and glial number were normal in Ts65Dn submucosal plexus.
(A and B) P1 bowel stained with antibody against cleaved caspase-3 (green) had few immunoreactive cells. (C) E12.5 mouse proximal limb was used as a positive control for cleaved caspase-3 antibody staining to ensure apoptotic cells were readily detected by the antibody. White arrowhead indicates densest region of apoptotic cells. (D) Quantitative analysis of cleaved caspase-3 data (P = 1.0, MWRST, n = 4 [euploid] and n = 6 [Ts65Dn]). (E and F) Adult small intestine showing SOX10+ mature glia (magenta) in proximity to TuJ1+ (green) neuron processes. In the expanded image (G), arrowheads indicate SOX10+ glia, and arrows indicate autofluorescent blood cells, which were not counted. (H) Quantitative analysis of SOX10+ mature glia in adult submucosal plexus (P = 0.59, t test, n = 3 [euploid] and n = 3 [Ts65Dn]). Scale bars: 50 μm (A, B, and EG); 500 μm (C). All images are confocal Z-stacks.
Figure 8
Figure 8. Ts65Dn mice have altered bowel motility and stooling patterns.
(AD) Proximal bowel transit was measured by quantifying FITC-dextran in bowel segments after gavage. There was no difference between each segment’s FITC content (A and B; t tests with Holm-Sidak multiple comparisons correction) or between geometric means of trisomic and euploid mice (Ts65Dn: C, P = 0.255, t test, n = 6 [euploid] and 6 [Ts65Dn]; Tc1: D, P = 0.311, t test, n = 6 [euploid] and 4 [Ts65Dn]). (E and F) Colon transit, measured by inserting a glass bead into distal colon and timing expulsion, was no different with all data points included (E, P = 0.0595, MWRST; n = 12 [euploid] and n = 11 [Ts65Dn]) but was significantly increased in Ts65Dn mice when one outlier (red; ROUT and Grubb’s Outlier tests) was removed (E, P = 0.0117; t test; n = 11 [euploid] and n = 11 [Ts65Dn]). No difference in colonic bead expulsion time occurred in Tc1 mice (F, P = 0.26; MWRST; n = 13 [euploid] and n = 9 [Tc1]), even when one outlier (ROUT analysis, red) was removed (P = 0.232; MWRST). (G and H) Representative kymographs plotting bowel width as a function of time and bowel distance for euploid (G) and Ts65Dn (H) colon maintained at 2-cm pressure in an oxygenated organ bath. (I) CMMC (white arrows) frequency in Ts65Dn mice was not significantly different from euploid littermates (P = 0.30, MWRST, n = 8 [euploid] and n = 7 [Ts65Dn]). (J) Per stool weight was significantly larger in Ts65Dn mice on a B6EiC3Sn background (G, P = 0.003, t test, n = 9 [euploid] and n = 5 [Ts65Dn]) but normal for Ts65Dn mice on a mixed (B6EiC3Sn × C57BL/6J) background (P = 0.749, MWRST, n = 12 [euploid] and n = 9 [Ts65Dn]) or Tc1 mice (P = 0.482, MWRST, n = 12 [euploid] and n = 6 [Ts65Dn]). (K) Stool water content was normal for all strains tested (B6EiC3Sn: P = 0.346, t test, n = 9 [euploid] and n = 5 [Ts65Dn]; mixed background: P = 0.297, t test, n = 8 [euploid] and n = 7 [Ts65Dn]; Tc1: P = 0.526, MWRST, n = 12 [euploid] and n = 6 [Ts65Dn]). *P < 0.05, **P < 0.01.
Figure 9
Figure 9. Normalizing Dscam or Dyrk1a gene copy number in Ts65Dn mice does not correct the submucosal plexus hypoganglionosis.
(A) Map of Ts65Dn and Tc1 trisomic regions. (B–E) Submucosal plexus of adult Euploid, Dscam+/+; Ts65Dn, Dscam+/+/+; Euploid, Dscam+/–; and Ts65Dn, Dscam+/+/–; and (F–I) Euploid, Dyrk1a+/+; Ts65Dn, Dyrk1a +/+/+; Euploid, Dyrk1a +/–; and Ts65Dn, Dyrk1a +/+/– mice stained for HuC/D (red). (J and K) Quantification of neuron density from images, such as BI, indicates normalizing copy number for Dscam and Dyrk1a did not prevent distal colon hypoganglionosis (P = 0.201 Euploid, Dscam+/+ versus Ts65Dn, Dscam+/+/– and P = 0.884 Ts65Dn, Dscam+/+/+ versus Ts65Dn, Dscam+/+/–, ANOVA with post-hoc Tukey test; n = 9 [Euploid, Dscam+/+], n = 7 [Ts65Dn, Dscam+/+/+], n = 6 [Euploid, Dscam+/–], and n = 6 [Ts65Dn, Dscam+/+/–]) or DYRK1A (P = 0.048 Euploid, Dyrk1a+/+ versus Ts65Dn, Dyrk1a+/+/–, and P = 0.999 Ts65Dn, Dyrk1a+/+/– versus Ts65Dn, Dyrk1a+/+/+, ANOVA with post-hoc Tukey test; n = 4 [Euploid, Dyrk1a+/+], n = 3 [Ts65Dn, Dyrk1a+/+/+], n = 3 [Euploid, Dyrk1a+/–], and n = 3 [Ts65Dn, Dyrk1a+/+/–]). Scale bar: 100 μm. *P < 0.05, **P < 0.01.
Figure 10
Figure 10. Adult Dscam heterozygous mice have increased myenteric plexus neuron density but normal bowel colonization rate by ENCDC.
(AD) HuC/D staining of adult small bowel myenteric plexus in adult Euploid, Dscam+/+; Ts65Dn, Dscam+/+/+; Euploid, Dscam+/–; and Ts65Dn, Dscam+/+/– mice. Scale bar: 100 μm. (E) Quantification of neurons reveals increased myenteric plexus density in mice with 1 copy of Dscam (P = 0.0169 Euploid, Dscam+/+ versus Euploid, Dscam+/–, ANOVA with post-hoc Tukey test; n = 5 [Euploid, Dscam+/+], n = 4 [Ts65Dn, Dscam+/+/+], n = 6 [Euploid, Dscam+/–], and n = 6 [Ts65Dn, Dscam+/+/–]). (F and G) TuJ1-stained large bowel of E12.5 Dscam+/+ and Dscam–/– mice. Scale bar: 500 μm. (H) Quantification of proportion of colonized colon in E12.5 mice with 2, 1, or 0 copies of DSCAM (P = 0.838, ANOVA, n = 3 [Dscam+/+], n = 7 [Dscam+/–], n = 4 [Dscam–/–]). *P < 0.05.

References

    1. Stoll C, Dott B, Alembik Y, Roth MP. Associated congenital anomalies among cases with Down syndrome. Eur J Med Genet. 2015;58(12):674–680. doi: 10.1016/j.ejmg.2015.11.003. - DOI - PubMed
    1. Moore SW. Down syndrome and the enteric nervous system. Pediatr Surg Int. 2008;24(8):873–883. doi: 10.1007/s00383-008-2188-7. - DOI - PubMed
    1. Wallace RA. Clinical audit of gastrointestinal conditions occurring among adults with Down syndrome attending a specialist clinic. J Intellect Dev Disabil. 2007;32(1):45–50. doi: 10.1080/13668250601146761. - DOI - PubMed
    1. Lake JI, Heuckeroth RO. Enteric nervous system development: migration, differentiation, and disease. Am J Physiol Gastrointest Liver Physiol. 2013;305(1):G1–24. doi: 10.1152/ajpgi.00452.2012. - DOI - PMC - PubMed
    1. Avetisyan M, Schill EM, Heuckeroth RO. Building a second brain in the bowel. J Clin Invest. 2015;125(3):899–907. doi: 10.1172/JCI76307. - DOI - PMC - PubMed

Publication types

MeSH terms

Substances