. 2019 Apr 18;5(10):e124213.
doi: 10.1172/jci.insight.124213.

Aged marrow macrophages expand platelet-biased hematopoietic stem cells via Interleukin1B

Affiliations

Aged marrow macrophages expand platelet-biased hematopoietic stem cells via Interleukin1B

Benjamin J Frisch et al. JCI Insight. .

Abstract

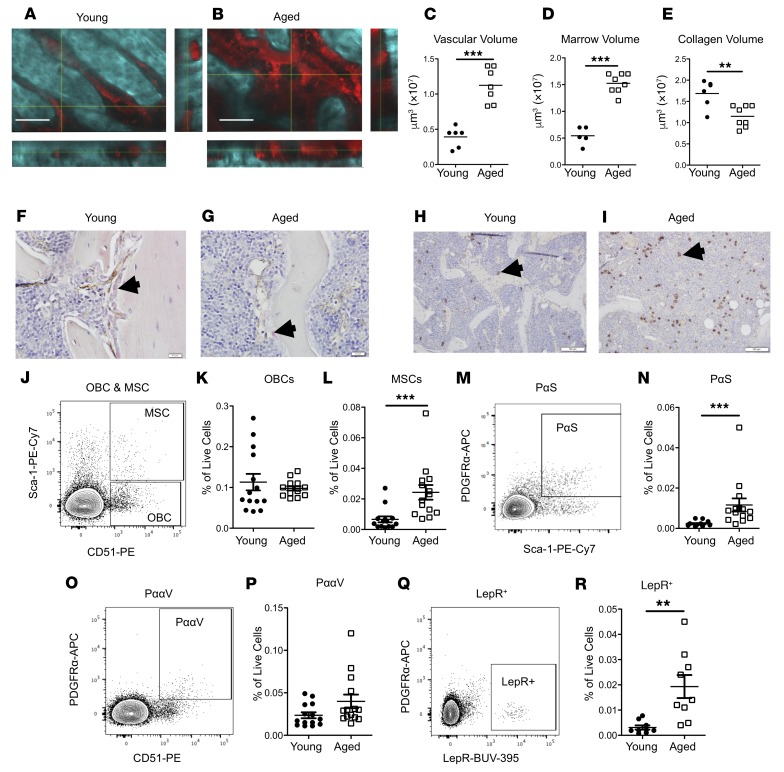
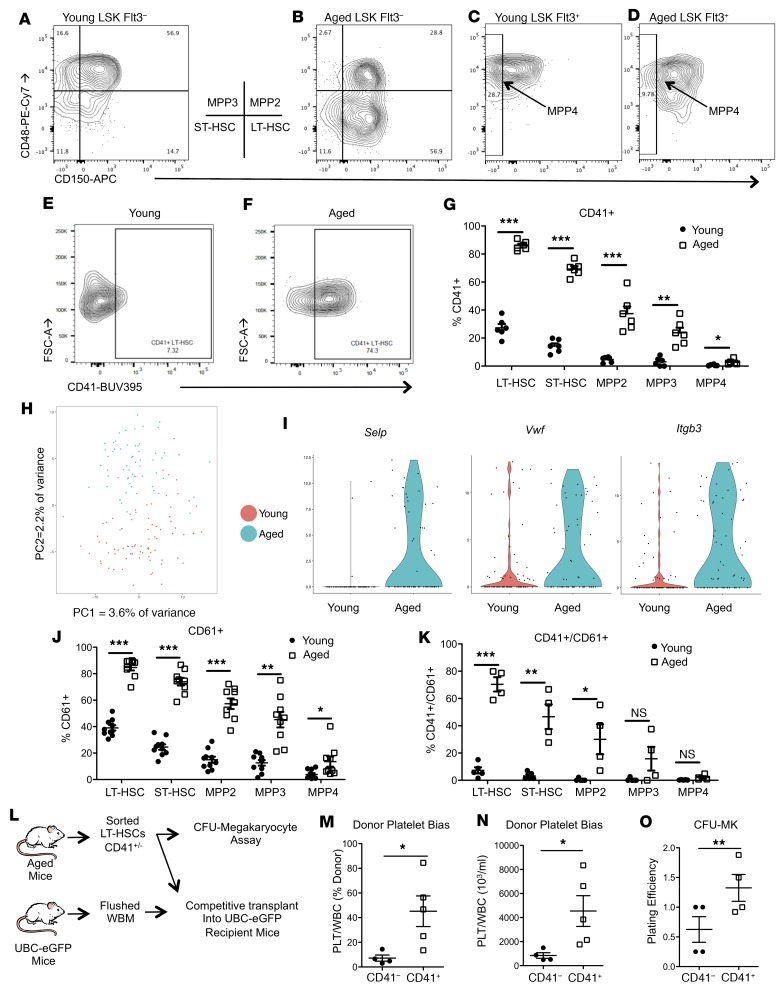
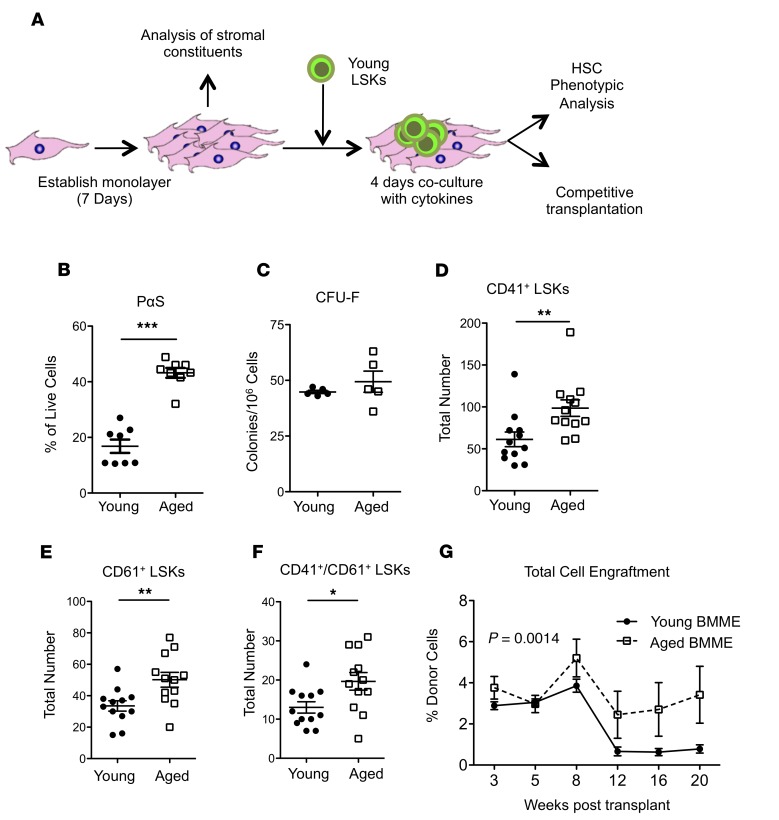
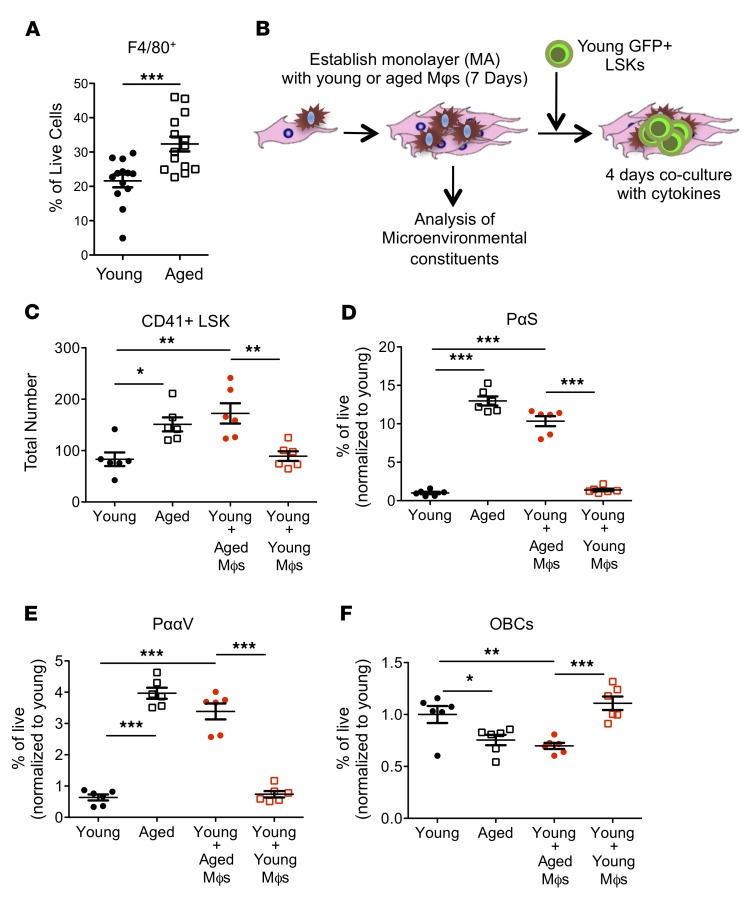
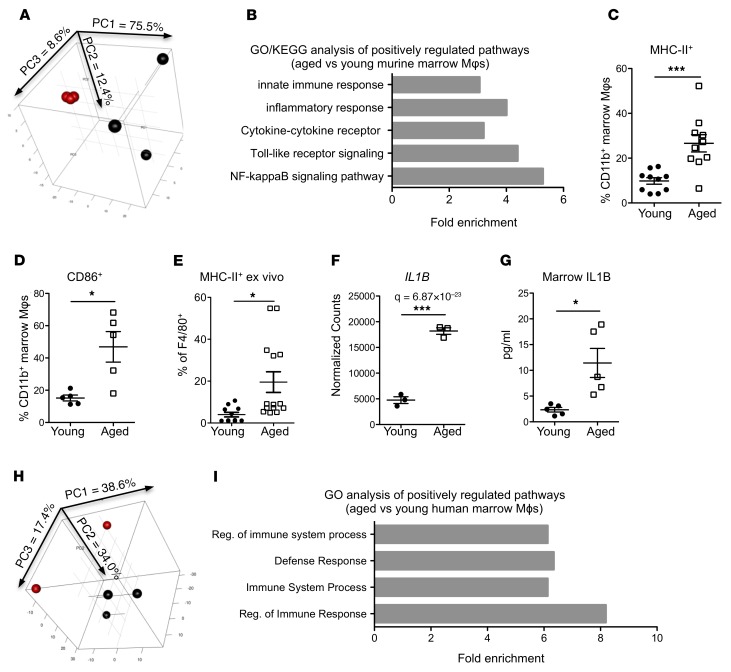
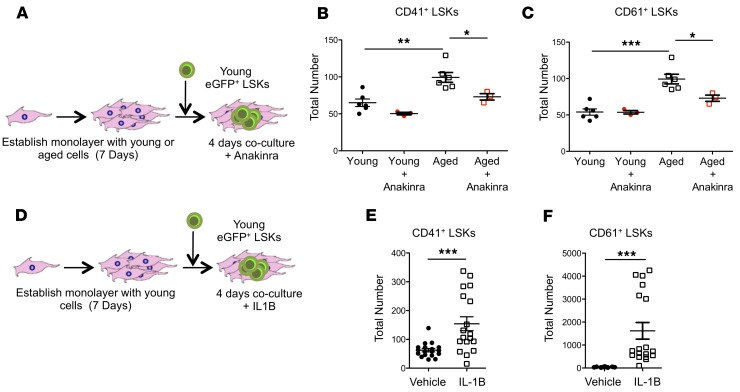
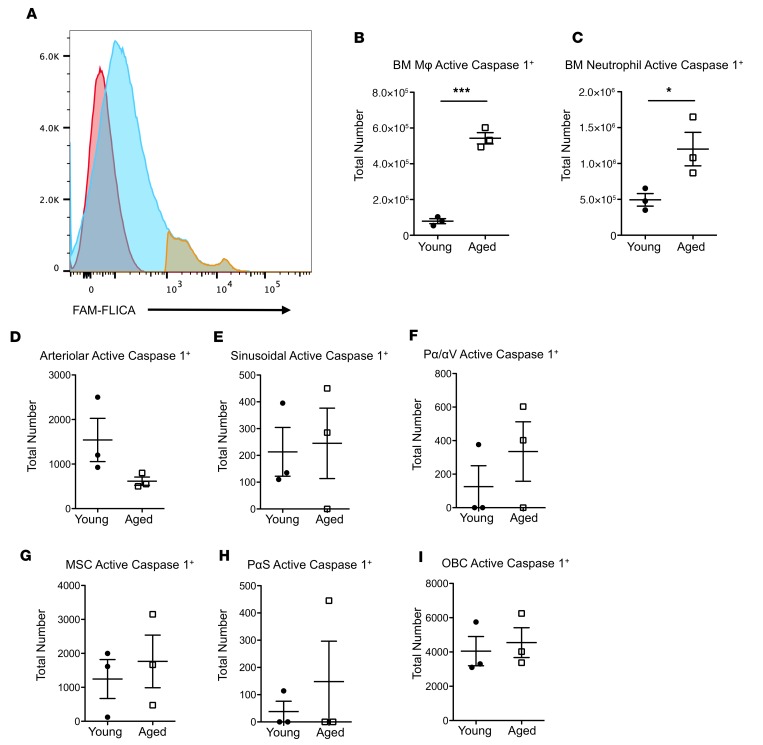
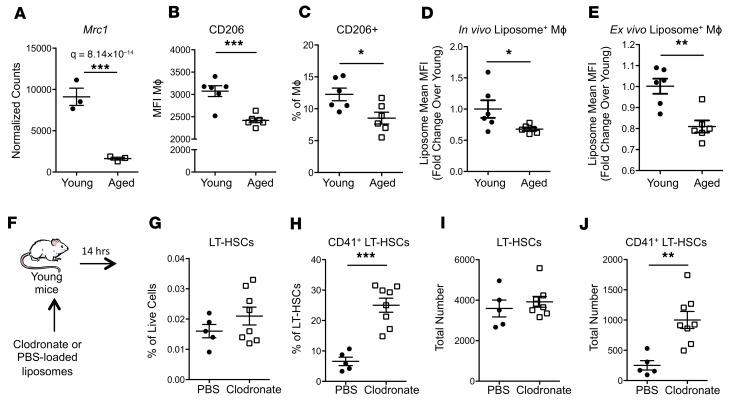
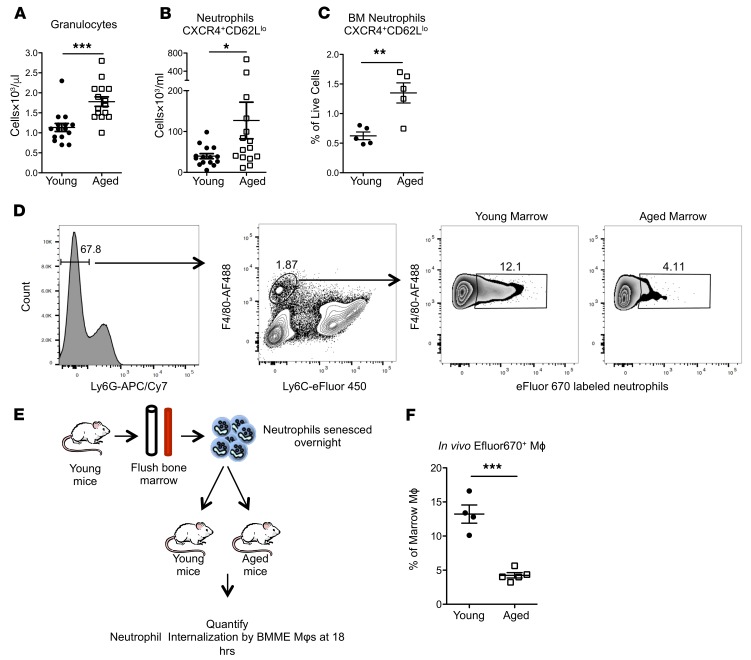
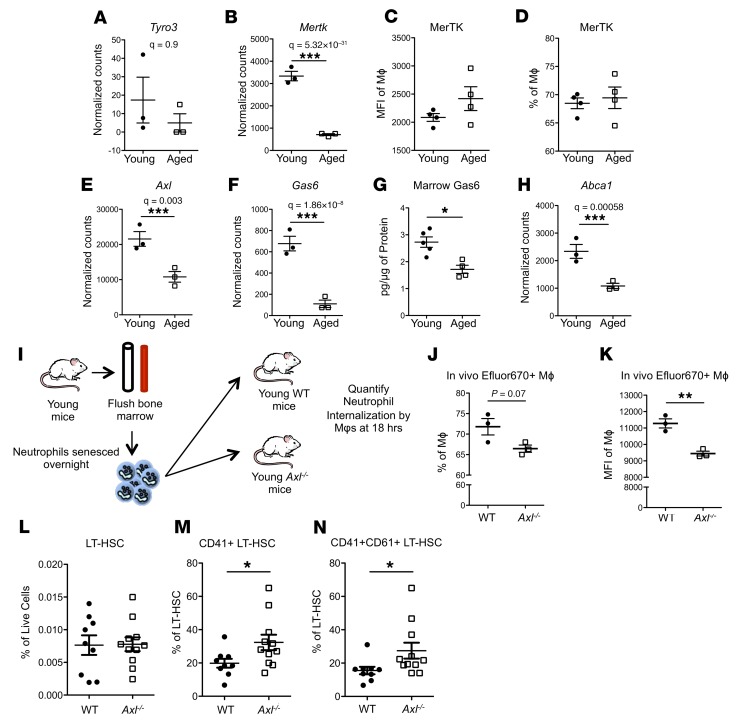
The bone marrow microenvironment (BMME) contributes to the regulation of hematopoietic stem cell (HSC) function, though its role in age-associated lineage skewing is poorly understood. Here we show that dysfunction of aged marrow macrophages (Mφs) directs HSC platelet-bias. Mφs from the marrow of aged mice and humans exhibited an activated phenotype, with increased expression of inflammatory signals. Aged marrow Mφs also displayed decreased phagocytic function. Senescent neutrophils, typically cleared by marrow Mφs, were markedly increased in aged mice, consistent with functional defects in Mφ phagocytosis and efferocytosis. In aged mice, Interleukin 1B (IL1B) was elevated in the bone marrow and caspase 1 activity, which can process pro-IL1B, was increased in marrow Mφs and neutrophils. Mechanistically, IL1B signaling was necessary and sufficient to induce a platelet bias in HSCs. In young mice, depletion of phagocytic cell populations or loss of the efferocytic receptor Axl expanded platelet-biased HSCs. Our data support a model wherein increased inflammatory signals and decreased phagocytic function of aged marrow Mφs induce the acquisition of platelet bias in aged HSCs. This work highlights the instructive role of Mφs and IL1B in the age-associated lineage-skewing of HSCs, and reveals the therapeutic potential of their manipulation as antigeronic targets.

Keywords: Aging; Bone marrow; Hematology; Hematopoietic stem cells.


Conflict of interest statement

Conflict of interest: The authors have declared that no conflict of interest exists.

Figures

Figure 1
Figure 1. Aged mice have remodeling of their bone marrow and expansion of MSC populations.
(A and B) Representative images of 2-photon intravital microscopy of calvaria; second harmonic generation (collagen; blue) and vasculature (70-kDa dextran; red). Scale bars: 100 μm. (CE) Vascular (C), marrow (D), and collagen (E) volume (n = 5–7 mice per group). (F and G) Immunohistochemistry of osteocalcin (pink) and endomucin (brown). Scale bars: 10 μm. Black arrows indicate osteocalcin-positive osteoblasts. (H and I) Immunohistochemistry for LepR+ cells (brown). Scale bars: 100 μm. Black arrows indicate LepR+ perivascular cells. (JR) Representative flow cytometry plots (J, M, O, and Q) and analysis quantification (K, L, N, P, and R) of marrow osteoblastic cells (OBCs: CD45TER119CD31CD51+SCA1 cells, J and K), marrow multipotent stromal cell populations (MSCs: CD45TER119CD31CD51+SCA1+ cells, J and L), PαS (CD45TER119CD31CD140a+SCA1+ cells, M and N), PααV (CD45TER119CD31CD140a+CD51+ cells, O and P) (n = 13–14 mice per group), and leptin receptor–positive (LepR+) (CD45TER119CD31LepR+ cells, Q and R) (n = 9 mice per group). Each symbol represents an individual mouse; data represent mean ± SEM. P values, 2-tailed Student’s t test: **P < 0.01, ***P < 0.001.
Figure 2
Figure 2. Aged mice have expanded megakaryocyte-biased HSCs.
(AG) Representative flow cytometry of CD41 expression and its quantification across LSK subsets in young and aged mice (n = 6 mice per group). (H) Principal component analysis (PCA) plot of single LT-HSCs from young and aged mice. Variance of each PCA is shown. (I) Violin plots of Selp (ANOVA P = 4.94 × 10⁻⁷), Vwf (P = 0.003051854), and Itgb3 (P = 6.38 × 10⁻⁵) expression from young and aged LT-HSCs (n = 76 young HSCs and 63 aged HSCs). (J and K) Quantification of CD61 (n = 9 mice per group) and of CD41/CD61 (n = 5 mice per group) expression across LSK subsets in young and aged mice. (L) Schematic representation of experimental design for analysis of megakaryocytic skewing potential of CD41+ LT-HSCs. (M and N) Donor platelet bias of sorted CD41+ (n = 5 recipients) versus CD41 (n = 4 recipients) LT-HSCs as percent donor and total number. (O) Quantification of in vitro megakaryocytic CFUs (CFU-MK) per 100 sorted CD41+ versus CD41 LT-HSCs (n = 4 per group). (G, J, K, and M–O). Each symbol represents an individual mouse; data represent mean ± SEM. P values, 2-tailed Student’s t test except as noted: *P < 0.05, **P < 0.01, ***P < 0.001.
Figure 3
Figure 3. Dysfunction in aged MSCs and regulation of HSCs by aged microenvironments.
(A) Schematic for in vitro coculture of HSCs and stromal cells. (B) Quantification of PαS cells from in vitro cultures derived from young and aged mice (n = 8 wells per group). (C) Quantification of fibroblastic CFUs (CFU-F) from young and aged mice (n = 5 young and aged mice). (DF) Quantification of CD41 (D), CD61 (E), and CD41/CD61 (F) expression in LSKs grown on young or aged BMME cells (n = 12 young and aged per well). (G) Engraftment of HSCs grown on either young or aged BMME cells (n = 5 recipients per group). (BF) Each symbol represents an individual mouse; data represent mean ± SEM. P values: (BF) 2-tailed Student’s t test, *P < 0.05, **P < 0.01, ***P < 0.001, ****P < 0.0001; (G) P = 0.0014 results from a 2-way ANOVA between young and aged longitudinally, **P < 0.01 between young and aged longitudinally.
Figure 4
Figure 4. Aged macrophages recapitulate age-related changes to HSCs and the BMME in vitro.
(A) F4/80+ cells in BMME cultures derived from young and aged marrow (n = 14 wells per group). (B) Schematic for addition of sorted Mφs to BMME coculture. (C) Expression of CD41 on GFP+ young LSKs after coculture with BMME cells with or without young or aged Mφs (n = 6 wells per group). (DF) Quantification of PαS cells (D), PααV cells (E), and OBCs (F) as defined in Figure 1 (n = 6 wells per group). Each symbol represents an individual mouse; data represent mean ± SEM. P values: (A) 2-tailed Student’s t test, ***P < 0.001; (CF) 1-way ANOVA with Tukey’s multiple-comparisons post-test, *P < 0.05, **P < 0.01, ***P < 0.001.
Figure 5
Figure 5. Aged marrow macrophages have a proinflammatory phenotype and elevated IL-1B expression.
(A) PCA plot of young (red) and aged (black) marrow Mφs isolated as shown in Supplemental Figure 3 (n = 3 mice per group). Variance of each PCA is shown on the axes. (B) Upregulated GO and KEGG categories in aged Mφs compared with young (n = 3 mice per group). See also Supplemental Tables 3 and 4 for details. (C and D) Expression of MHC-II (C) and CD86 (D) on Mφs from young and aged mice (n = 5–10 mice per group). (E) Expression of MHC-II in Mφs from BMME in vitro cultures (n = 11–14 wells per group). (F) Expression of Il1b in young and aged Mφs (n = 3 mice per group). (G) Quantification by ELISA of IL-1B protein in marrow of young and aged mice (n = 5 per group). (H) PCA plot of young (red, n = 2) and aged (black, n = 3) human marrow Mφs isolated as shown in Supplemental Figure 4. Variance of each PCA is shown on the axes. (I) Upregulated GO processes in aged human Mφs compared with young (n = 2–3 human marrow per group). Each symbol represents an individual mouse; data represent mean ± SEM. P values, 2-tailed Student’s t test: *P < 0.05, ***P < 0.001.
Figure 6
Figure 6. Exposure to IL-1B increases megakaryocytic HSCs ex vivo.
(A) Schematic of coculture LSKs and young or aged stromal cells with anakinra (rhIL1RA). (B and C) Expression of CD41 (B) and CD61 (C) on LSKs grown in vitro with young or aged BMME cells with or without anakinra (n = 3–6 wells per group). (D) Schematic of coculture LSKs and young or aged stromal cells with recombinant IL-1B. (E and F) Expression of CD41 (E) and CD61 (F) in LSKs grown in vitro in young BMME cultures with IL-1β (n = 18 wells per group). Each symbol represents an individual mouse; data represent mean ± SEM. P values: (B and C) 1-way ANOVA with Tukey’s multiple-comparisons post-test, *P < 0.05, **P < 0.01, ***P < 0.001; (E and F) 2-tailed Student’s t test, ***P < 0.001.
Figure 7
Figure 7. Increased caspase-1 activity in marrow macrophages and neutrophils but not in other BMME populations in aged mice.
(A) Representative flow cytometry of bone marrow cells stained with FAM-FLICA (active caspase-1) (blue) and FAM-FLICA+ gate (yellow) overlaid onto a FAM-FLICA fluorescence minus one (FMO) control (red). (B and C) Number of marrow Mφs and neutrophils with caspase-1 activity from young and aged animals (n = 3 mice per group). (DI) Number of microenvironmental cells with caspase-1 activity from young and aged animals. Populations quantified include arteriolar endothelial cells (CD45TER119CD31+SCA1+) (D), sinusoidal endothelial cells (CD45TER119CD31+SCA1+) (E), PααV cells (CD45TER119CD31CD140a+CD51+) (F), MSCs (CD45TER119CD31CD51+SCA1+) (G), PαS cells (CD45TER119CD31CD140a+SCA1+) (H), and OBCs (CD45TER119CD31CD51+SCA1) (I) (n = 3 mice per group). Each symbol represents an individual mouse; data represent mean ± SEM. P values, 2-tailed Student’s t test: *P < 0.05, ***P < 0.001.
Figure 8
Figure 8. Aged marrow macrophages have defective phagocytosis and loss of macrophages is sufficient to drive premature megakaryocytic skewing of HSCs in vivo.
(A) Expression of scavenger receptor Mrc1 in young and aged marrow Mφs (n = 3 mice per group). (B and C) Quantification of cell surface expression of MRC/CD206 by mean fluorescence intensity (MFI) (B) and percentage of marrow Mφs (C) in marrow from young and aged mice (n = 6 mice per group). (D) Quantification of liposome uptake by marrow Mφs (n = 6 wells per group). (E) Quantification of liposome uptake by Mφs in BMME cultures (n = 6 wells per group). (F) Schematic of clodronate liposome administration and bone marrow analysis. (GJ) LT-HSC frequency (G), CD41 expression (H), total number (I), and total CD41+ (J) 14 hours after clodronate treatment (n = 5–8 mice per group). Each symbol represents an individual mouse; data represent mean ± SEM. P values, 2-tailed Student’s t test: *P < 0.05, **P < 0.01, ***P < 0.001.
Figure 9
Figure 9. Impaired efferocytosis by macrophages in the bone marrow of aged mice.
(A) Quantification of peripheral blood granulocytes (n = 15 mice per group). (B and C) Quantification of senescent peripheral blood (B, n = 15 mice per group) and marrow (C, n = 5 mice per group) neutrophils. (D) Representative flow cytometry plots of young and aged marrow for the identification of Mφs that have phagocytosed senescent neutrophils. (E) Schematic of senescent neutrophil uptake experiment. (F) Quantification of senescent neutrophil engulfment in vivo by marrow Mφs 18 hours after injection (n = 4 mice per group). Each symbol represents an individual mouse; data represent mean ± SEM. P values, 2-tailed Student’s t test: *P < 0.05, **P < 0.01, ***P < 0.001.
Figure 10
Figure 10. Genetic loss of efferocytic capacity is sufficient to drive premature aging phenotypes.
(A and B) Expression of the efferocytosis genes Tyro3 and Mertk in young and aged marrow Mφs (n = 3 mice per group). (C and D) Quantification of MERTK flow cytometric data, MFI (C) and percentage (D) of marrow Mφs. (E and F) Expression of the efferocytosis genes Axl and Gas6 in young and aged marrow Mφs (n = 3 mice per group). (G) Quantification by ELISA of the serum protein level for GAS6 (n = 4 young, 5 aged mice) in young compared with aged murine marrow. (H) Expression of Abca1 in young and aged marrow Mφs (n = 3 mice per group). (IK) Schematic representation (I) and quantification (J and K) of efferocytic capacity of marrow Mφs from young WT and Axl–/– littermates 18 hours after injection, shown as percentage positive Mφs (J) and MFI (K) (n = 3 mice per experimental group). (LN) Quantification of total LT-HSCs (L) and CD41+ (M) and CD41+/CD61+ (N) LT-HSCs from WT and Axl–/– mice (n = 9–11 mice per group). (AN) Each symbol represents an individual mouse; data represent mean ± SEM. P values, 2-tailed Student’s t test: *P < 0.05, **P < 0.01, ***P < 0.001.

References

    1. Jaiswal S, et al. Age-related clonal hematopoiesis associated with adverse outcomes. N Engl J Med. 2014;371(26):2488–2498. doi: 10.1056/NEJMoa1408617. - DOI - PMC - PubMed
    1. Shaw AC, Goldstein DR, Montgomery RR. Age-dependent dysregulation of innate immunity. Nat Rev Immunol. 2013;13(12):875–887. doi: 10.1038/nri3547. - DOI - PMC - PubMed
    1. Akunuru S, Geiger H. Aging, clonality, and rejuvenation of hematopoietic stem cells. Trends Mol Med. 2016;22(8):701–712. doi: 10.1016/j.molmed.2016.06.003. - DOI - PMC - PubMed
    1. Flach J, et al. Replication stress is a potent driver of functional decline in ageing haematopoietic stem cells. Nature. 2014;512(7513):198–202. doi: 10.1038/nature13619. - DOI - PMC - PubMed
    1. Florian MC, et al. A canonical to non-canonical Wnt signalling switch in haematopoietic stem-cell ageing. Nature. 2013;503(7476):392–396. doi: 10.1038/nature12631. - DOI - PMC - PubMed

Publication types